ETHUSDT: Supply Zone Sweep & Rejection | 1:3.2 R:R Short SetupMarket Structure & Thesis:
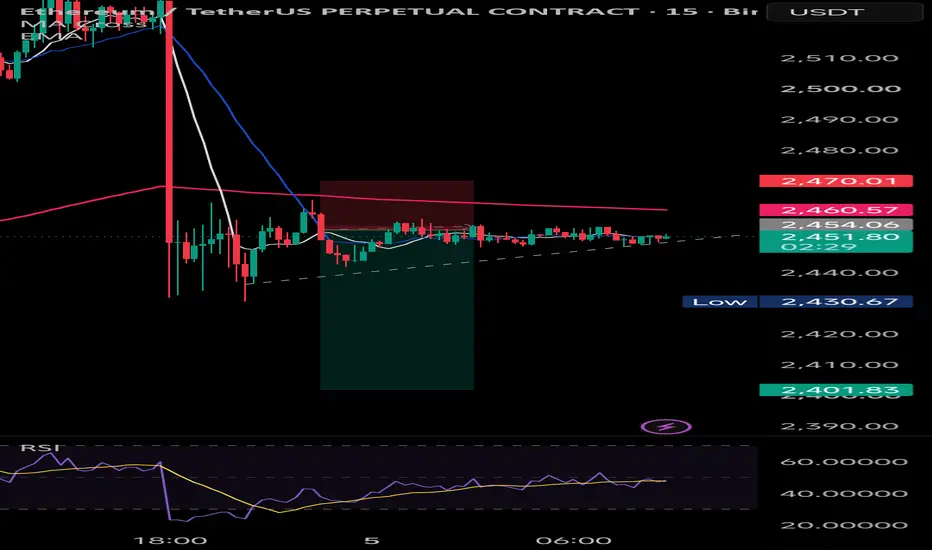
Ethereum staged a strong impulsive run out of the $2,370–$2,400 consolidation base, but momentum is stalling out right at a major overhead liquidity pool ($2,644–$2,655). The 1-hour chart displays a clear double-top / liquidity sweep followed by immediate wick rejection, signaling that aggressive sellers are defending this supply zone.
Trade Execution Details:
Bias: Bearish (Short)
Entry: ~$2,628.64
Stop Loss (SL): $2,654.59 (Above structural high / liquidity sw
In-depth trading ideas
ETHUSDT 4H | Bullish Fair Value Gap Retest Setup
ETH has broken out of a descending trendline and is showing signs of bullish market structure on the 4H timeframe. After a strong impulsive move, price is approaching a key Fair Value Gap (FVG) that could act as support on a retracement.
The plan is to wait for a pullback into the FVG around the 2,525-2,550 region and look for bullish confirmation before entering. This area aligns with the breakout structure and could provide a favorable risk-to-reward opportunity.
If buyers defend the imbala
ETHUSDT 1H Bullish Breakout SetupETHUSDT is showing signs of strength after repeatedly defending the range low around the $2,400 area. Multiple higher lows have formed within the range, indicating growing buying pressure and a potential accumulation phase before a breakout.
The current trade idea is based on:
✅ Range support holding firmly
✅ Formation of higher lows (ascending structure)
✅ Price reclaiming key resistance near $2,540
✅ RSI recovering and showing bullish momentum
Trade Plan
Entry: On a confirmed breakout a
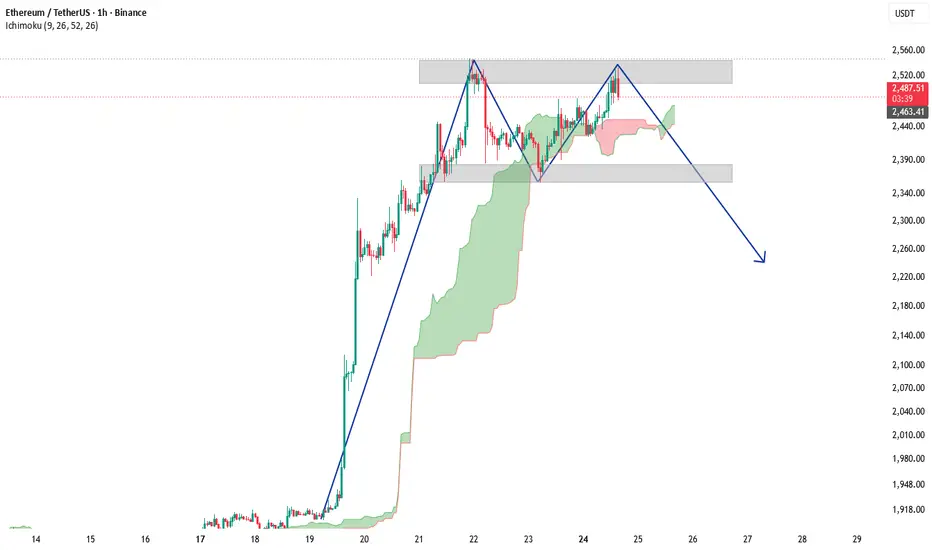
ETHUSDT 4H Double Top Rejection at Range High | Bearish Setup TaDescription:
ETHUSDT is currently trading inside a well-defined 4-hour consolidation range after a strong impulsive rally. Price recently tested the range highs for a second time and faced strong rejection, creating a potential double top formation near the 2,550 resistance zone.
The current structure shows buyers struggling to break above range resistance while price remains vulnerable near the upper boundary. In addition, the recent bounce from support has retested a key Fair Value Gap (FVG)
Ethereum (ETH) Short-Term Analysis (ETH) Short-Term Analysis | 🔥 Ethereum (ETH) Short-Term Analysis (ETH) Short-Term Analysis | Key Level to Watch
📊 Ethereum has reached a resistance level in the short term, where a bearish divergence has also formed. ⚠️
🔑 However, the key point is that if ETH manages to break below the $2,360 support level, an M-shaped pattern (Double Top) could potentially form. 📉
👀 This level could therefore be very important for Ethereum’s next short-term move.
⚠️ Disclaimer: This is only a technical analysis and is not financial ad
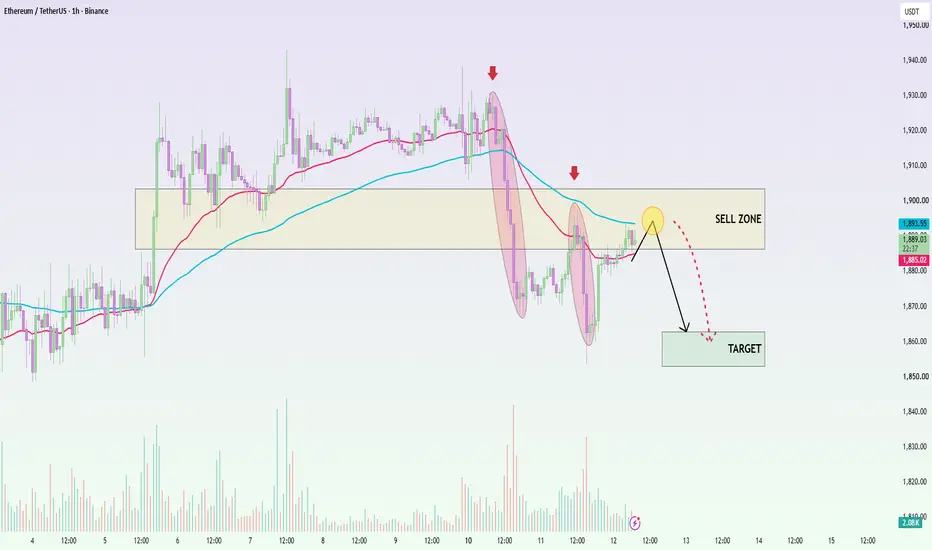
ETHUSDT: Bearish setup remain, Next target sessionETHUSDT is trading around 1,890 USDT; while it has staged a slight recovery following a sharp drop, it has yet to reclaim higher price levels. Reuters reports that Ether has seen only modest gains as the market awaits tonight's US CPI data.
Macroeconomic factors currently favor a bearish scenario, with the DXY edging up and investors remaining cautious ahead of the inflation figures. Should the CPI exceed expectations, expectations of a Fed rate hike could resurge, placing further pressure on t
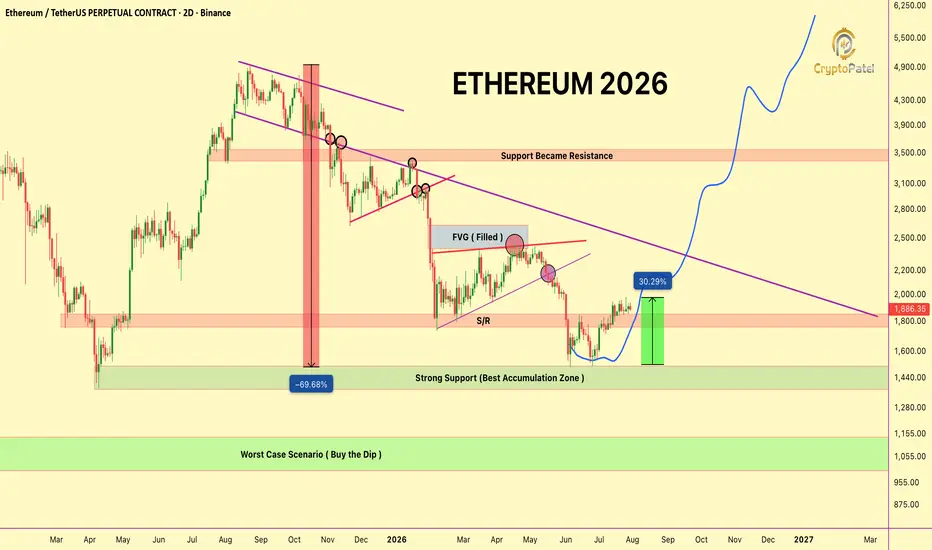
Ethereum Next Move Will Decide Everything: $10K Rally or $1K ?Ethereum Next Move Will Decide Everything: $10K Rally or $1K Crash?
CRYPTOCAP:ETH is currently trading around $1,900, delivering a strong recovery from the $1,500 accumulation zone that I highlighted earlier. The $1,500–$1,600 accumulation range has now produced approximately 30% upside, exactly as anticipated. I hope many of you were able to capitalize on the setup.
Now the focus shifts to the next major high-timeframe hurdle.
The $2,400–$2,500 region remains the most critical resistance o
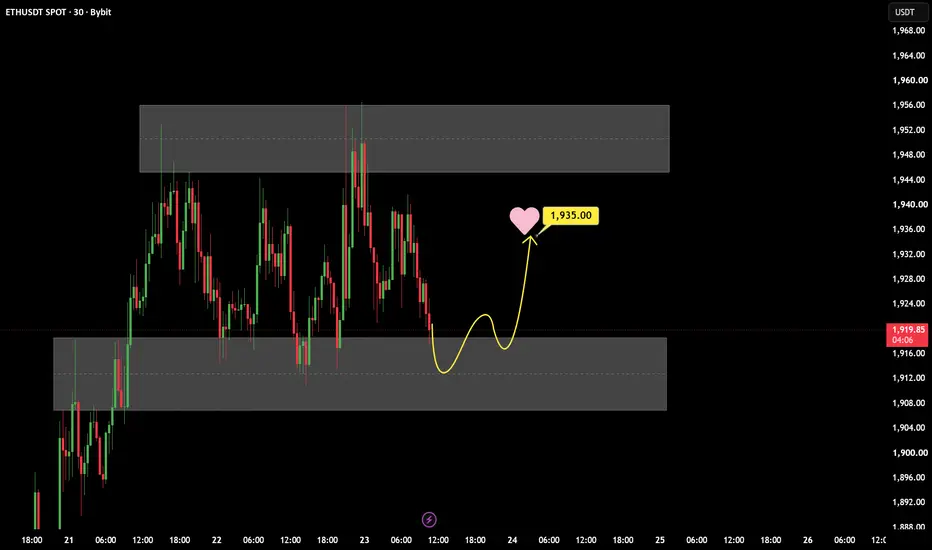
ETHUSDT Near Major Demand – Is a Rebound Coming?ETHUSDT is approaching a well-defined support zone, an area that has repeatedly attracted buyers and produced strong bullish reactions over the past few sessions. This demand zone has consistently prevented deeper declines, making it a critical level to monitor.
If buyers defend this area once again and price begins to print bullish confirmation—such as strong rejection wicks or a bullish reversal candle—the current pullback could turn into another recovery. In that case, ETHUSDT may advance to
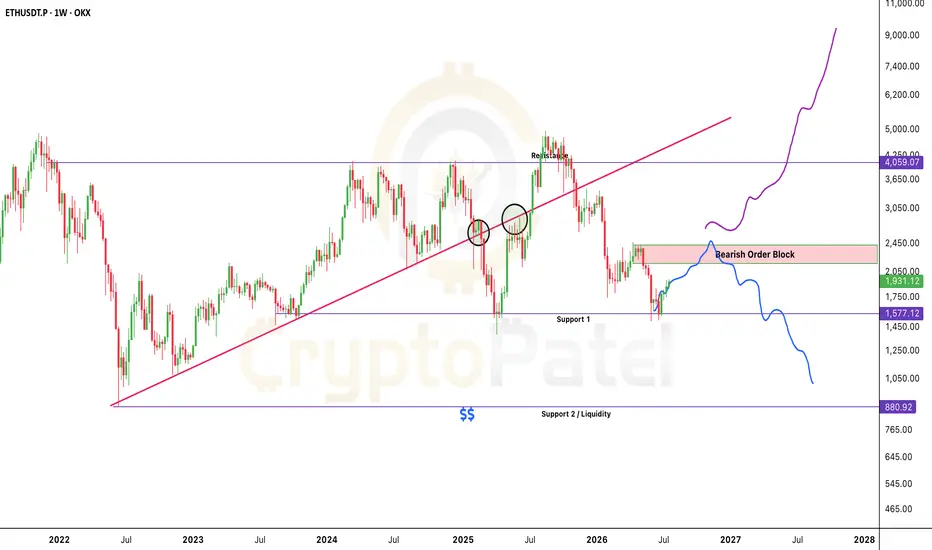
Ethereum $10K Or $1K? This Zone Will Decide Everything.Ethereum $10K Or $1K? This Zone Will Decide Everything.
My technical outlook on CRYPTOCAP:ETH :
Ethereum is likely to extend its recovery toward the $2,160–$2,400 region. This is a major HTF Bearish Order Block + Fair Value Gap (FVG), making it the most important resistance zone on the chart.
Bullish scenario:
A confirmed HTF close above $2,400 would invalidate the current bearish structure and shift the HTF trend bullish, opening the door toward $7K–$10K.
Bearish scenario:
If ETH gets rejec
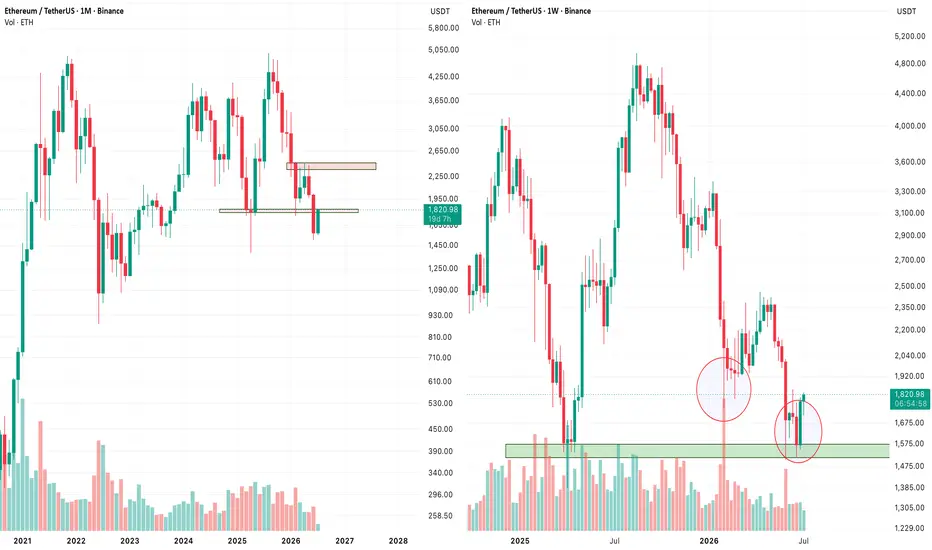
Ethereum at Make or Break pointOn a monthly chart ETH did a bad close by closing the previous pump's close. But on a weekly chart it has made a very good close by doing a bullish engulfing candle at facing a strong resistance at 1800 - 1840 Range. If Ethereum can break the support above and flip this resistance into support this might be the bottom for ethereum and considering that the current macro range is being done for 4 years, we might see All Time highs for ethereum in 2027. But based on the price action the current sup
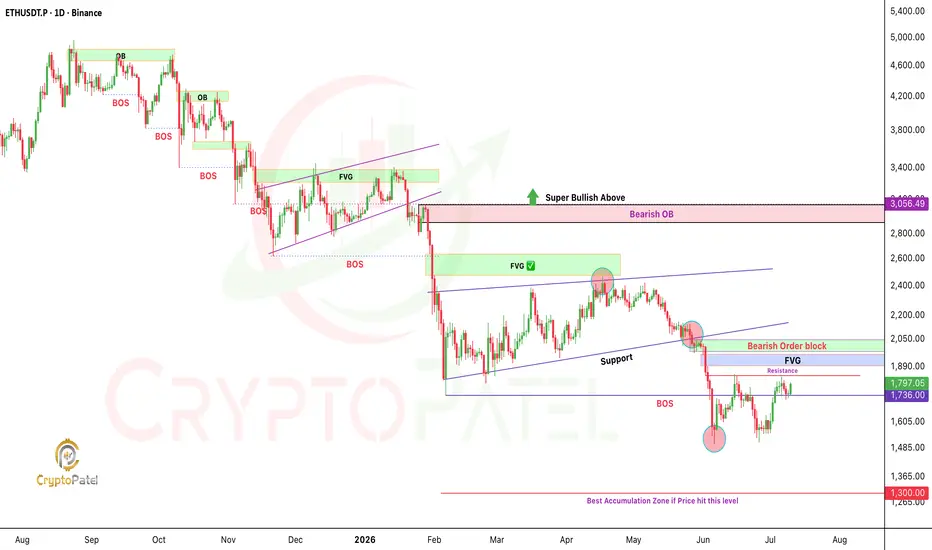
Ethereum Is At A Decision Point: The Next Move Could ?Ethereum Is At A Decision Point: The Next Move Could Define The Trend For Weeks.
CRYPTOCAP:ETH Is Rebounding From The Recent Low, But The Bigger Picture Hasn't Changed.
Price Is Now Approaching A Major Daily Bearish Order Block + Fair Value Gap Around $1,900–$2,000, A Zone Where Sellers Could Step Back In.
My View:
🔹 Bullish Above $2,150(Major HTF Breakout)
🔹 Bearish Below $2,050 Until Proven Otherwise
🔹 Lose $1,730, And A Retest Of $1,500 Becomes Increasingly Likely
This Looks Like A Reli
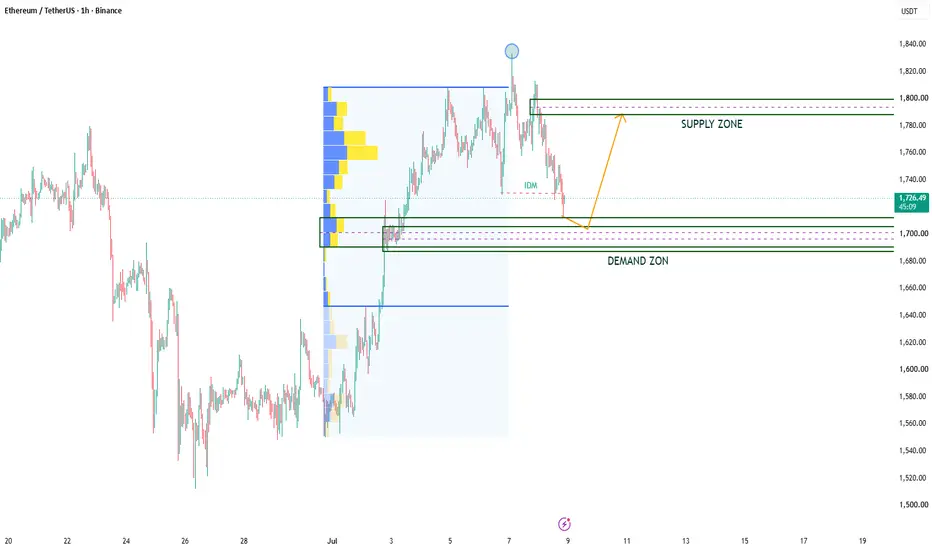
ETHUSDT Bullish SMC Setup | Demand Zone + Volume Profile ConflueThis chart presents a potential bullish Smart Money Concepts (SMC) setup on ETHUSDT (1H), combining Demand & Supply Zones with Volume Profile for additional confluence.
Analysis Overview
✅ Demand Zone identified
✅ Supply Zone marked as the next target
✅ Inducement (IDM) formed before the pullback
✅ High Volume Node (HVN) aligns with the Demand Zone
✅ Waiting for bullish confirmation before entering
Trading Idea
Ethereum has completed a pullback into a high-probability Demand Zone, which also a
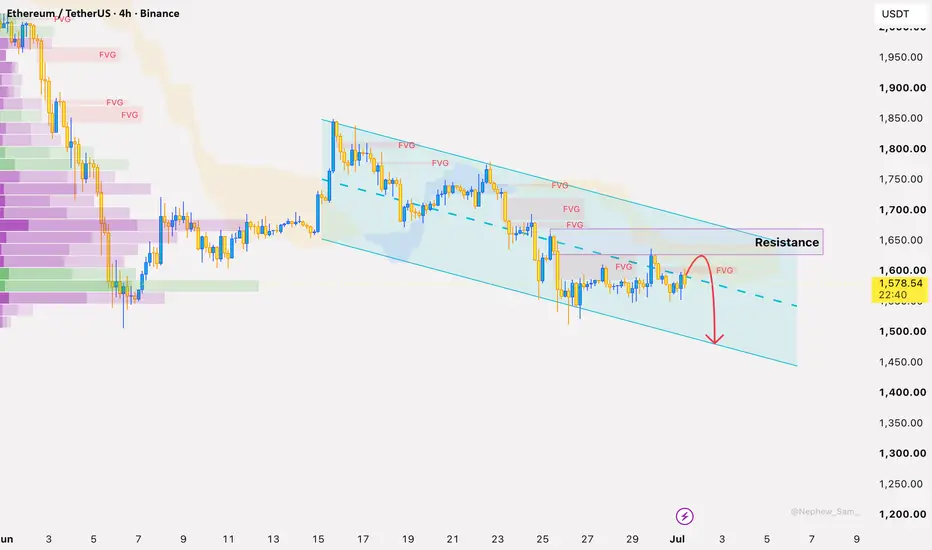
ETHUSDT Sellers Keep Control Below $1,600Ethereum is still struggling below the $1,590–1,600 resistance zone. Every recovery attempt is being absorbed, which shows that sellers remain active and buyers are not strong enough yet.
Unless ETH reclaims this resistance, the bearish continuation setup remains valid.
Trade Setup:
Sell Zone: $1,590 – $1,600
Stop Loss: $1,630
Take Profit 1: $1,550
Take Profit 2: $1,500
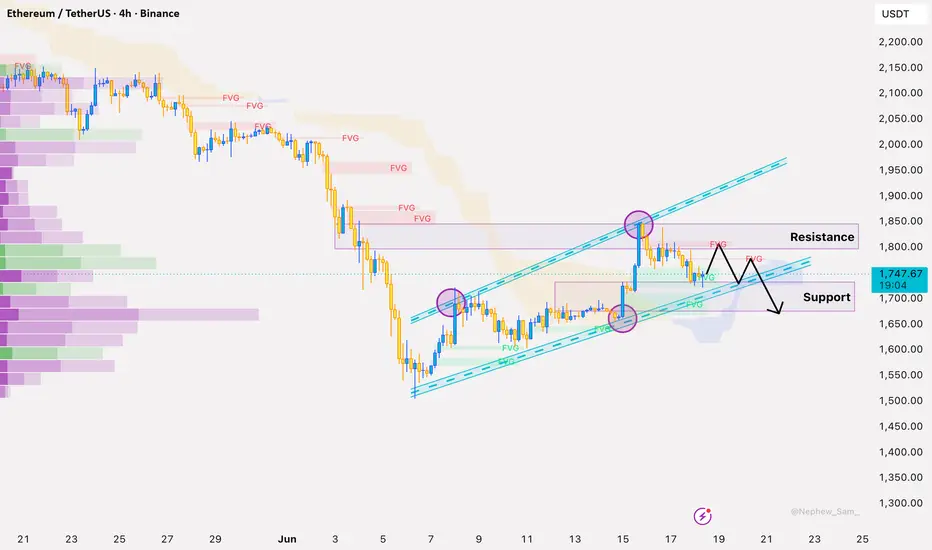
ETHUSDT Rally Slows Near $1,760 ResistanceEthereum has bounced well from the $1,550 area, but the recovery is now losing strength near $1,740–1,760. Buyers have reacted, but they still have not shown enough momentum to confirm a stronger bullish reversal.
For traders, this looks more like a sell-on-rejection setup unless ETH breaks above $1,760 with strength.
Trade Setup:
Sell Zone: $1,740 – $1,760
Stop Loss: $1,790
Take Profit 1: $1,680
Take Profit 2: $1,620
ETH Loses 2,000 as Sellers Stay in ControlETHUSDT remains bearish on H4 after losing the 2,000 psychological level. Price is below both EMAs, while the short EMA near 2,030 and the long EMA near 2,085 continue sloping downward.
The key support zone is 1,980–1,960. If ETH fails to hold this area, downside pressure may extend toward 1,920 and 1,880–1,840.
ETH sentiment remains weak, especially after the break below 2,000 and rising futures open interest, which increases the risk of sharp volatility.
Trade Plan
Buy setup: wait for ETH
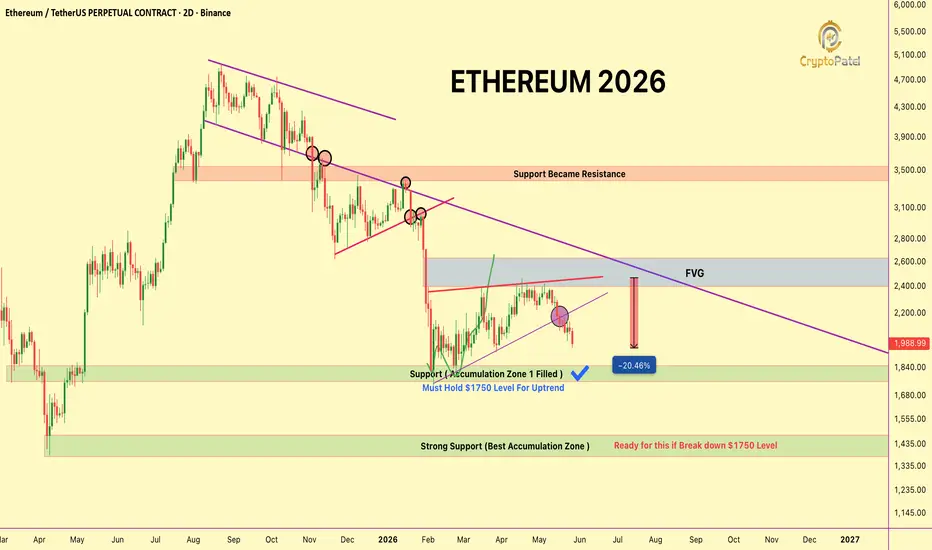
$ETH Down 20% From My FVG Level - Here My Next PlanCRYPTOCAP:ETH Down 20% From My FVG Level. Here Is Exactly Where I Am Buying For $10K-$15K Target
ETH/USDT Playing Out Exactly As Called
ETH rejected clean off the FVG at the $2400-$2600 zone, just like I mapped out. Price is now down nearly 20% from that level and sitting back below $2000.
Structure stays bearish until we reclaim $3050. No reason to fight that.
Here Is My Game Plan From Here:
Price needs to hold $1750 to keep the bullish long term case alive. My first entry is already fille
How FIIs & DIIs Move the Option MarketHow FIIs & DIIs Move the Option Market
Institutional Positioning and Market Impact
Introduction
In the Indian stock market, institutional participants play a major role in deciding short-term momentum, volatility, and overall market direction. Among them, Foreign Institutional Investors (FIIs) and Domestic Institutional Investors (DIIs) are considered the biggest market-moving forces.
Their activity in the futures and options (F&O) segment directly impacts:
Index movement
Option premiums
Vo
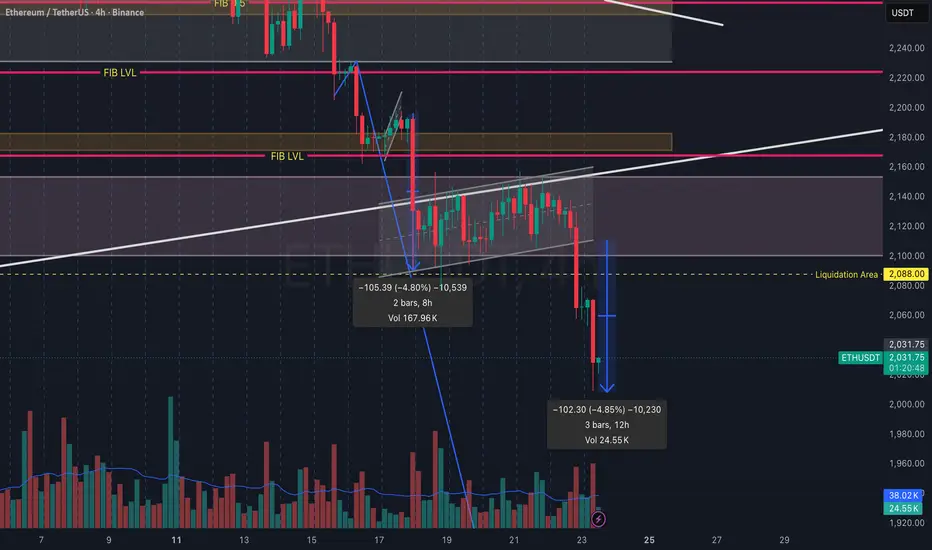
ETH Gave a Perfect Bear Flag Breakdown During NY SessionAfter spending a good amount of time in a consolidation/accumulation range, ETH started showing signs of weakness instead of strength.
The upward move inside the range lacked momentum, volume confirmation was weak, and every bounce looked corrective rather than impulsive.
A classic bear flag and pole pattern was formed on the 4H timeframe:
Initial bearish impulse created a pole of around 102 points
Price then moved into a weak rising consolidation channel
No strong reclaim of key resistan
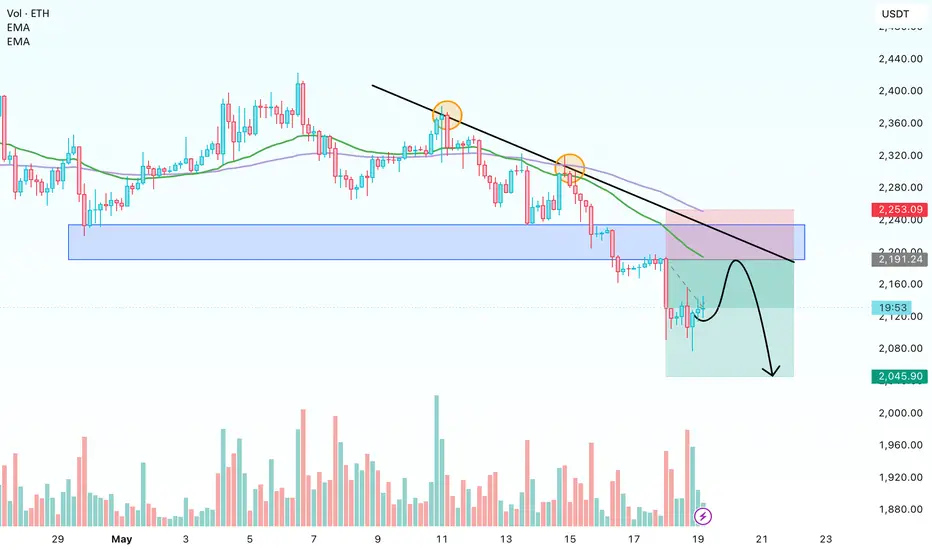
Ethereum Weakens Below Key SupportETH continues showing a bearish structure on the H4 chart after breaking below the 2,300 USD zone.
Price is forming lower highs and lower lows, while recent rebounds remain weak and quickly face selling pressure. After dropping toward 2,080 USD, ETH bounced slightly back to 2,120 USD, but the move still looks like a technical rebound rather than a confirmed reversal.
EMA34 has crossed below EMA89, and both EMAs are sloping downward — a signal that the market may be entering a short-term downtr
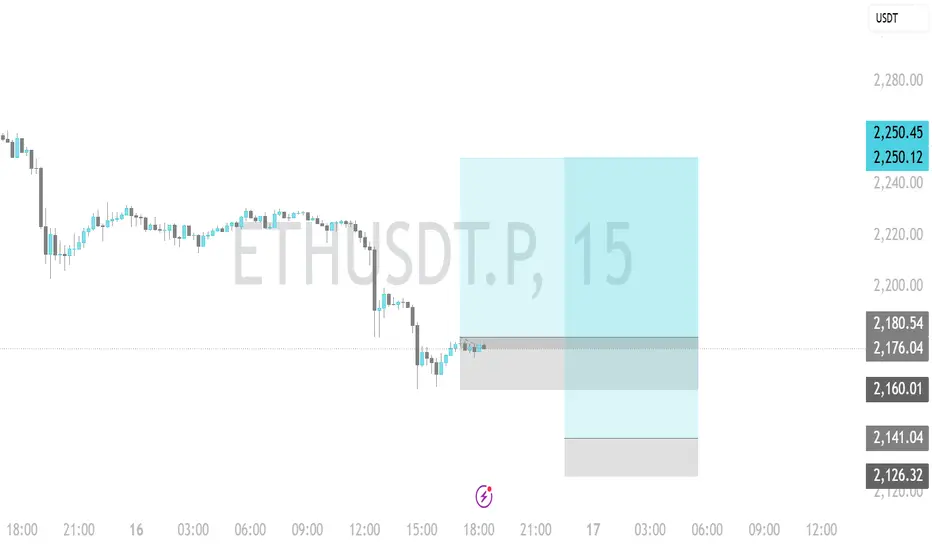
Intraday Long Setup | May 16th 2026 | Valid Until Daily ClosePlan A and Plan B for Intraday setup.
Price has retraced to a strong pivot zone.
Structure remains bearish but with potential for pump back a bit after this pullback.
Tight risk control.
Watch for price reaction within the grey zone. Entry only if confirmation appears
The setup expires at end of the daily candle close.
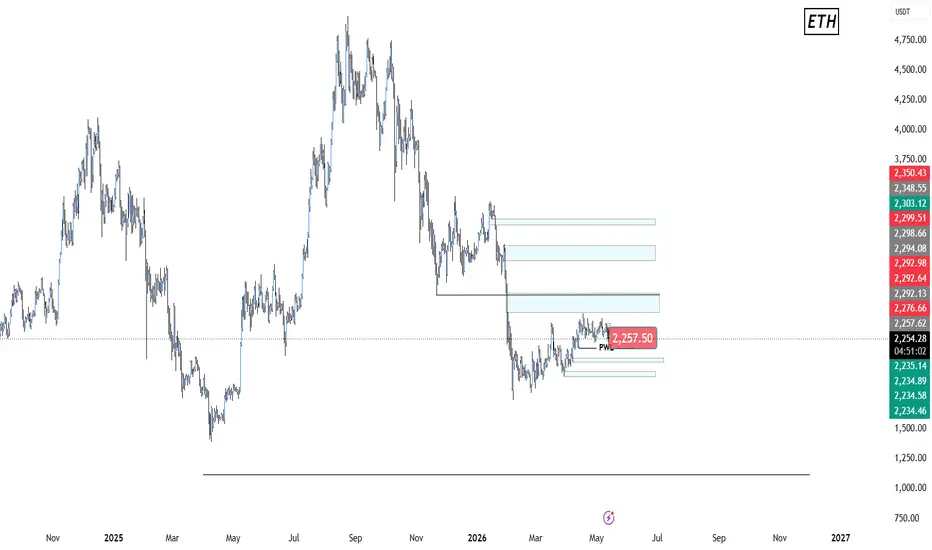
eth next zone to see price to tap and respect these areaeth next zone to see price to tap and respect these area according to my analsysis eth next zone to see price to tap and respect these area according to my analsysiseth next zone to see price to tap and respect these area according to my analsysiseth next zone to see price to tap and respect these area according to my analsysis