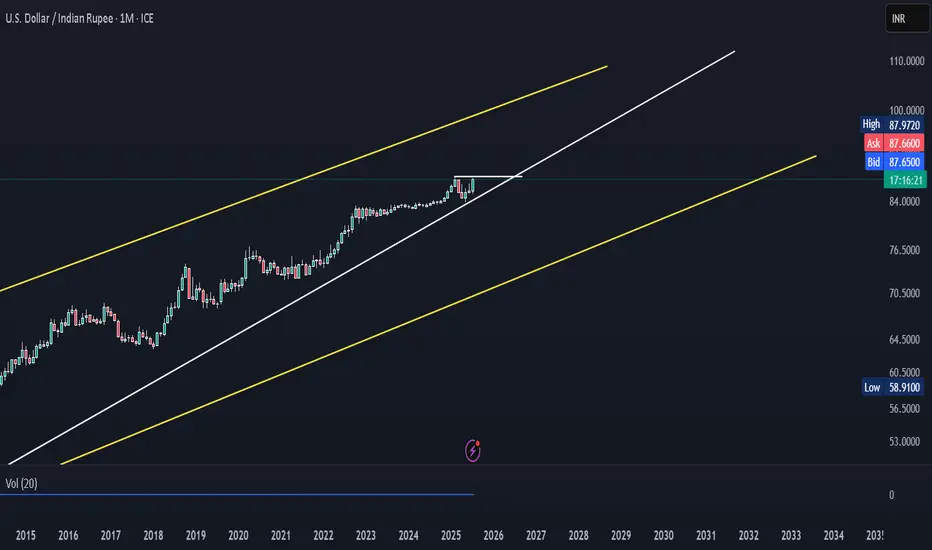
USDINR breakout on day's chart-21Nov25On the daily chart a breakout has been seen in USDINR. Presenting a long term view in my analysis. It is following a parallel bracket movement. Good time to buy Dollar for another 1 year period for range between 91 to 92.
Analysis is for educational purpose, I am not a SEBI advicer.
Related currencies

USDINR about to do a face offIf USDINR breaks the rising channel at 87.60 spot then the rally was three waves and an expanding flat is under development. Wave (C) of an expanded flat is 1.678 times wave (A) and falls below the low of wave (A) if that happens.

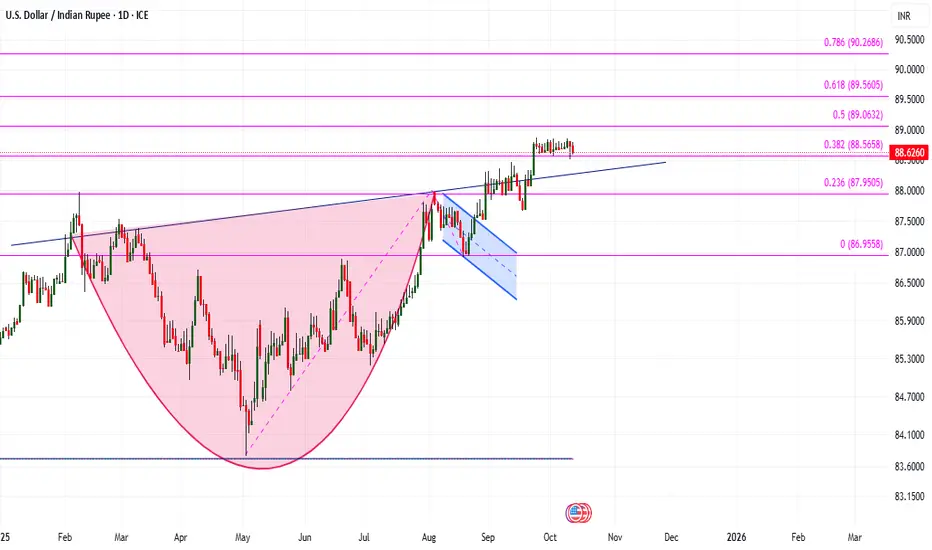
USDINR Breakout: What next ?USDINR gave a 'Cup & Handle' breakout on 23/09/25 and currently in consolidation around 88.5658 levels. Buy on dip seems the way if the support of 88.2667 and hurdle/resistance/target of 89.0632.
The reward-to-risk ratio is approximately 1.66 : 1 ✅
📉 Risk (Stop Loss) = 0.2991
📈 Reward (Target) =
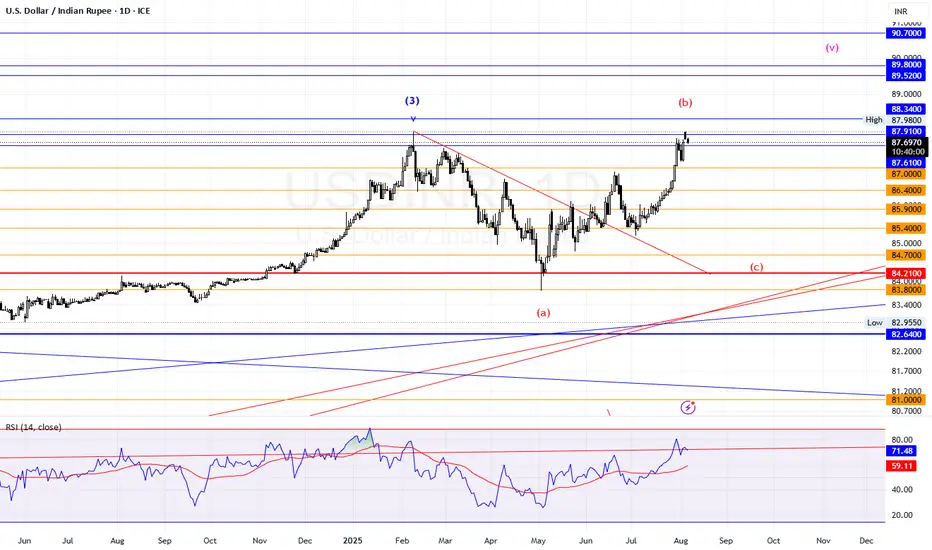
USDINR @ 88.30: BULL or BEAR?LTP 88.30
Immediate upside can be 88.89. From where I expect to see correction towards 84/83.7
As of now I expect 88.89 n correction.
Downside targets: 87.89, 87.28. 86.34, 84.77, 83.70
Note: Upside next targets can be 88.89/92.77/97.82
More bullish scenario would be 101.10, 125 (LEAST PROBABILITY)

USDINR looks prepared for 93 in 180 days or lessThe USDINR chart suggests a potential move towards 93 within the next 180 days. This chart shows the pair consistently trading within an upward channel. The current trend indicates continued bullish momentum, with resistance levels potentially being breached. While past performance doesn't guarantee

USDINR ANALYSIS 06-AUG-2025 @ 87.7LTP 87.7
Resistance: 88
Supports: 87/85.21/83.75
If 88 resists, we can see corrective move towards 85.
Downside can be 87, 86.40, 85.90, 85.40, 84.70, 84.21, 83.80
On the other hand, if it breaks 88, we can see 88.34, 89.50, 89.80. 90.70
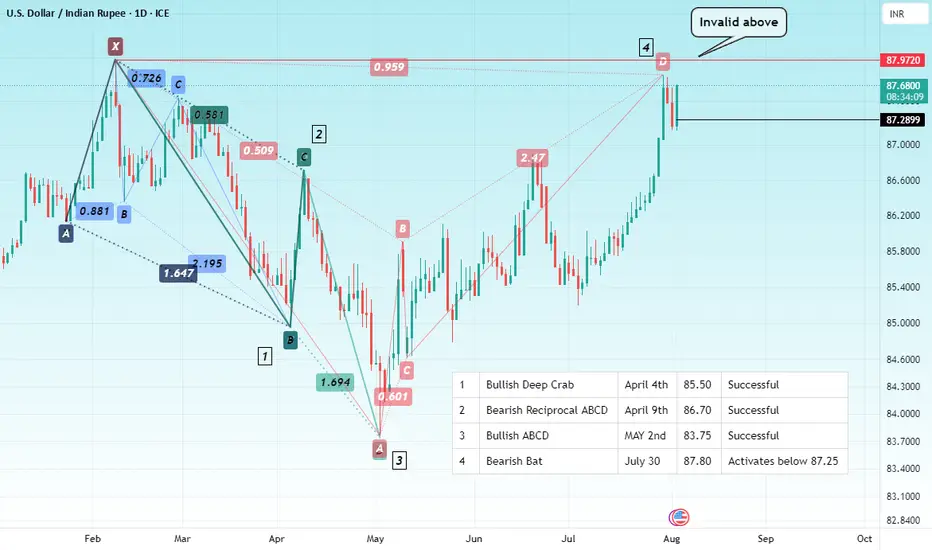
INDIAN RUPEE Hello & welcome to this analysis
$:INR has been swinging from a series of Harmonic Trading Patterns successfully this year as show in the chart.
With RBI POLICY coming up this week, will it be successful for the fourth time in a row?
Whatever it does, there is definitely going to be an impact of
USD/INR pullback possible, USD/MXN eyes 18.95USD/INR surged from 86.30 to nearly 87.85 in just over a week, driven by U.S. President Donald Trump announcing plans to impose a 25% tariff on select Indian exports.
The latest 4H candles show signs of exhaustion, with price stalling near the highs and forming small-bodied candles with upper wicks

usdInrin coming year can hit century 100 if monthly start closing above 87 . bullish view fails if monthly break and closes below 85 with most bearish candel .
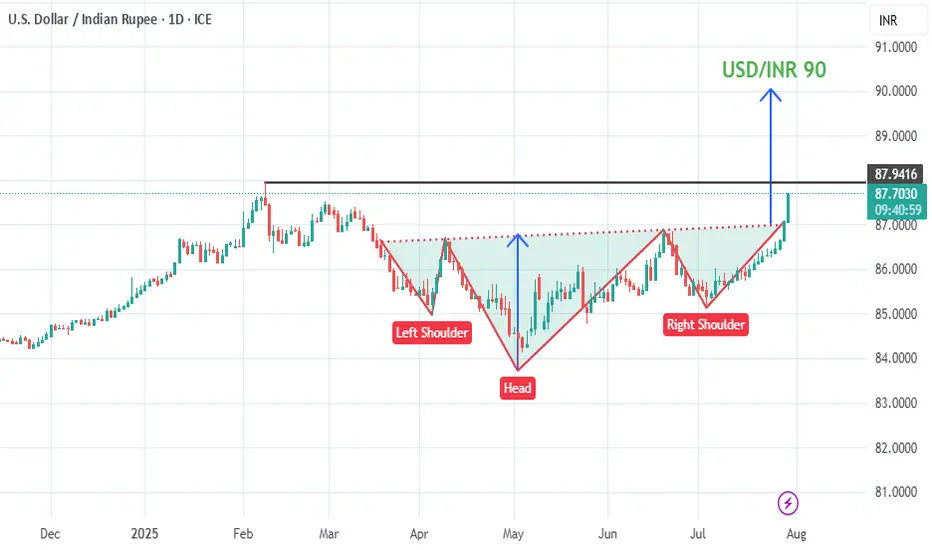
USD INR to reach 90 level in coming weeksUSD INR has given an inverse H&S Breakout which suggests a possible move towards 90.
Sell INR with a SL near 85 and wait for it to cross 90 in coming weeks.
See all ideas
Summarizing what the indicators are suggesting.
Oscillators
Neutral
SellBuy
Strong sellStrong buy
Strong sellSellNeutralBuyStrong buy
Oscillators
Neutral
SellBuy
Strong sellStrong buy
Strong sellSellNeutralBuyStrong buy
Summary
Neutral
SellBuy
Strong sellStrong buy
Strong sellSellNeutralBuyStrong buy
Summary
Neutral
SellBuy
Strong sellStrong buy
Strong sellSellNeutralBuyStrong buy
Summary
Neutral
SellBuy
Strong sellStrong buy
Strong sellSellNeutralBuyStrong buy
Moving Averages
Neutral
SellBuy
Strong sellStrong buy
Strong sellSellNeutralBuyStrong buy
Moving Averages
Neutral
SellBuy
Strong sellStrong buy
Strong sellSellNeutralBuyStrong buy
Displays a symbol's price movements over previous years to identify recurring trends.
Frequently Asked Questions
The current rate of USDINR is 89.1450 INR — it has increased by 0.01% in the past 24 hours. See more of USDINR rate dynamics on the detailed chart.
The value of the USDINR pair is quoted as 1 USD per x INR. For example, if the pair is trading at 1.50, it means it takes 1.5 INR to buy 1 USD.
The term volatility describes the risk related to the changes in an asset's value. USDINR has the volatility rating of 0.57%. Track all currencies' changes with our live Forex Heatmap and prepare for markets volatility.
The USDINR showed a 0.93% rise over the past week, the month change is a 2.11% rise, and over the last year it has increased by 5.53%. Track live rate changes on the USDINR chart.
Learn how you can make money on rate changes in numerous trading ideas created by our community.
Learn how you can make money on rate changes in numerous trading ideas created by our community.
Currencies are usually traded through forex brokers — choose the one that suits your needs and go ahead. You can trade USDINR right from TradingView charts — just log in to you broker account. Check out the list of our integrated brokers and find the best one for your needs and strategy.
When deciding to buy or sell currency one should keep in mind many factors including current geopolitical situation, interest rates, and other. But before plunging into a deep research, you can start with USDINR technical analysis. The technical rating for the pair is buy today, but don't forget that markets can be very unstable, so don't stop here. According to our 1 week rating the USDINR shows the buy signal, and 1 month rating is buy. See more of USDINR technicals for a more comprehensive analysis.