BTCUSD Short opertunity at pullback.As i shared this idea previously, we should enter for short position at this pullback.
As i already predicted this moves of market .
U should follow me to keep yourself updated.
HEDGEUSD trade ideas

Bitcoin's price to reboundAs of now, the BTC is being traded at 61040.7 with a small decrease of -0.84%.
The price of Bitcoin continues to slowly move, resembling a descending wedge pattern instead of consolidation, possibly leading to a 20% increase once it breaks out successfully. Nevertheless, according to the momentum indicators, there is a possibility of further decline before BTC completes the bullish reversal formation.
The RSI has been consistently decreasing since roughly mid-March, suggesting more potential for a negative trend. These indicate that the decrease trend could continue in the short run.
Therefore, the price of Bitcoin may drop further to the $60,000 support level or below, presenting another chance to buy in the $55,000 range.
However, in case the $60,000 mark keeps acting as a support, there is a possibility for Bitcoin's price to rebound before surpassing the upper trendline of the pattern. With a very optimistic scenario, if Bitcoin closes a candlestick above $65,550, it may rise to reclaim the $73,777 high, leading to a potential 20% increase towards the profit target within the falling wedge, aiming for $76,000 and $79,000.

#Bitcoin Heating Up: Analyzing the Bulls' MomentumIt sounds like you're analyzing two potential scenarios for the BTC/USDT pair. Let's break them down:
1. **Retest of $60,000 to $59,000, then liquidation of longs, followed by a rise to $84,000:**
- This scenario suggests that Bitcoin might retest the $60,000 to $59,000 level, possibly to shake out weak hands or test support levels. After this retest, it could liquidate long positions (which could lead to a sharp drop in price) before ultimately rising to $84,000.
- This scenario implies a short-term bearish movement followed by a significant bullish move.
2. **Fall to important support levels of $53,000 to $52,000, then rise to $84,000:**
- In this scenario, Bitcoin would fall to the $53,000 to $52,000 support range, possibly indicating a deeper correction. After reaching this support level, the price would then rally to $84,000.
- This scenario suggests a more significant correction to key support levels before a strong recovery to new highs.
Both scenarios indicate potential short-term volatility and significant price movements. It's essential to consider the overall market conditions, news events, and technical indicators when evaluating these scenarios to make informed trading decisions.

Bitcoin Bybit chart analysis May 8Hello
It's a Bitcoinguide.
If you have a "follower"
You can receive comment notifications on real-time travel routes and major sections.
If my analysis is helpful,
Please would like one booster button at the bottom.
Bitcoin 30-minute chart.
There is no Nasdaq indicator announcement.
Long position entered yesterday,
On the left, the Purple Finger $62916.5 strategy is connected as is.
Today too, there is a high possibility of sideways movement.
This is a position that can fall significantly from the current position 4+6.
Since it is a place with many variables,
Please check the analysis carefully.
*Sky blue finger movement path
Two-way neutral
Short -> Long switching strategy
1. Short position entry zone at $63709.5 / Stop loss when the orange resistance line is broken
2. Long position switching at $62873.5 / Stop loss when the purple support line breaks away
$64,890 Top section long position 1st target -> Good 2nd target
For those who entered long positions yesterday,
You can operate with a stop loss starting from the breakout of the purple support line.
There is no place to go short yet, as there is no 5-minute trend reversal.
Please check if the 5-minute bar trend is changing.
Section 1 at the top is the short position operation section or extreme sideways protection section.
Section 2 at the bottom is at 9 PM, only until an additional 6-hour bar is created.
This is a major rebound period. (A place that can be pushed with maximum force)
Up to the orange resistance line/green support line today.
It is a right-sloping or right-down lateral long section,
If it breaks away from the green support line, it may reach the bottom.
If you touch the 1st target of today's top section
Because it is a place where broken patterns are restored.
The possibility of further rise increases.
After touching the light blue finger short entry section $63709.5
Purple support line -> It can fall significantly below the green support line.
From a long position perspective, it must absolutely break through today.
I have written in detail so far.
I don't know if it was helpful.
Please note that my analysis up to this point is merely for reference and use.
Please operate safely with principled trading and stop loss required.
thank you

Bitcoin Bybit chart analysis May 7Hello
It's a Bitcoinguide.
If you have a "follower"
You can receive comment notifications on real-time travel routes and major sections.
If my analysis is helpful,
Please would like one booster button at the bottom.
Bitcoin 30-minute chart.
There is no Nasdaq indicator announcement.
This is a position with a very high possibility of sideways movement.
According to today's movement, it looks like the upper and lower sides are divided again.
Overall, we created a safe strategy.
*Red finger movement path
Long position strategy
1. $62916.5 long position entry zone / stop loss when breaking out of the green support line
2. $66,407 long position primary target -> Top secondary target
The pattern is maintained without being broken.
With MACD deadcross on the 6-hour chart,
The signal is a bit twisted.
While it is moving sideways, it is important to know where it will move depending on the Nasdaq movement.
The best move for a long position is
While maintaining the purple support line
It would be best if there was a rebound
When touching the green support line,
Because it reaches the dangerous section 4+6
It must break through the orange resistance line.
Number 1 at the top is an upward lateral movement.
I think number 2 at the bottom will be a sideways downward trend.
Within the green parallel line
If there is movement, you can view it as a extreme sideways market.
If BIT continues to succeed in rebounding with Nasdaq
Altcoins can also continue to rise from lows.
Please refer to it
Please keep in mind that my analysis up to this point is merely for reference.
Please operate safely with principled trading and stop loss required.
thank you

Bitcoin Bybit chart analysis May 3Hello
It's a Bitcoinguide.
If you have a "follower"
You can receive comment notifications on real-time travel routes and major sections.
If my analysis is helpful,
Please would like one booster button at the bottom.
Bitcoin 30-minute chart.
There will be a non-agricultural index announcement at 9:30 tonight.
Both Nasdaq and Bitcoin are in a zone with a very high possibility of sideways movement.
If it falls, it may fall significantly.
This is an unfavorable section for long positions.
There are many variables to explain today, so please read the analysis carefully.
Also currently NASDAQ, Bit, Tether dominance
In all, some patterns are broken.
We created the most realistic strategy.
At the bottom left is $57,938 that entered yesterday.
Let’s connect today’s strategy starting from the entry section of the purple finger long position.
*Sky blue finger movement path
Two-way neutral
Short->Long switching strategy
1. $59705.5 short position entry zone / stop loss when the orange resistance line is broken
2. Long position switching at $58848 / Stop loss when the green support line is broken
At the top, $60637.5 long position primary target -> Top secondary target
Short -> Long or Long Wait
Of the two, I think it would be better to start with the section you touch first.
Section 1 at the bottom is the section where the short-term pattern is broken.
Cleanly within the purple support line without touching it
There must be a rebound.
From the breakaway from the green support line, from bottom to section 2 -> Bottom -> 3
It may fall, so be careful.
Next Monday the 6th is a public holiday.
I'm also going to take a break from analysis.
If you drag the analysis text left up or down,
If it rises or falls compared to the current chart screen
I left the support price and resistance price.
I think it would be a good idea to use it while I'm away.
Please note that my analysis up to this point is merely for reference and use.
I hope you operate safely with principled trading and stop loss required.
Thank you for your hard work this week.
thank you

BTC looking solid here. Feds moved to growth, less QT. Bullish I think we're bullish. April showers bring May flowers, Election year bullish historically, media and news pumping FUD all April too while big boys weren't bothered.
Crypto bullish too? $200,000 on the way?
Chart breakout above box

Long Opportunity Bitcoin is looking for buying opportunity after forming expanding channel & has clear formation to make movement to the upside, expecting target to reach at 68K

$BTC Risk-Managed Trading Beyond $64,500CRYPTOCAP:BTC Risk-Managed Trading Beyond $64,500
Red Box Resistance: The crucial resistance level is at $64,500. For a bull scenario, we need to see a confirmed candle close above this level.
Potential Breakout: If #BTCUSDT breaks above the red box, we could witness a rally toward a new all-time high.
Risk Warning: Only enter high leverage positions after clear confirmations to minimize risks. Proper risk management is essential.
#Bitcoin #cryptocurrency

Bitcoin AnalysisBitcoin Analysis
-----------------------
1. Price has tested 20 EMA
2. And Price is NOT showing any weakness to fall
3. This is clear Sideways from Range High and Range Low

BTCUSD again sell on rise till recent high not break On Our Harmonic pattern indicator based trade setup take trade as explained below :-
Early trades Buy or sell below/ above 23.6 %, safe trades buy or sell above / below 41% , after taking trade next upside or downside levels will be target ,
When reverse buy or sell signal appear then book profit on Target or trail SL to 23.6 % If trailing SL hit then early trade can be taken above or below 23.6 and safe trade can b taken above/ below 41% ..
Please note:-
It's working on news based and volitile market very well so exit if SL hit

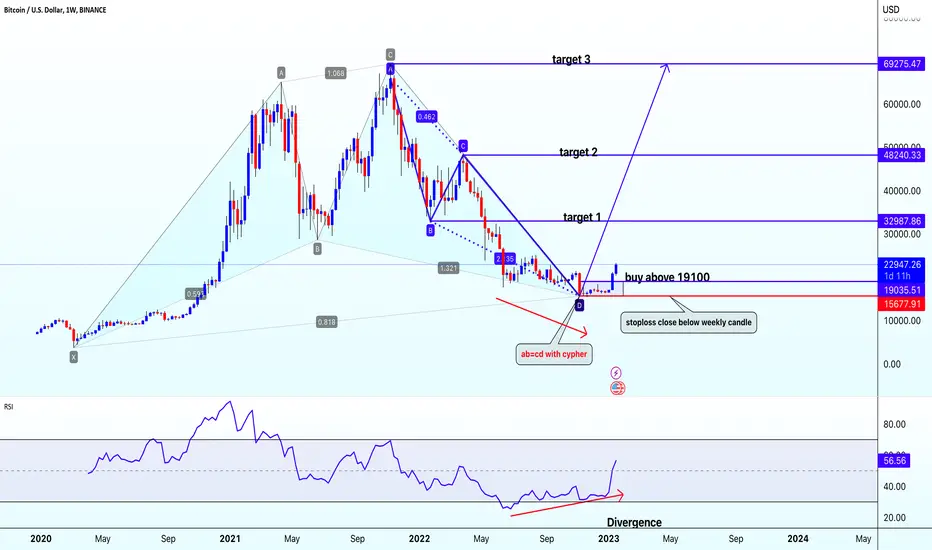
BTCUSDBtcusd
creating cypher harmonic pattern with ab=cd on chart with divergence @ bottom .chart also breakout inside candlestick pattern on daily chart
buy btcusd abpve 19100
closing sl below 15677
target=32980-48240-69275-100000
btc NOW sELLING PRESSUEBitcoin we can expect a fall to the zone 55000 may go upto 52000, right now pattern of flag , with 5 th ray

Bitcoin ending diogonal?spectacular rally in bitcoin after two days of decline..
It appears wave C is an ending diogonal.
Further upside still left.But some more correction
is left before its up trend is resumed.
Follow me to get updates.
Like this post if it helps you.

Important Liquidation Levels for Bitcoin: $50k - $73kImportant Liquidation Levels for Bitcoin: $50k - FWB:73K
#Bitcoin Liquidation Heat Map:
Approximately $3 billion can be liquidated up to $71,715. Key levels to watch:
➡ $67,420: $2.75 Billion in potential liquidations.
➡ $50,000: $5 Billion waiting to be liquidated.
Key Areas to Monitor:
➡ $56.9k - $52.1k: Weaker liquidations.
➡ $59.5k - $58.5k: Heavy liquidation zone.
➡ $52.1k - $50k: Another heavy liquidation zone.
Scenarios:
➡ Below $50k: ~$5+ billion could be liquidated.
➡ Above $74k: $6.1 billion might get liquidated.
Current price is around $63k!
Stay alert!

BTCUSD Is making opertunity for short sellers at this levelAt this bitcoin could go up little bit , and could fall for large amount . As we see big risk to reward ratio .

Important BTC Update:Bulls and Bears Face Off at $64,000BTCUSDT Update: Current Resistance at $63,000
BTC is trading at the crucial $63,000 resistance level.
Next Move:
- Bullish Scenario: A decisive breakout above the $64,000 resistance could trigger an upward rally to a new all-time high.
- Bearish Scenario: Failure to break $64,000 might lead to a downturn, pushing BTC to the year's new low in the $45,000 - $50,000 range.
Keep a close watch on these levels as they will decide the next direction of BTC. Stay tuned for further updates!

Bitcoin Current analysis update#Bitcoin LTF Update
#BTCUSDT bounced back strongly from the $56k support.
- Key resistance at GETTEX:64K ; a break above is bullish.
- Failure to break could mean testing new lows for the year.
CRYPTOCAP:BTC

BITCOIN Chart AnalysisWe know that btc currently happened halving.If we consider previous halving btc now at the best time to invest.Its btc longterm chart analysis.
Currently BTC at best support zone.If brake BTC at 56k range there is a possibilities to drop BTC into 51K range.Currently btc at best zone and consider to bullish sign to invest in BTC.Dont invest whole amount one time into btc.Just consider this level as well to buy oppitunity.

BITCOIN BREAKING TRENDLINE IN 15 MIN CHATA good falling detected on bitcoin
It's showing a fall due to these reason
1. It's following THE 15 M trendline here
2. It's ready to break the neckline
3. In day chat it's showing the heavy bearish pressure
Just grab out will your own risk
With a small amount
Stay connected
Stay happy
Bande mataram
Follow for more

Bitcoin Bybit chart analysis May 2Hello
It's a Bitcoinguide.
If you have a "follower"
You can receive comment notifications on real-time travel routes and major sections.
If my analysis is helpful,
Please would like one booster button at the bottom.
Bitcoin 30-minute chart.
There will be an indicator announcement later at 9:30.
I also saw the possibility of an upward wave on Nasdaq.
In the case of tether dominance, the shape of the center line is becoming flat.
When 4 + 6 + 12 MACD dead cross appears
Because this is a place where a crash can occur.
I bet on that part.
*Red finger movement path
Long position strategy
1. Chase buy at $57938 / Stop loss when the purple support line is broken
2. $61213.5 1st target -> Good 2nd target
If it falls from its current position, it will be a plummet.
On the other hand, if it goes up, you may miss the entry position.
I set a short stop loss and proceeded aggressively.
In the case of the purple and green parallel lines currently drawn,
Because it is a plot of an upward trend.
Because there is a high possibility that it will not play a supporting role.
When taking a stop loss, you should carefully look at the shape of the Bollinger Band support line by time zone.
If today's strategy fails, it can be a double-edged sword.
Section 2 at the bottom, unlike yesterday, may be a downward trend line.
Please just use it as a reference.
I think it would be good to think of it as a safe sideways section up to section 1.
My analysis up to this point is
Please simply refer to it and use it.
I hope you operate safely with principled trading and stop loss required.
thank you

BTC (we will search sell entry)(MID TERM)(03-05-2024)Go through the analysis carefully, and do trade accordingly.
Anup 'BIAS for Mid term (03-05-2024)(MID TERM)
Current price- 59500
"if Price stay below 61500 then next target is 58500, 56000 and above that 64500.
-POSSIBILITY-1
Wait (as geopolitical situation are worsening )
-POSSIBILITY-2
Wait (as geopolitical situation are worsening)
Best of luck
Never risk 2% of principal to follow any position.
Support us by liking and sharing the post.

BTC/USDT we have 3 plans.Hello guys, today I have 3 plans in BTCUSDT
P1: I am looking for a long opportunity on 61k to 62k based on the price action and buyer's momentum and also, I want the CVD and DELTA with bullish candles. I am also considering the lower timeframe like 1HR and 15MIN candles.
P2: I am looking for a long opportunity in a strong support area of 59700 and 60100 area, here I want the CVD and DELTA with bullish candles. I am also considering the lower timeframe like 1HR and 15MIN candles.
P3: if the support of the 60k region was broken then I want to see the seller's momentum based on price action and the situation. I looking for a short entry.
NOTE: I am not a professional and also this is not financial advice just testing my skills always DYOR
