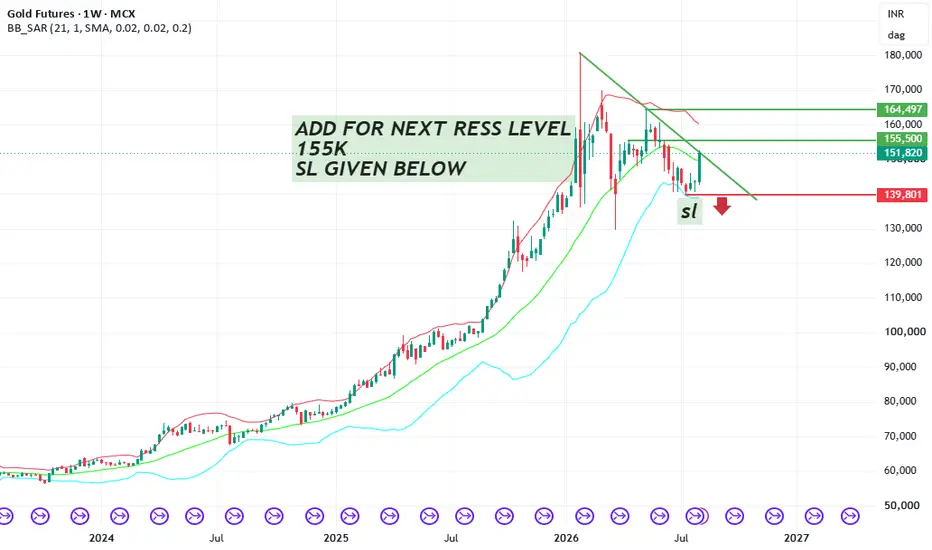
Gold: Decade Cycle Projection (2026–2032)📊 Technical Analysis
1. Macro Trend & Structural Consolidation
On the weekly timeframe, MCX Gold is digesting a powerful multi-year impulsive expansion phase that set record highs.
Rather than experiencing a sharp structural breakdown, price action is currently carving out a high-probability symmetrical triangle / wedge continuation pattern spanning multiple years.
Horizontal Resistance Ceiling: Capping the immediate upside is a major structural resistance zone near the ₹165,000 – ₹170,000
In-depth trading ideas
RSI : The Best way to use in TradingTHE BEST USE OF RSI IN TRADING
RSI is one of the most widely used indicators in technical analysis.
But many traders use it only for:
RSI above 70 = Sell
RSI below 30 = Buy
That is where the real understanding of RSI often stops.
Let's understand how RSI can be used more effectively.
1. THE BIGGEST RSI MYTH — OVERBOUGHT & OVERSOLD
RSI above 70 does NOT automatically mean price must fall.
RSI below 30 does NOT automatically mean price must rise.
In a strong uptrend, RSI can re
Institution Option Trading Part-1PCR means Put Call Ratio
It tells us how many Put options and Call options people are buying or trading.
Why it matters for institution trading
Big players mostly use options. So PCR helps us understand what big money may be thinking.
If PCR is high
More puts than calls.
Means traders are scared or taking protection.
Sometimes big players expect weakness.
If PCR is low
More calls than puts.
Means confidence in upside.
Sometimes market is bullish.
gold 🟡 Gold — Bearish Setup
Gold has broken below the ₹149,300–₹149,400 support zone on the daily chart, weakening the short-term structure.
📉 A sustained move below ₹149,300 could open the way toward the next major support around ₹140,000.
Bearish below: ₹149,300
🎯 Downside zone: ₹140,000
⚠️ Invalidation: Reclaiming ₹149,300–₹150,000 and holding above it.
The key now is whether the breakdown sustains or price quickly reclaims the support zone.
Breakdown confirmation matters — avoid assuming the
Trading AnalysisOption Chain Analysis: Decoding Open Interest (OI) to find where the "Big Players" are positioned.
FII/DII Data: Understanding institutional activity and its impact on market direction.
Intraday Strategies: Scalping and swing setups using Price Action and key EMAs.
Global Market Cues: How GIFT Nifty and US Markets might influence our opening.
GOLD MCX | ₹154,500 Breakout — Can Momentum Extend?Gold MCX is showing a meaningful 4-hour recovery attempt after breaking above the falling trendline that controlled price through most of September.
Price is now around ₹154,000–154,500, which makes this the first important breakout-confirmation area rather than a place to assume the move is already complete.
Current stage: 4H Breakout Confirmation
Primary timeframe: 4 Hour
Intended horizon: Short-term swing / trading
Why this chart matters now
The recent 4H structure has improved:
the fall
Institutional Trading MasterclassCore Structure of Institutional Option Trading
Institutions focus on 4 pillars:
A. Direction
Will market go up, down, sideways?
B. Volatility
Will movement increase or decrease?
C. Time Decay
How much premium melts daily?
D. Risk Exposure
How much capital at risk?
Rules to Become Consistent
Never trade without plan
Never increase size emotionally
How To Understad Option?Institutional Option Trading (7 Key Points):
Smart Money Activity – Institutions like banks, hedge funds, and FIIs trade options with large capital, creating strong directional moves in the market.
Option Chain Analysis – They focus on OI buildup, unwinding, and PCR to identify accumulation/distribution zones.
Liquidity Zones – Institutions trade where liquidity is high (ITM/ATM strikes), ensuring easy entry and exit without slippage.
Hedging Strategies – Use advanced strategies like spreads
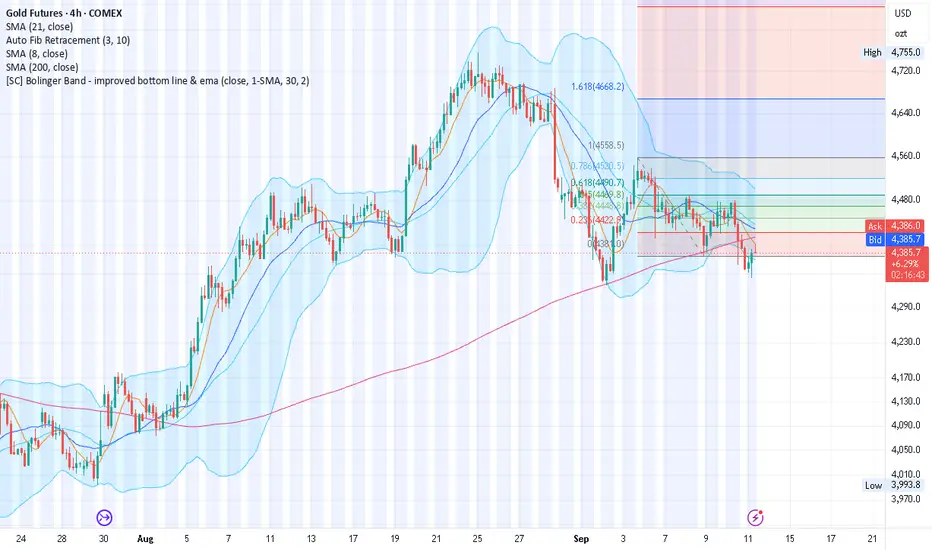
WaveTalks Gold - Alternate Scenario : Ending Diagonal Below 4450Comex Gold is currently forming a C-Wave Ending Diagonal, presenting a highly lucrative yet highly emotional trading setup. While the current price action appears messy and volatile, this specific pattern offers clear diagnostic boundaries. If the structure holds, a final 5th-wave decline will open targeted downside targets before setting up a major reversal toward the pattern's origin point at $4,558 and potentially $4,755.
The Psychology of the Trade: Emotions vs. Patience
Emotions are t
Oversold MarketsWhat is overbought?
When the market goes up too much, too fast — like it got overexcited. RSI crosses above 70. This means most people who wanted to buy have already bought. Not many buyers left. So the market will likely slow down or fall a bit.
What you do: don't buy now. If you're already in profit, book some of it. Keep your stop loss tight.
What is oversold?
When the market falls too much, too fast — like everyone panicked and sold everything. RSI drops below 30. Most of the panic sellin
WaveTalks -COMEX GOLD: The Sharp Fall 4479 to 4355's- What Next?Comex Gold
1:42 am / 11th Sep 2026 (Indian Standard Time)
Last @ $4364
"Is Gold teasing before a deep dive? Well, only the next few candles will tell. Did you get the red candles? Like there was no floor... This is exactly what unfolded and is called a Thrust (Deep Dive)."The quote above highlights the real-time breakdown flagged earlier on the WaveTalks social media channels at 11:29 am on 10th September 2026.
Already completed 1st Bigger Impulse
$3963 to $4755 & Fall from $4755 to
Intraday AnalysisOption Chain Analysis: Decoding Open Interest (OI) to find where the "Big Players" are positioned.
FII/DII Data: Understanding institutional activity and its impact on market direction.
Intraday Strategies: Scalping and swing setups using Price Action and key EMAs.
Global Market Cues: How GIFT Nifty and US Markets might influence our opening.
THREE BLACK CROWWSNifty is currently forming a pattern that strongly resembles Three Black Crows, though the final candle is still actively developing.
If it not take immediate support then it will causious...
If the 23,600 level breaks, we might see a period of sideways to bearish movement, based on my observations.
So not take unnecessary long calls.
Institutional Trading MasterclassCore Structure of Institutional Option Trading
Institutions focus on 4 pillars:
A. Direction
Will market go up, down, sideways?
B. Volatility
Will movement increase or decrease?
C. Time Decay
How much premium melts daily?
D. Risk Exposure
How much capital at risk?
Rules to Become Consistent
Never trade without plan