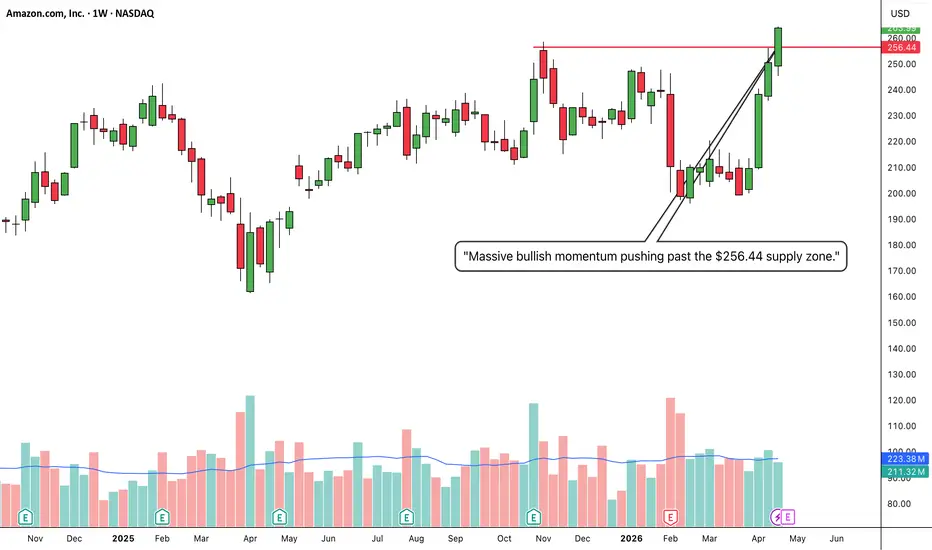
AMZN: Impulsive Breakout Above Major Swing ResistanceThe Setup (Bias): I am taking a LONG bias on Amazon.com, Inc. (AMZN) on the weekly timeframe.
The "Why" (Technical Reasons): 1. Major Resistance Breakout: The price has powerfully broken above the recent structural swing high at $256.44.
2. Aggressive Bullish Momentum: After a sharp pullback, buyers stepped in with immense force. We are now seeing consecutive, massive green weekly candles that have completely erased the previous sell-off. This V-shaped recovery and subsequent breakout show that
In-depth trading ideas
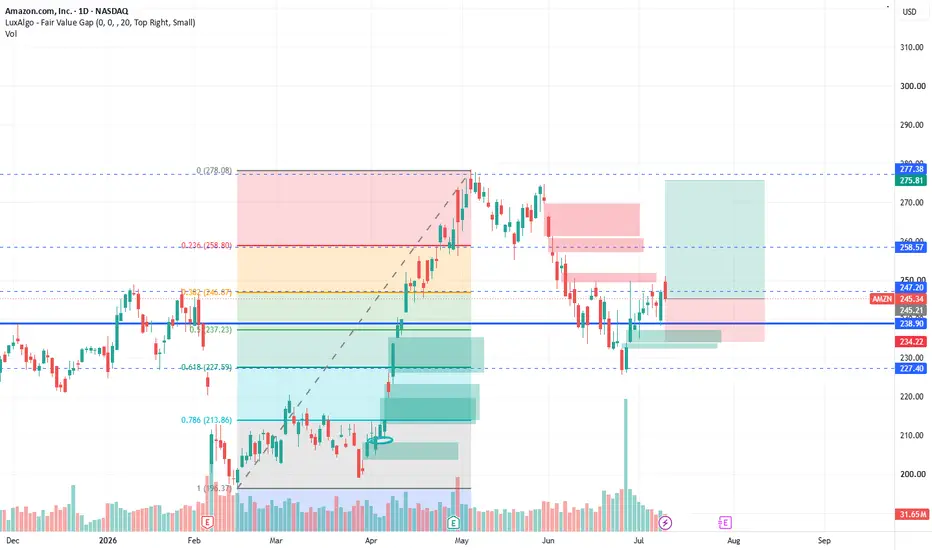
Bullish Setup: Support, Fibonacci Confluence and Fair Value GapPrice has retraced into a major support zone around $237–$239, where buyers previously stepped in. This area also aligns with the 0.50–0.618 Fibonacci retracement zone, creating strong technical confluence.
During the retracement, price entered a bullish fair value gap, suggesting that the imbalance could act as a demand zone. After briefly trading below the support area, price recovered and began forming higher lows, indicating that selling pressure may be weakening.
The bullish scenario rema
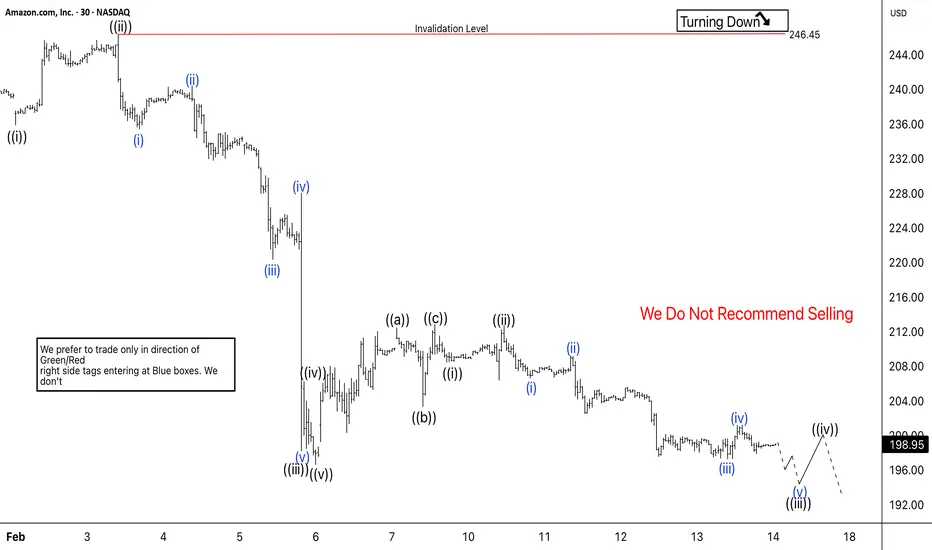
Elliott Wave Analysis: AMZN Resumes Downtrend as Wave 5 Decline Amazon completes wave 4 bounce and turns lower toward Fibonacci downside targets.
Amazon (AMZN) has resumed its decline after completing a corrective bounce. The stock formed a three-swing recovery in red wave 4 following the earlier three-wave drop from the peak at 247.77. The bounce remained corrective and failed to change the bearish trend. After finishing wave 4, price turned lower again and started a new impulsive move. The decline is now progressing in wave 5 and is developing as a clear
Fiscal Policy Risk and Its Impact on Debt Markets1. Understanding Fiscal Policy Risk
Fiscal policy risk refers to the uncertainty that arises from government budgetary actions, particularly when those actions impact the broader economy and financial markets. It is associated with the possibility that fiscal decisions—such as changes in tax rates, spending programs, or public debt issuance—may have unintended consequences on economic stability, inflation, and investor confidence.
Key elements of fiscal policy risk include:
Budget Deficits an
Part 1 Intraday Trading Master Class How Option Pricing Works
Option prices (premiums) depend on multiple factors:
1. Underlying Price Movement
Biggest factor.
CE rises when market rises.
PE rises when market falls.
2. Time to Expiry (Theta)
As expiry approaches, options lose value due to time decay.
Buyers suffer from theta.
Sellers benefit from theta.
3. Volatility (Vega)
Higher volatility = higher premiums.
4. Demand–Supply and Market Sentiment
Aggressive buying or selling changes premium rapidly.
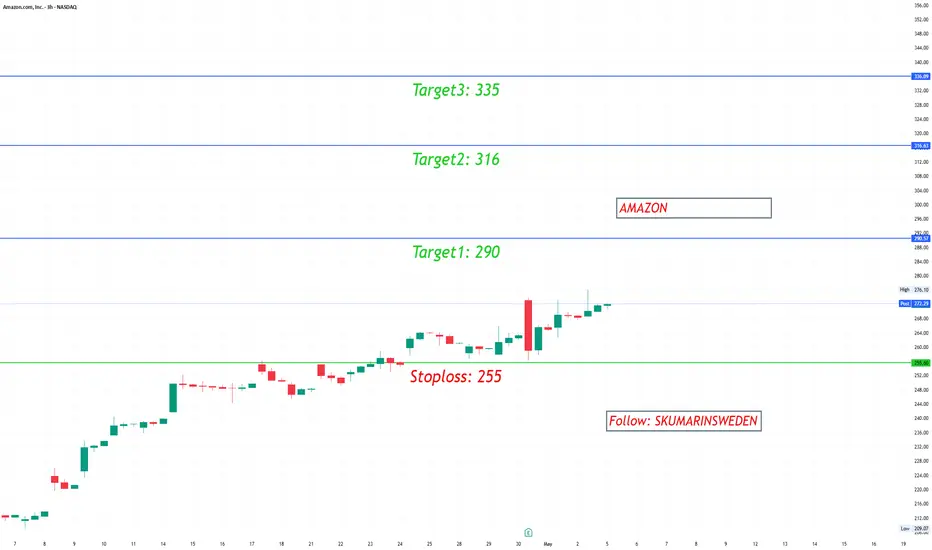
As U.S. stocks head into the fourth quarter, investors are once (AMZN) seasonal advantages and structural market factors. Multiple bullish signals are currently aligning in favor of AMZN.
Santa Claus Rally Support
Historical data shows that from late November through early January, U.S. equities often experience what is known as the “Santa Claus Rally.” For Amazon, this period of explosive consumer demand is a dual catalyst for both revenue and share price.
Peak e-commerce quarter: Black Friday, Thanksgiving, and Christmas shopping consistently deliver Ama
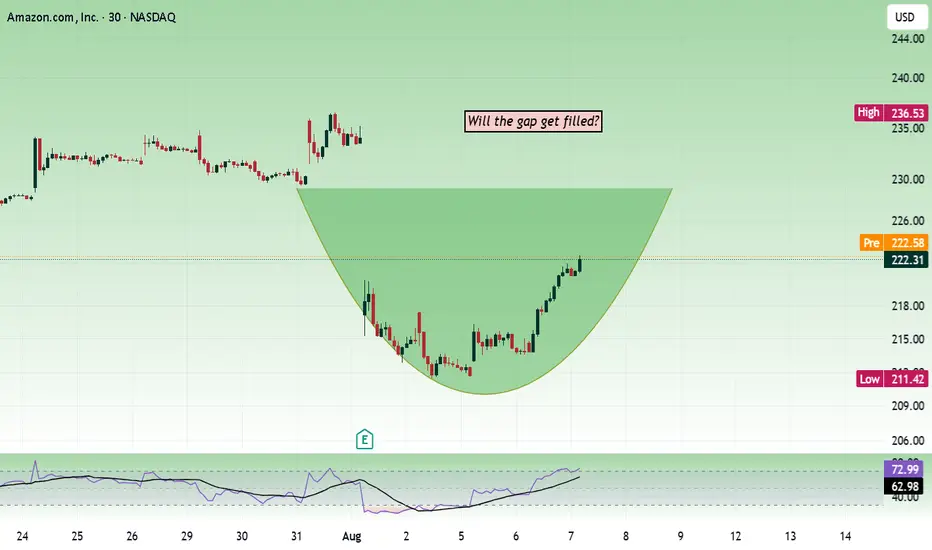
Amazon - Will the gap get filled?Price is sustaining an important level of 220. It can make the price move towards the 230 zone.
Below 220, the price will start to lose bullish strength. The next support is at 200–202, with 220 being a strong support.
Buy above 221.5 with the stop loss of 220 for the targets 223, 224.5, 227, and 228.5.
Always do your analysis before taking any trade.
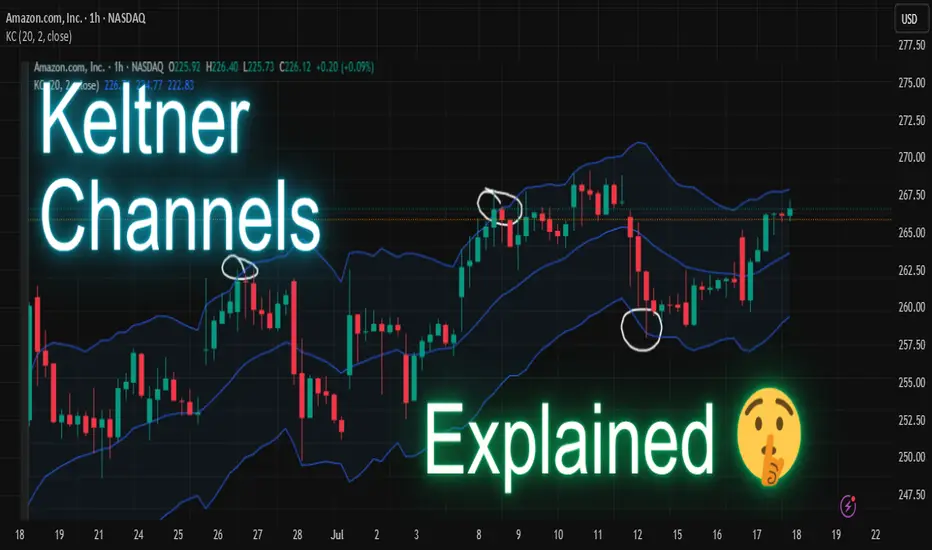
The Keltner Channels Indicator ExplainedDive into the world of Keltner Channels—a powerful volatility-based indicator used by traders to spot trends, reversals, and breakout opportunities! Let’s see how you can use it to enhance your trading decisions. 🚀
What Are Keltner Channels? 🤔
Keltner Channels consist of three lines plotted around a moving average:
- The middle line: An exponential moving average (EMA), typically 20 periods.
- The upper and lower bands: Set above and below the EMA, usually by a multiple of the Average True Ra
Amazon on shot high selling pressureThe chart depicts the weekly price movement of Amazon (AMZN) stock from 2022 to mid-2025, with a focus on a recent period around June 2025. Here’s an analysis based on the provided chart:
Historical Trend: The stock experienced a significant upward trend from 2022 to mid-2024, showing consistent growth with periodic corrections. This suggests strong bullish momentum over the long term.
Major Support Level: A key support zone is identified around the $916.18 to $919.18 range (highlighted in red
AMZN – Long Spot Trade Setup at Key SupportAmazon NASDAQ:AMZN is currently retracing into a major support level near $195, offering a solid long opportunity as broader market momentum holds up. This level has previously acted as a strong base, and price could now be positioning for a bullish continuation.
🔹 Entry Zone:
Around $195 (major support area)
🎯 Take Profit Targets:
🥇 $213 – $220 (previous resistance, aligns with local Fibonacci extension levels)
🥈 $234 – $242 (macro target zone if the broader market continues to rally)
🛑 S
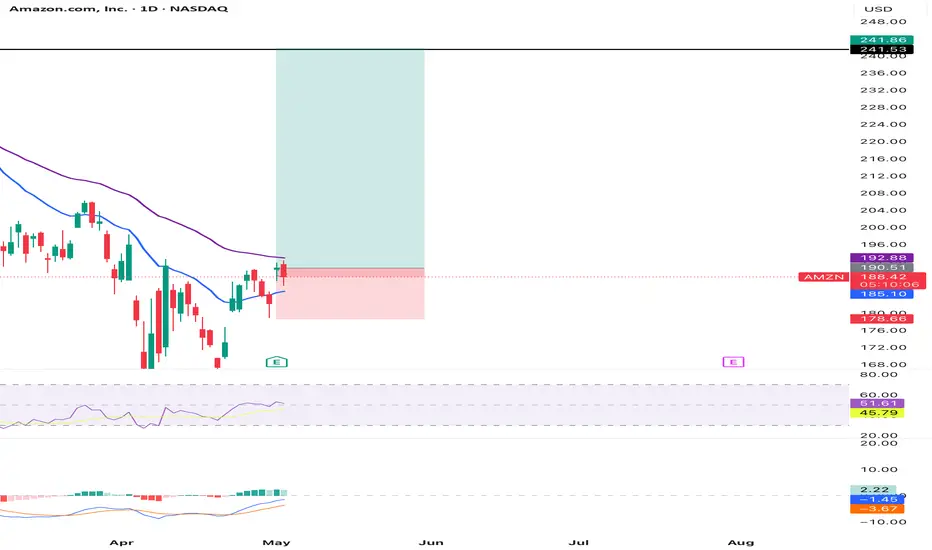
Amazon (AMZN) Swing Trade Analysis## Amazon (AMZN) Swing Trade Analysis
**Timeframe: 4H Chart (as per your screenshot, May 2, 2025)**
---
### **Technical Overview**
#### **1. Price Structure**
- **Trend:** The chart shows a recent reversal from a downtrend, with price making higher lows and attempting to break resistance around $190–$192.
- **Support:** Strong support is visible near $178.66 and a major support at $162.49.
- **Resistance/Target:** The green zone targets the $241.53–$241.86 area, which is a previous supply/r
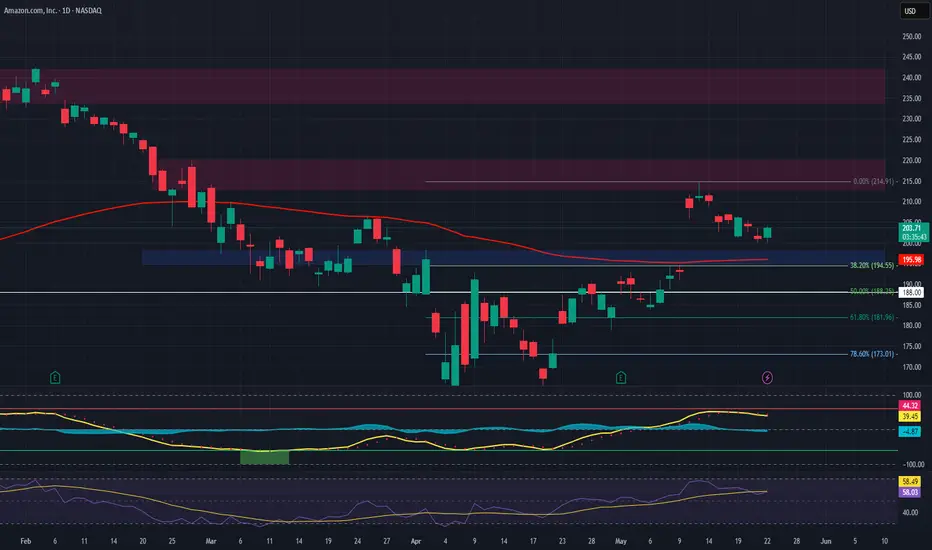
$AMZN Forming a Bullish Hammer Candle and Oversold on the DailyNASDAQ:AMZN forming a Bullish Hammer candle on the Daily and oversold right. It's right under 100 SMA (white line) let's see if we can get a bounce here and break back above. I was happy to see it finish the day green after being down 2% on the day.
$AMZN is oversold on the daily The past few times NASDAQ:AMZN has been oversold on the daily have proven to be great entry points. We are close to a possible support line and could go even a little further to touch the 100 SMA (white line). I am starting to accumulate NASDAQ:AMZN shares as well as April 17 220 calls @ $7.95
If it does drop further I would look to add at the 100 SMA. However, I do think we could see a bounce soon. It's also around a 30 forward PE at these levels.