TESLA Bullish Wave CyclesHi everyone
Welcome to intelligent investor, we provide market insights by synchronising and combining all the price action waves from different time frames and gives you single trend.
If you see different keyword in charts, here is the meaning and an explaining video will be made in some time how
Next report date
—
Report period
—
EPS estimate
—
Revenue estimate
—
1.64 USD
7.13 B USD
97.69 B USD
2.81 B
About Tesla, Inc.
Sector
Industry
CEO
Elon Reeve Musk
Website
Headquarters
Austin
Founded
2003
ISIN
US88160R1014
FIGI
BBG000N9MNX3
Tesla, Inc. engages in the design, development, manufacture, and sale of electric vehicles and energy generation and storage systems. The company operates through Automotive and Energy Generation and Storage. The Automotive segment includes the design, development, manufacture, sale, and lease of electric vehicles as well as sales of automotive regulatory credits. The Energy Generation and Storage segment is involved in the design, manufacture, installation, sale, and lease of stationary energy storage products and solar energy systems, and sale of solar energy systems incentives. The company was founded by Jeffrey B. Straubel, Elon Reeve Musk, Martin Eberhard, and Marc Tarpenning on July 1, 2003 and is headquartered in Austin, TX.
Related stocks
Part 1 Ride The Big Moves What is an Option?
An option is a financial derivative whose value is derived from an underlying asset such as a stock, index, or commodity. Options come in two primary forms:
Call Option: It gives the holder the right to buy the underlying asset at a predetermined price (known as the strike price

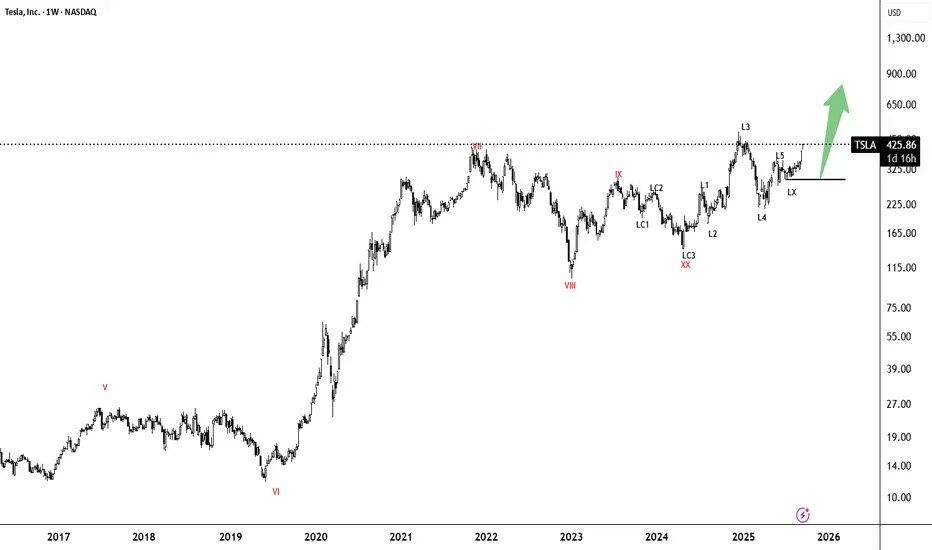
Tesla’s Technical Outlook and Future Possibilities Tesla’s Technical Outlook and Future Possibilities
Tesla’s current price action reflects a phase of consolidation after a strong rally, where traders are carefully observing how the stock reacts near crucial levels.
The stock’s position around $439 indicates indecision between bu

Part 12 Trading Masster ClassOption Trading in India
In India, options are traded on exchanges like the NSE (National Stock Exchange) and BSE (Bombay Stock Exchange). The most active instruments include NIFTY, BANKNIFTY, and FINNIFTY indices, as well as popular stocks like Reliance, TCS, and HDFC Bank.
Indian traders have acc

Part 2 Intraday Master ClassKey Concepts and Terminology
Before understanding how option trading works, it’s important to grasp some basic terms:
Call Option: Gives the holder the right to buy an asset at a specific price (called the strike price) before a set date.
Put Option: Gives the holder the right to sell an asset at

Part 2 Master Candle Stick PatternWhy Trade Options?
Options can be used for different purposes:
Speculation – Traders predict whether prices will rise or fall and buy options to profit from that movement.
Hedging – Investors use options to protect their portfolios from potential losses, like insurance for their investments.
Inc

Part 1 Ride The Big Moves American vs. European Options
Options can be American-style or European-style. American options can be exercised any time before expiry, while European options can be exercised only on the expiry date. In India, stock options are American, while index options are European.
In-the-Money, At-the-Mon

3 Common Trading Mistakes Traders Should AvoidTraders of all levels, from beginners to experienced professionals, can fall prey to psychological mistakes that can lead to poor trading decisions and ultimately, losses. Understanding and avoiding these common mistakes is crucial for developing a sound trading strategy and achieving consistent suc

Part 12 Trading Master Class With Experts Common Option Trading Strategies
Options can be combined in different ways to create strategies with defined risk and reward profiles.
Some popular strategies include:
Covered Call – Holding a stock and selling a call option on it (income strategy).
Protective Put – Holding a stock and buying a p

Part 3 Learn Institutional Trading Introduction to Option Trading
Option trading is one of the most powerful tools in the financial markets. It allows traders and investors to speculate on price movements, hedge risks, and generate income in various market conditions. Unlike traditional stock trading—where you buy or sell shares dir

See all ideas
Summarizing what the indicators are suggesting.
Neutral
SellBuy
Strong sellStrong buy
Strong sellSellNeutralBuyStrong buy
Neutral
SellBuy
Strong sellStrong buy
Strong sellSellNeutralBuyStrong buy
Neutral
SellBuy
Strong sellStrong buy
Strong sellSellNeutralBuyStrong buy
An aggregate view of professional's ratings.
Neutral
SellBuy
Strong sellStrong buy
Strong sellSellNeutralBuyStrong buy
Neutral
SellBuy
Strong sellStrong buy
Strong sellSellNeutralBuyStrong buy
Neutral
SellBuy
Strong sellStrong buy
Strong sellSellNeutralBuyStrong buy
Displays a symbol's price movements over previous years to identify recurring trends.
TSLA4317805
Tesla Energy Operations, Inc. 5.45% 17-DEC-2030Yield to maturity
10.02%
Maturity date
Dec 17, 2030
TSLA4296328
Tesla Energy Operations, Inc. 5.45% 16-OCT-2030Yield to maturity
9.28%
Maturity date
Oct 16, 2030
TSLA4290558
Tesla Energy Operations, Inc. 5.45% 01-OCT-2030Yield to maturity
8.99%
Maturity date
Oct 1, 2030
TSLA4247202
Tesla Energy Operations, Inc. 5.45% 21-MAY-2030Yield to maturity
8.69%
Maturity date
May 21, 2030
TSLA4324758
Tesla Energy Operations, Inc. 4.7% 14-JAN-2026Yield to maturity
8.00%
Maturity date
Jan 14, 2026
TSLA4286421
Tesla Energy Operations, Inc. 5.45% 17-SEP-2030Yield to maturity
7.89%
Maturity date
Sep 17, 2030
TSLA4231716
Tesla Energy Operations, Inc. 5.45% 23-APR-2030Yield to maturity
7.60%
Maturity date
Apr 23, 2030
TSLA4250220
Tesla Energy Operations, Inc. 5.45% 29-MAY-2030Yield to maturity
7.40%
Maturity date
May 29, 2030
TSLA4313161
Tesla Energy Operations, Inc. 5.45% 03-DEC-2030Yield to maturity
7.15%
Maturity date
Dec 3, 2030
TSLA4260133
Tesla Energy Operations, Inc. 5.45% 25-JUN-2030Yield to maturity
7.02%
Maturity date
Jun 25, 2030
TSLA4224815
Tesla Energy Operations, Inc. 5.45% 26-MAR-2030Yield to maturity
6.78%
Maturity date
Mar 26, 2030
See all TSLA bonds
Curated watchlists where TSLA is featured.


Frequently Asked Questions
The current price of TSLA is 401.83 USD — it has decreased by −7.41% in the past 24 hours. Watch Tesla, Inc. stock price performance more closely on the chart.
Depending on the exchange, the stock ticker may vary. For instance, on NASDAQ exchange Tesla, Inc. stocks are traded under the ticker TSLA.
TSLA stock has fallen by −13.70% compared to the previous week, the month change is a −6.58% fall, over the last year Tesla, Inc. has showed a 19.65% increase.
We've gathered analysts' opinions on Tesla, Inc. future price: according to them, TSLA price has a max estimate of 600.00 USD and a min estimate of 120.00 USD. Watch TSLA chart and read a more detailed Tesla, Inc. stock forecast: see what analysts think of Tesla, Inc. and suggest that you do with its stocks.
TSLA reached its all-time high on Dec 18, 2024 with the price of 488.54 USD, and its all-time low was 1.00 USD and was reached on Jul 7, 2010. View more price dynamics on TSLA chart.
See other stocks reaching their highest and lowest prices.
See other stocks reaching their highest and lowest prices.
TSLA stock is 8.64% volatile and has beta coefficient of 1.61. Track Tesla, Inc. stock price on the chart and check out the list of the most volatile stocks — is Tesla, Inc. there?
Today Tesla, Inc. has the market capitalization of 1.43 T, it has decreased by −4.86% over the last week.
Yes, you can track Tesla, Inc. financials in yearly and quarterly reports right on TradingView.
Tesla, Inc. is going to release the next earnings report on Jan 28, 2026. Keep track of upcoming events with our Earnings Calendar.
TSLA earnings for the last quarter are 0.50 USD per share, whereas the estimation was 0.56 USD resulting in a −10.42% surprise. The estimated earnings for the next quarter are 0.44 USD per share. See more details about Tesla, Inc. earnings.
Tesla, Inc. revenue for the last quarter amounts to 28.09 B USD, despite the estimated figure of 26.54 B USD. In the next quarter, revenue is expected to reach 25.33 B USD.
TSLA net income for the last quarter is 1.37 B USD, while the quarter before that showed 1.17 B USD of net income which accounts for 17.15% change. Track more Tesla, Inc. financial stats to get the full picture.
No, TSLA doesn't pay any dividends to its shareholders. But don't worry, we've prepared a list of high-dividend stocks for you.
As of Nov 13, 2025, the company has 125.67 K employees. See our rating of the largest employees — is Tesla, Inc. on this list?
EBITDA measures a company's operating performance, its growth signifies an improvement in the efficiency of a company. Tesla, Inc. EBITDA is 10.87 B USD, and current EBITDA margin is 13.44%. See more stats in Tesla, Inc. financial statements.
Like other stocks, TSLA shares are traded on stock exchanges, e.g. Nasdaq, Nyse, Euronext, and the easiest way to buy them is through an online stock broker. To do this, you need to open an account and follow a broker's procedures, then start trading. You can trade Tesla, Inc. stock right from TradingView charts — choose your broker and connect to your account.
Investing in stocks requires a comprehensive research: you should carefully study all the available data, e.g. company's financials, related news, and its technical analysis. So Tesla, Inc. technincal analysis shows the sell today, and its 1 week rating is buy. Since market conditions are prone to changes, it's worth looking a bit further into the future — according to the 1 month rating Tesla, Inc. stock shows the buy signal. See more of Tesla, Inc. technicals for a more comprehensive analysis.
If you're still not sure, try looking for inspiration in our curated watchlists.
If you're still not sure, try looking for inspiration in our curated watchlists.