GAIL trade ideas

GAIL Long Short TermGAIL Chart looks good for upside in the short term. Fundamental reason is forming a hammer on daily and weekly candlestick charts and holding up well in the falling market.

Any failure to move above 85 will induce more correction The stock is into dominant trend down and this pullback seems to be corrective. Now the stock has faced resistance and the momentum indicator is also taking a halt at the bearish extreme. Any failure to move above 85 will induce more correction and the stock may further correct to 65 & 44 levels. However a move above 85 may push the stock further towards 103 & 125 levels.


GAILGail India may take support near 116-117 if market supports. As per the Volume high side is from sell but let see what market do
If take support as per level then may hit 121 as there is GAP down and this GAP will work as resistance till it break

We are Going to Honolulu I wonder weather the people call them self as Analyst or research person have any kind of knowledge with them at all
They only try to put information in random manner with out even having an complete sense of how things work in Stock market
and Mass people ( so call retail traders as sheep ) follow them without even knowing what is the performance
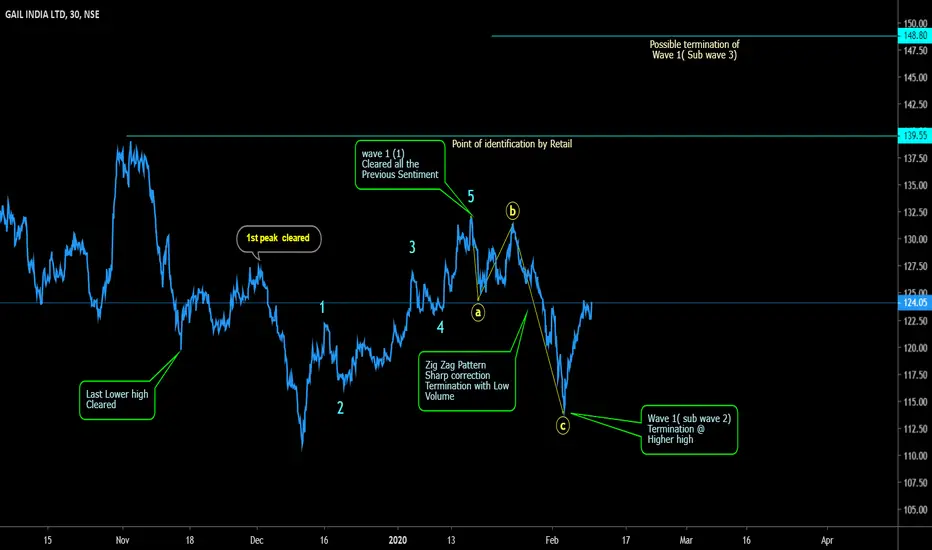
The scrip is in well position of moving up one more impulse leg
The price from inception have made an 1st impulse leg up and then it entered in correction ( Function of time ) and completed its all three corrective moves
which are labeled as A B C , where as Wave A & C represents 5 wave move and Wave B represents 3 wave move
Wave C of last move down fell short by price move but met the time factor correction by days / week , and lastly Momentum have given the confirmation of its end of wave C
One can look for position them self as long term position and look to book near the forecast
Patience is key for better earnings
Good luck


If you Understand this simple logic ( You are the winner ) Price movements are very informative in its nature but one has to identify them and their intentions with Guided methods
By saying Guided methods means , they must perform on real time basis and also the guidelines should be supported by other indicative information
Now here i am expressing two system to be followed
01) A Method of identifying the trend along with its Rules & Guidelines
02) Indicative information is nothing but a price and tools of charting ( Indicators )
both have to meet the a proper clear information of all the parts of trend ,
Trend following , Trend pause , Trend continuation , Trend termination ,
Now i have made small efforts in the charts by placing an Labels , and detailing it , I usually dont put any labels in my chart ( due to continues practice & Expertise )
My message to you all is , Follow a method in the stock market that suites you ,
Follow a system that suites you
Follow a procedure of entry & Exits that suites you
I am Following an Wave theory , that is researched by R N Elliott , and reviewed/ Accepted by many historian Analyst in stock market
Please do not try to teach me , Please do not try to comment un-necessary in my charts because you know something big then me ,
if you know it please enjoy your self i dont need any thing from any one
Those who are learning try to learn in simplest manner , do not complicate your methods
Good luck

Short GAILBollinger bands expanding volatility and
looking weak on charts
Fib levels are breached
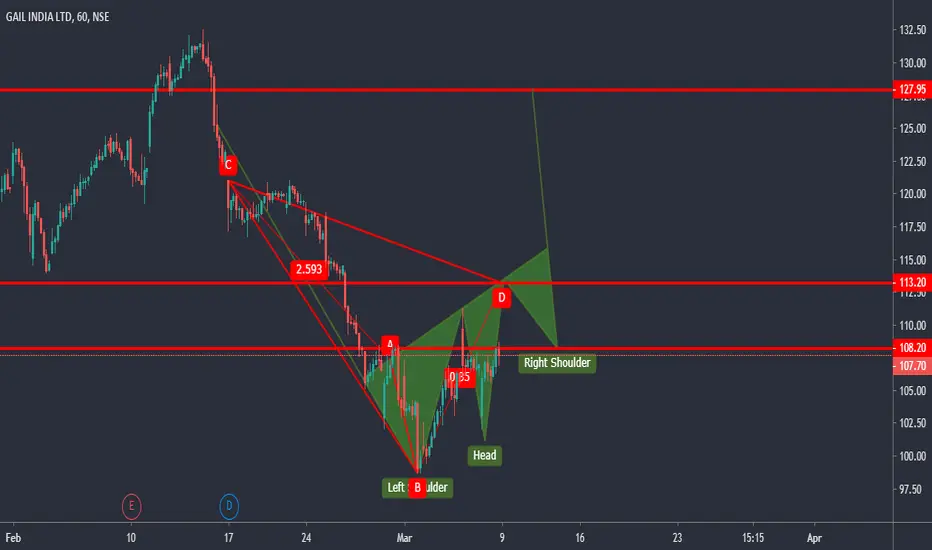
heading to target of 110

#GAIL - perspective Evening Star on Yearly Charts & now resting at / testing the Ascending Triangle Breakout Level.


