WIT trade ideas

WIPRO - UP FLAG ON WEEKLY CHARTWipro Ltd. is in an uptrend since March 2020. The counter got into a consolidation of 3 months since January 2021. The consolidation has a slightly descending slope making it like a channel. The consolidation got an upward breakout on a weekly candle for the week starting on 12th April and ending on 16th April. This weekly candle closed at Rs.469.20. I anticipate the first price target of Rs.500 and the second price target of Rs.600. I suggest the stop loss at the price level of Rs.457 for the first for weekly candles. Thereafter the profit booking/ exit decision should be based on a downward crossover of 26 EMA by 5 EMA.
NOTE: This idea is an attempt to predict future price movement. Investment decision, based on this idea, should be at the sole risk of the investor.

Breakout in WiproAfter a long consolidation for about 2 months, Wipro has finally given a breakout today with huge volumes. Looks very bullish after positive quarterly results. Perfect for swing trading if market supports.


Wipro gave brekoutNote
1) today is weeklysing so this breakout is important
2)USD INR is very bullish has gave a decent move in last few trading session
3) Quaterly resuls will add further volatility in the stck
4) The breakout is very decent
See my last idea where i shown the minor trend line.


READY FOR RACEBest Opportunity For Swing Traders💕
Level Mentioned On Chart.
After Consolidation Stock Is Ready For Go
Follow For More Updates @prasanna09
📌Key Highlights:
🔺BO On Weekly Time Frame
🔺Pole And Flag
🔺Vol. BO
🔺Anual Results

Wipro for a target of 460+Wipro has broken out and has retraced to the previous resistance level. This level is acting as support and has been respected for the last two trading sessions. if this continues, we will see Wipro reaching 460+ in the near future. If the resitance of 465 as well is broken, Wipro can see 500 very soon.


WIPRO price analysis on 15 mins chartWipro is sustaining above 200ema and it has formed not one but two trend reversal patterns called INVERSE HEAD N SHOULDER , the other one called CUP N HANDLE. Both of these pattern are trend reversal price action pattern. Targets mentioned on charts. Trade at your own risk. Trade safe.

Wipro - Head and ShoulderPrice forming head and shoulder pattern in lower time frame, this analysis is valid for intraday trades which I usually dont post here.
These kind of lower time frame analysis is used for my intraday trading with strategies to enter and exit on the same day.


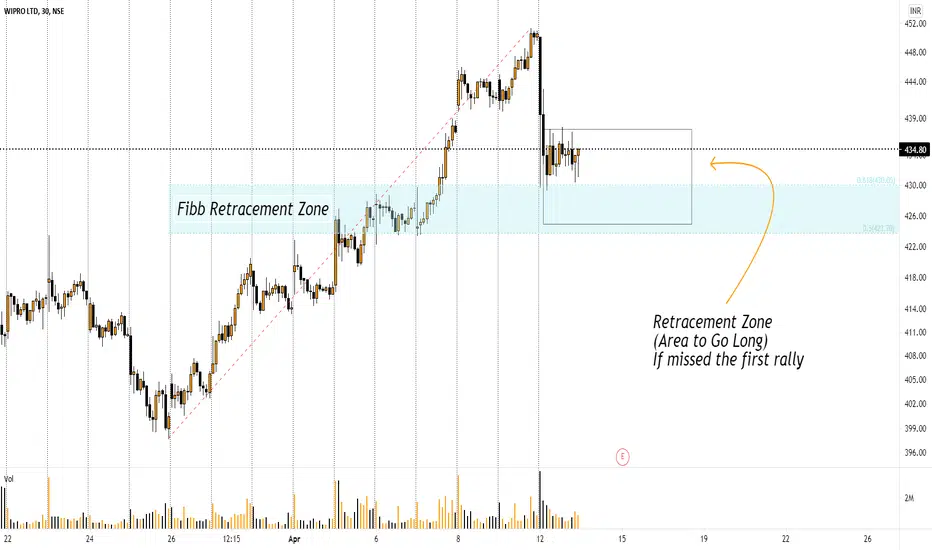
WIPRO Go LongThe only few sectors which are going to stay unaffected or say least affected from this Covid Lockdown will be IT, PHARMA & FMCG
If missed the first rally then opportunity to long in Wipro If sustains at this retracement zone
View negated if closed below 420 with volumes on 30 mins TF

Wipro Falling Trendline BreakoutWipro is on a HH - HL mode in weekly . But was in a LL - LH mode on Daily timeframe. Has now closed above the falling trendline. Looks good to touch its ATH again


Wipro - Flag patternWipro under consolidation. With a bullish breakout, we can confirm and ride the trend. Happy trading :)

Wipro Chart AnalysisFalling wedge breakout
cmp 450
Bullish above 467
Support 431
Target1 - 501
Target2 - 522
View - Bullish
