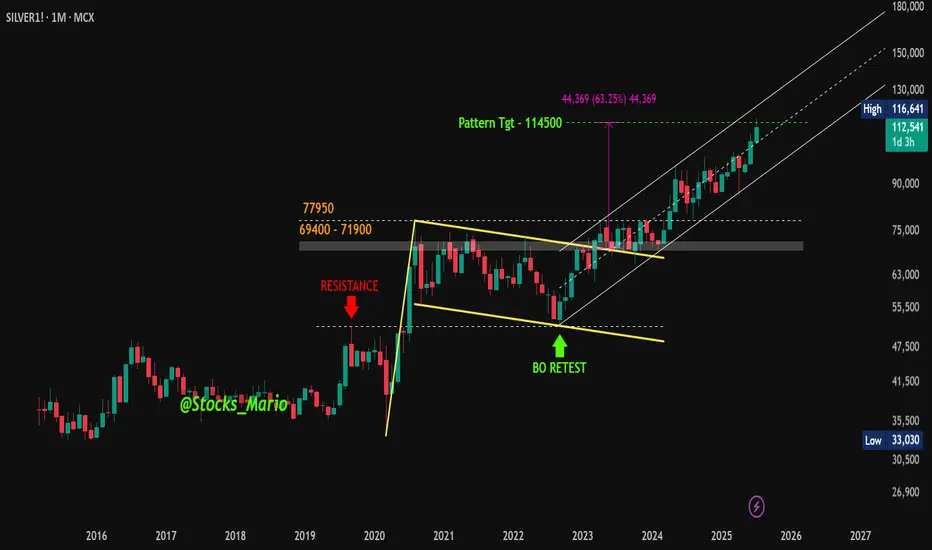
MCX Silver Powers Through Pattern Targets – Momentum Continues#Update | #MCXSilver
On Dec 27, 2022 , we identified a bullish flag pattern when Silver was trading around 69,845 . A follow-up update was shared on Apr 4, 2025 , with prices near 87,878 .
Since then, MCX Silver moved up and touched a high of 1,16,641 on Jul 14, 2025 , meeting the projected zone of the earlier chart pattern — a move of 67% from the initial post and +32% from the April update.
At present, Silver is trading within an ascending channel on the long-term charts — a structure often associated with a sustained trend.
Stay tuned — this could just be the beginning!
⚠️ This is a technical observation shared for educational purposes only. Not a buy/sell recommendation. Please consult your financial advisor before making any trading decisions.
#Silver | #MCX | #TechnicalAnalysis | #PriceAction | #Commodities | #TrendAnalysis | #ChartPatterns
Silver Futures
Market insights
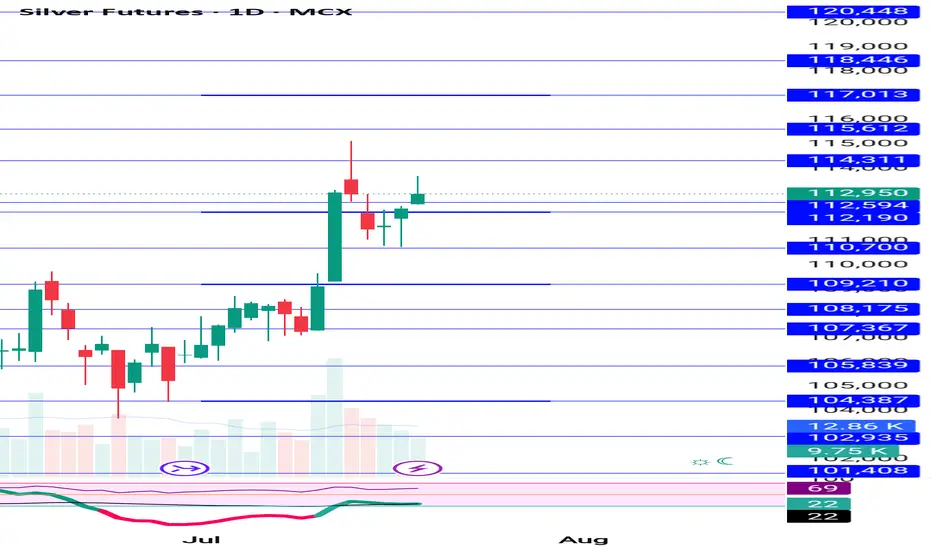
Silver last week we booked 4500 points on buy now holding sellSilver last week we get 4500 points profit now holding sell trade downside target mention on chart until 113900 not break downside move will continue

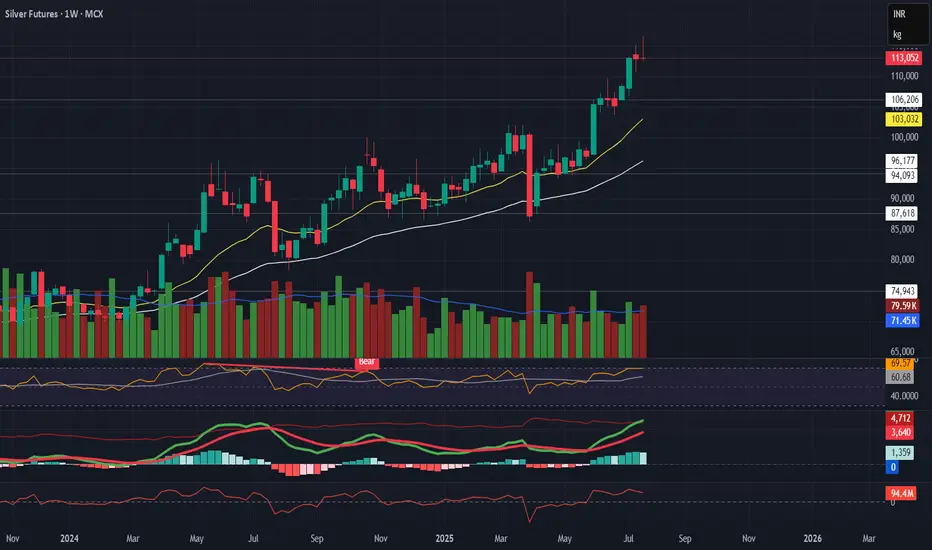
Silver Futures – Bearish Reversal in Progress
Silver Futures – Bearish Reversal in Progress
Description:
Silver is showing a strong technical reversal across timeframes. Short-term correction looks likely.
Technical Setup:
Daily:
Evening Star + Bearish Engulfing
Flattening EMAs
Volume and MACD confirming momentum slowdown
Weekly:
Gravestone + Southern Doji near resistance
RSI close to overbought
EMA slope still up, but weakening signs visible
Macro View:
No major bearish macro trigger — Fed dovish, USD stable, inflation low.
→ This is likely a technical pullback, not a fundamental reversal.
Trade Plan:
🔻 Breakdown Level: ₹114,560
🎯 Targets: ₹107K → ₹101K → ₹93K
🛑 SL: ₹116,000+
Caution: No position without breakdown confirmation.
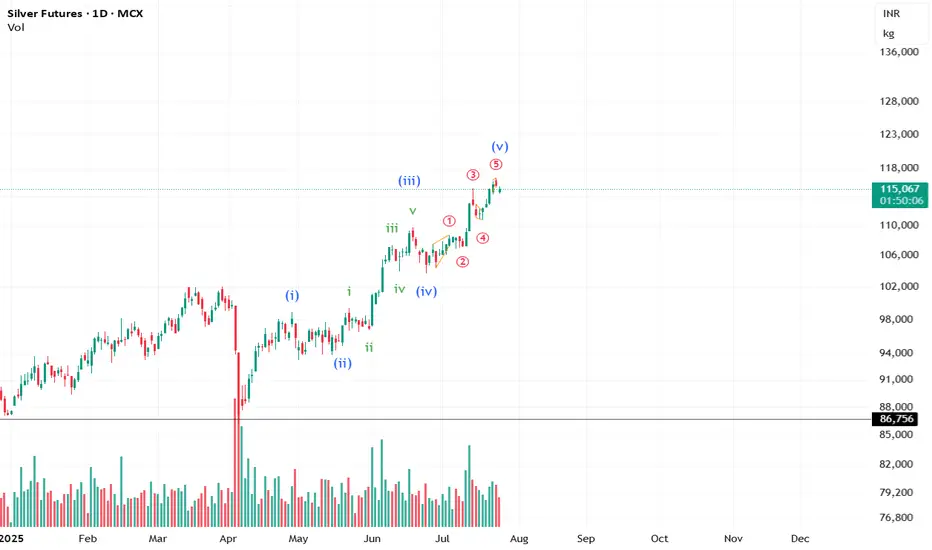
Is the move over for Silver? #CommodityIt looks like the impulse for Silver is about to end. However, we still need the price action to confirm the view.
**This analysis is based on the Elliott Wave Principle.
This analysis is for educational purposes only and not investment advice.
Please consult your SEBI-registered advisor before making any investment decisions. Markets are subject to risk.**
$MCX:SILVERM1! – 13-Year Highs | Holding LongMCX:SILVERM1! just broke above a 13-year resistance, marking a major technical milestone.
We are holding our long position as price shows strong momentum and trend continuation potential.
📊 Highlights:
All-time breakout after more than a decade
Strong trend structure on higher timeframes
Momentum and volume backing the move
✅ Position: Long
📈 Bias: Bullish
⏳ View: Swing / Positional
Letting winners run while the trend is strong.
Watching for follow-through and possible re-entry setups on pullbacks.
Silver buy in dip near support given on chart will make new highHow My Harmonic pattern projection Indicator work is explained below :
Recent High or Low :
D-0% is our recent low or high
Profit booking zone: D13% -D15% is
range if break them profit booking start on uptrend or downtrend but only profit booking, trend not changed
SL reversal zone : SL 23% and SL 25% is reversal zone if break then trend reverse and we can take reverse trade
Target : T1, T2, T3, T4 and .
Are our Target zone
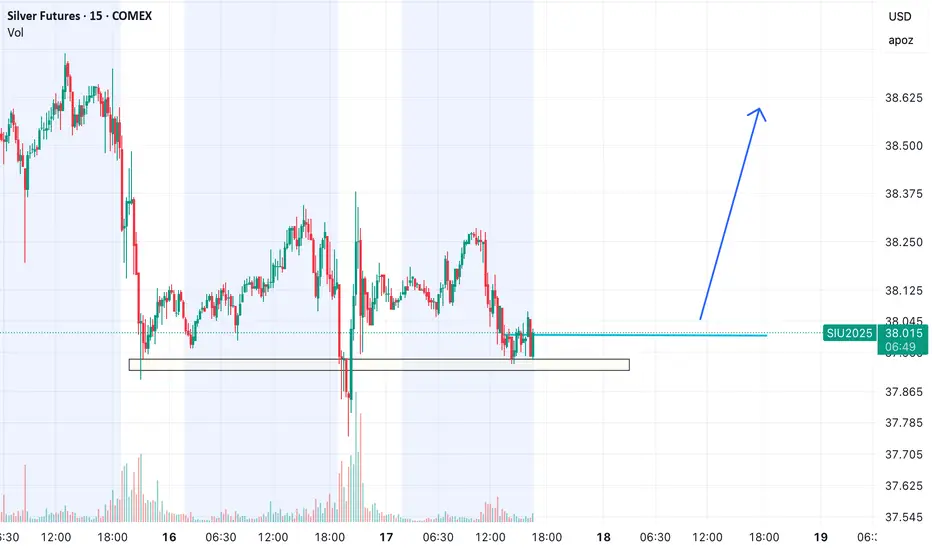
Silver Lining in a Foggy Macro — A Low-Risk Entry with High RS
CMP: $38.015
Buy Range: $37.95–38.05 (current zone)
Target 1: $38.60
Target 2: $39.10
Stop Loss: $37.65
Time Horizon: 2–4 sessions
Rationale:
1. Macro Tailwinds
• US Inflation Cooling: The recent softening in CPI and PPI prints has revived expectations of a Fed rate cut by September, weakening the dollar slightly and supporting precious metals.
• Real Yields Topping Out: With 10Y real yields unable to break out higher, silver (which correlates inversely) gets a tailwind.
• Global Risk Aversion: Amid rising geopolitical caution (e.g., US elections, China demand concerns), silver’s dual industrial + safe haven appeal makes it a better pick than gold on risk-reward.
2. Technical Setup
• The $37.85–37.95 zone has acted as a strong base, seeing high-volume defenses over 3 sessions.
• The false breakdown on July 16 was immediately absorbed, showing signs of strong demand.
• The structure shows a potential reversal with higher lows, and if price sustains above $38.05, we may get a quick leg toward $38.60–39.10.
• RSI (not visible here, but from broader chart) is curling up from neutral levels — a sign of early momentum building.
“You don’t buy silver just because it’s shiny; you buy it when it’s unloved and basing at a zone where risk is controlled, and macros are bending in your favor. This is one of those trades — not a moonshot, but a professional nibble.”
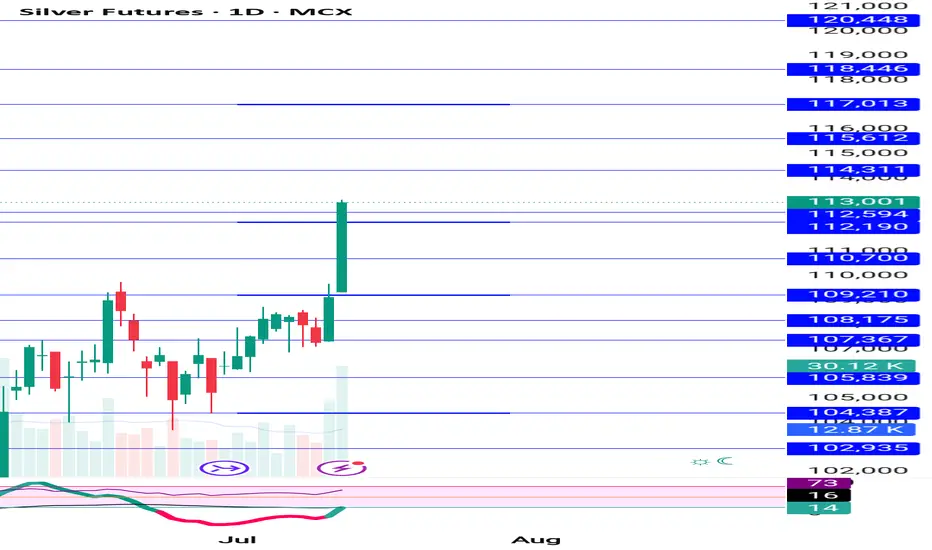
Silver holding buy from 111750 , we can see new ATH How My Harmonic pattern projection Indicator work is explained below :
Recent High or Low :
D-0% is our recent low or high
Profit booking zone: D13% -D15% is
range if break them profit booking start on uptrend or downtrend but only profit booking, trend not changed
SL reversal zone : SL 23% and SL 25% is reversal zone if break then trend reverse and we can take reverse trade
Target : T1, T2, T3, T4 and .
Are our Target zone

Silver yesterday sold at 114450 today booked at 111200 avoid buyHow My Harmonic pattern projection Indicator work is explained below :
Recent High or Low :
D-0% is our recent low or high
Profit booking zone: D13% -D15% is
range if break them profit booking start on uptrend or downtrend but only profit booking, trend not changed
SL reversal zone : SL 23% and SL 25% is reversal zone if break then trend reverse and we can take reverse trade
Target : T1, T2, T3, T4 and .
Are our Target zone


Silver 113k target done 115k and 116500 next target How My Harmonic pattern projection Indicator work is explained below :
Recent High or Low :
D-0% is our recent low or high
Profit booking zone: D13% -D15% is
range if break them profit booking start on uptrend or downtrend but only profit booking, trend not changed
SL reversal zone : SL 23% and SL 25% is reversal zone if break then trend reverse and we can take reverse trade
Target : T1, T2, T3, T4 and .
Are our Target zone
SILVER 14 TO 18JULYNext week the trend of silver will remain upside, silver on top will be 115327.Silver, if breaks 115693 then there is a possibility of it going till 117500 also.invalidation level mention on chart.

Silver updated levels if break High then 2-3% upmove next week How My Harmonic pattern projection Indicator work is explained below :
Recent High or Low :
D-0% is our recent low or high
Profit booking zone: D13% -D15% is
range if break them profit booking start on uptrend or downtrend but only profit booking, trend not changed
SL reversal zone : SL 23% and SL 25% is reversal zone if break then trend reverse and we can take reverse trade
Target : T1, T2, T3, T4 and .
Are our Target zone
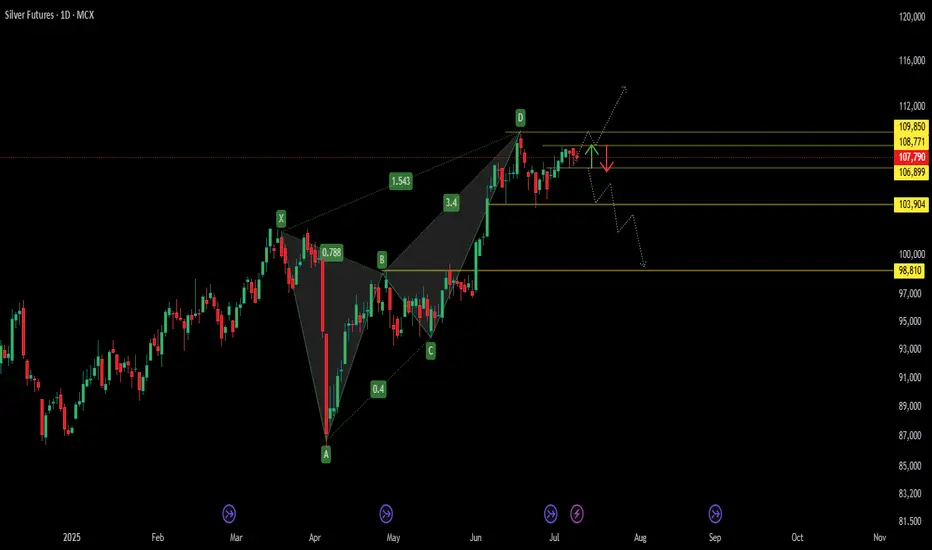
Bearish Harmonic in Play – Silver Sell Zone TriggeredBearish Harmonic in Play – MCX:SILVER1! Sell Zone Triggered 🔔
The pattern marked from X → A → B → C → D forms a Bearish Harmonic Structure , most likely a Bearish Butterfly , confirmed by key Fibonacci ratios:
* XA to AB retracement: 78.8%
* BC to CD extension: 1.543
This setup signals the formation of a Potential Reversal Zone (PRZ) near point D , where a bearish trend may initiate.
📉 Bearish Price Outlook
The dotted projection lines and red arrow illustrate the anticipated downward move:
* Price is likely to face resistance and reverse from the PRZ between ₹108,771 and ₹109,850
* A break below ₹106,899 could trigger further decline toward key support levels at ₹103,904 and ₹98,810
Silver sell on rise until 109k not break making bearish M paternHow My Harmonic pattern projection Indicator work is explained below :
Recent High or Low :
D-0% is our recent low or high
Profit booking zone: D13% -D15% is
range if break them profit booking start on uptrend or downtrend but only profit booking, trend not changed
SL reversal zone : SL 23% and SL 25% is reversal zone if break then trend reverse and we can take reverse trade
Target : T1, T2, T3, T4 and .
Are our Target zone

Silver mcx updated levels buy on dip at support avoid sell tradeHow My Harmonic pattern projection Indicator work is explained below :
Recent High or Low :
D-0% is our recent low or high
Profit booking zone: D13% -D15% is
range if break them profit booking start on uptrend or downtrend but only profit booking, trend not changed
SL reversal zone : SL 23% and SL 25% is reversal zone if break then trend reverse and we can take reverse trade
Target : T1, T2, T3, T4 and .
Are our Target zone
Silver buy given at 106300 near book profit 107600 nearHow My Harmonic pattern projection Indicator work is explained below :
Recent High or Low :
D-0% is our recent low or high
Profit booking zone: D13% -D15% is
range if break them profit booking start on uptrend or downtrend but only profit booking, trend not changed
SL reversal zone : SL 23% and SL 25% is reversal zone if break then trend reverse and we can take reverse trade
Target : T1, T2, T3, T4 and .
Are our Target zone

Silver making poll&flag pattern , ready for fresh ATH buy dipHow My Harmonic pattern projection Indicator work is explained below :
Recent High or Low :
D-0% is our recent low or high
Profit booking zone: D13% -D15% is
range if break them profit booking start on uptrend or downtrend but only profit booking, trend not changed
SL reversal zone : SL 23% and SL 25% is reversal zone if break then trend reverse and we can take reverse trade
Target : T1, T2, T3, T4 and .
Are our Target zone
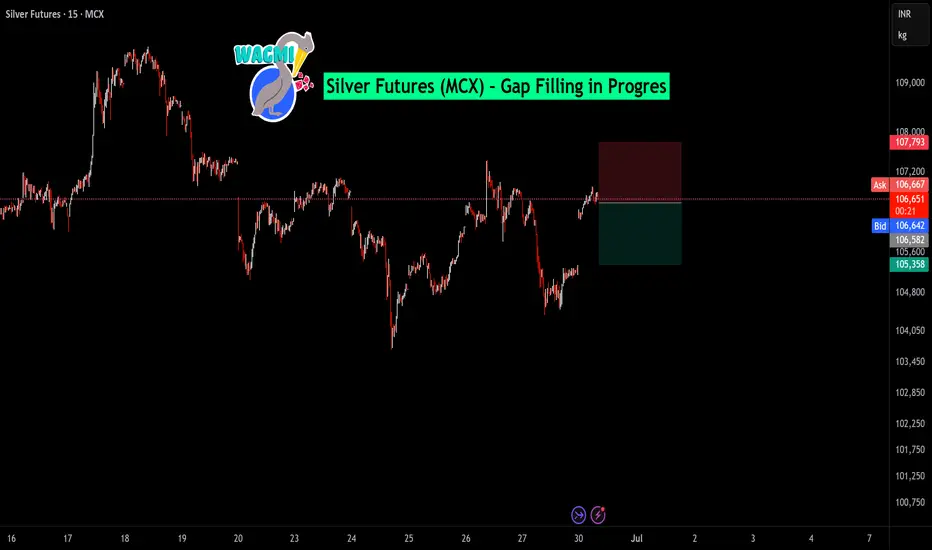
Silver Futures (MCX) – Gap Filling in ProgressSilver is showing signs of weakness after a recent rally and is now hovering near a key gap zone, hinting at a potential gap fill move in the short term.
🔻 Chart Insight:
Price is stalling just below the previous resistance zone.
A visible gap exists between 106,674 and 105,358, which the market is likely to fill.
The price has already started rejecting higher levels, indicating profit booking and bearish pressure.
📉 Outlook:
Silver futures are expected to fill the gap down to the 105,358 level before any sustainable bounce. If the price breaks below 106,582, the gap-fill probability increases significantly.
📌 Conclusion:
Gap-filling action is likely on the cards. Traders should watch price behavior near 106,500–105,350 for potential bounce zones or continuation signals.
Silver .. IN distribution test Phase.. Bearish trendSilver 106474 is in UTAD phase.
UTAD- shakeout in the accumulation It occurs in the latter stages and provides a definitive test of new demand after a breakout above the resistance.
Silver has resistance at 108686.
Currently it is trading below 106900
As long as it trade below 106900, Nifty will be in bearish trend and possibility for falling down to 97633

Head and shoulder pettren in silverHead and shoulder in silver in silver at one day time frame may be a big break down in gold and silver

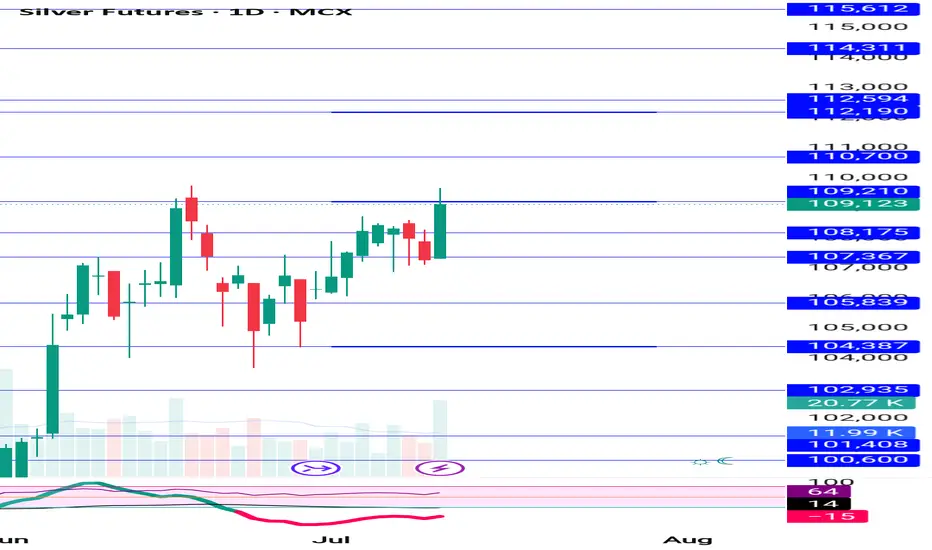
Silver holding buy trade avg 105700 , upside Target on chartHow My Harmonic pattern projection Indicator work is explained below :
Recent High or Low :
D-0% is our recent low or high
Profit booking zone: D13% -D15% is
range if break them profit booking start on uptrend or downtrend but only profit booking, trend not changed
SL reversal zone : SL 23% and SL 25% is reversal zone if break then trend reverse and we can take reverse trade
Target : T1, T2, T3, T4 and .
Are our Target zone

Silver holding buy trade avg 105700 upmove will continue, How My Harmonic pattern projection Indicator work is explained below :
Recent High or Low :
D-0% is our recent low or high
Profit booking zone: D13% -D15% is
range if break them profit booking start on uptrend or downtrend but only profit booking, trend not changed
SL reversal zone : SL 23% and SL 25% is reversal zone if break then trend reverse and we can take reverse trade
Target : T1, T2, T3, T4 and .
Are our Target zone
