SOL DUMP TO THE $40YES, YOU SEEN RIGHT
CRYPTO:SOLUSD
SOL ready with multiple negative patterns.
1. all time resistance
2. triple top
3. cup and handle failure
First pattern is already activated and triple top near to active.
Reverse scenario
take support from major strong support. cup and handle breakout
🧠 Alwa
Key stats
About Solana
Solana is a blockchain fairly new to the crypto game, but that's not to say it's not a serious player. Attempting to rival smart-contract titan Ethereum for the NFT and web3 crown, Solana has a strong focus on scalability through its hybrid proof-of-history/proof-of-stake consensus that aims to accommodate a flourishing dApp ecosystem. Its native token SOL has enjoyed the successes of Solana-based NFTs and dApps, but since its inception has also felt the strain of the network’s tendency to experience outages. Although that hasn't stopped it from reaching the top 15 coins by market cap.
Related coins

FVG Retracement in a Downtrend📈 Solana Chart – Fair Value Gap Retracement in a Bearish Market Structure
This chart highlights a clear bearish sequence, defined by a repeated formation of Lower Highs (LH) and Lower Lows (LL) with some Higher Highs (HH) and Higher Lows (HL). Throughout this downtrend, multiple Fair Value Gaps (

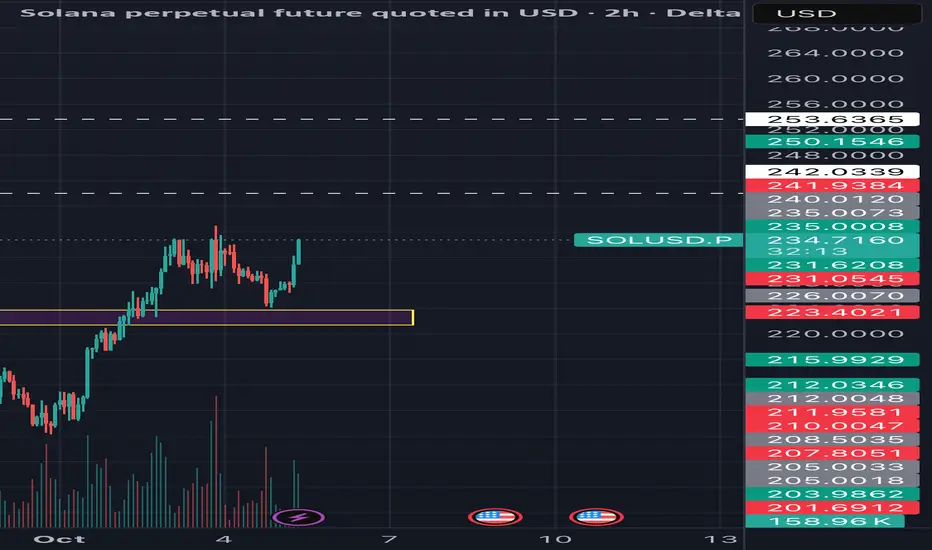
SOLUSD TRADING LEVELSTrading Levels for SOLUSD
Anyone can Trade on both sides (as per levels). WITH STRICT SL.
Levels shared on chart

Breakout Play: Demand Zone Reversal with High R:R TargetOverview :
This idea focuses on a breakout trade for Solana (SOLUSD), leveraging recent price action and volume signals at a key demand zone. The setup is designed for a high risk-to-reward ratio based on technical structure and confirmation tools.
Trade Setup & Logic:
• Entry: Price retraced to
Don't miss this explosive move on solana!!!Its taking rejection from 0.5 of fib and volume profile rejection from low volume indicates an upward move.
ONLY and ONLY go for buy if you see a bullish candle !!!
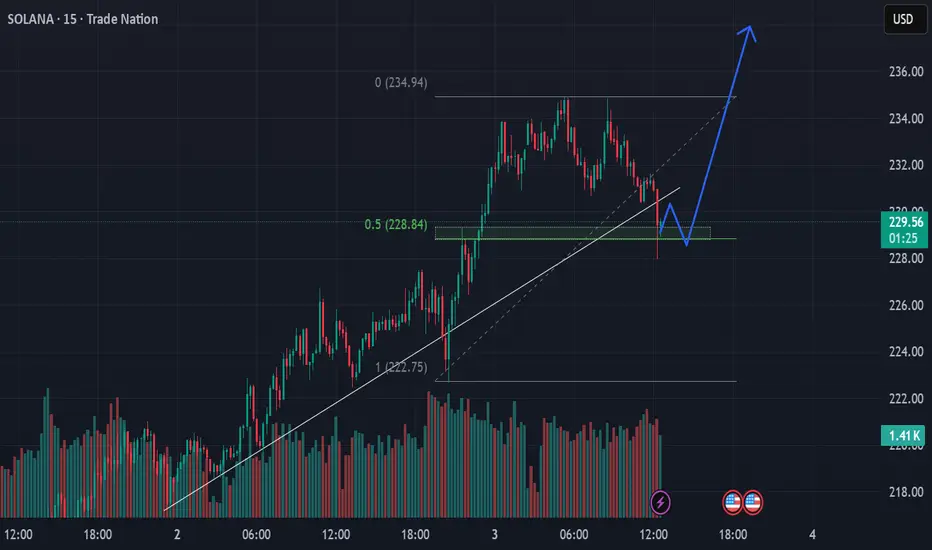
On reversal in 1hr and in 4hr GO LONG in SOLANA199.2162 looks like a good level from where a smaller time frame reversal is expected.
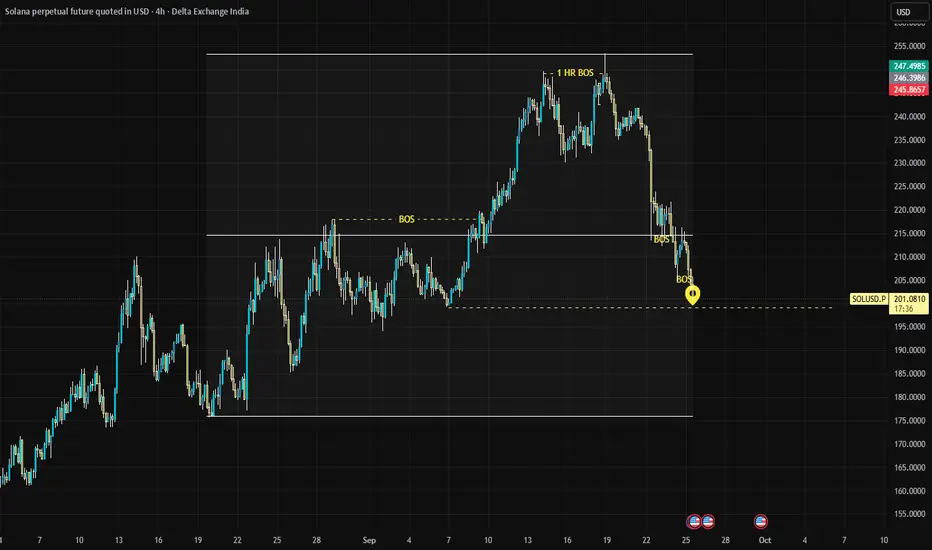
CRYPTO ALERT: SOLANA SHORT TERM BEARISH TREND IN 4H CHARTSOLANA, one of the most traded crypto after BTC and ETH is in a short term bearish trend on the 4H chart. It has multiple demand zones and unmitigated order blocks pending for execution before any further upward movement.
SOLUSD can be shorted at CMP 236 with Stop Loss at 244 for short term targets

SOLANA/USDT Buy Setup – Daily Bullish MomentumMarket Overview
Solana (SOL/USDT) continues to show strength on higher timeframes. The daily chart structure is bullish, and momentum aligns with the weekly timeframe, creating a strong confluence for further upside.
Buy Zone & Entry Strategy
We are looking to accumulate in two parts within the key

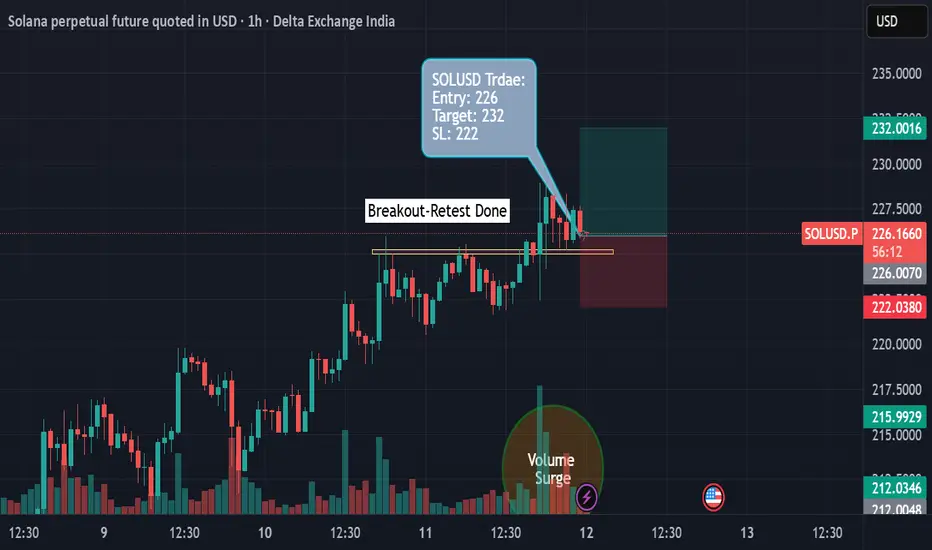
Solana (1H Chart) - Breakout-Retest Long TradeThis is a long trade setup for Solana perpetual futures based on a breakout and retest structure, placed on the 1-hour chart.
Trade Overview
• The chart shows price consolidating near a horizontal resistance zone (yellow line), followed by a breakout above this level and a subsequent retest.
• T
Solana Breakout: Ready for Bull Rally After Key Resistance FlipSolana (SOL) has decisively broken out above key resistance in September 2025, signaling strong bullish momentum as traders eye new targets.
Technical Setup and Breakdown:
Solana (SOL) has decisively broken out above the key resistance zone of $200–$210, a level that capped price gains for month

See all ideas
Summarizing what the indicators are suggesting.
Oscillators
Neutral
SellBuy
Strong sellStrong buy
Strong sellSellNeutralBuyStrong buy
Oscillators
Neutral
SellBuy
Strong sellStrong buy
Strong sellSellNeutralBuyStrong buy
Summary
Neutral
SellBuy
Strong sellStrong buy
Strong sellSellNeutralBuyStrong buy
Summary
Neutral
SellBuy
Strong sellStrong buy
Strong sellSellNeutralBuyStrong buy
Summary
Neutral
SellBuy
Strong sellStrong buy
Strong sellSellNeutralBuyStrong buy
Moving Averages
Neutral
SellBuy
Strong sellStrong buy
Strong sellSellNeutralBuyStrong buy
Moving Averages
Neutral
SellBuy
Strong sellStrong buy
Strong sellSellNeutralBuyStrong buy
Displays a symbol's price movements over previous years to identify recurring trends.
Curated watchlists where SOLUSD is featured.

Gen 3 crypto: A new day dawns…
25 No. of Symbols

Smart contracts: Make the smart decision
36 No. of Symbols

Staking Coins: Pick up a stake
18 No. of Symbols

Top altcoins: Choose your alternatives carefully
28 No. of Symbols

Up-and-coming crypto: New kids on the block
30 No. of Symbols
See all sparks
Frequently Asked Questions
The current price of Solana (SOL) is 136.19 USD — it has risen 0.45% in the past 24 hours. Try placing this info into the context by checking out what coins are also gaining and losing at the moment and seeing SOL price chart.
The current market capitalization of Solana (SOL) is 76.17 B USD. To see this number in a context check out our list of crypto coins ranked by their market caps or see crypto market cap charts.
Solana (SOL) trading volume in 24 hours is 4.47 B USD. See how often other coins are traded in this list.
Solana price has fallen by −0.77% over the last week, its month performance shows a −30.25% decrease, and as for the last year, Solana has decreased by −41.83%. See more dynamics on SOL price chart.
Keep track of coins' changes with our Crypto Coins Heatmap.
Keep track of coins' changes with our Crypto Coins Heatmap.
Solana (SOL) reached its highest price on Jan 19, 2025 — it amounted to 295.00 USD. Find more insights on the SOL price chart.
See the list of crypto gainers and choose what best fits your strategy.
See the list of crypto gainers and choose what best fits your strategy.
Solana (SOL) reached the lowest price of 8.00 USD on Dec 29, 2022. View more Solana dynamics on the price chart.
See the list of crypto losers to find unexpected opportunities.
See the list of crypto losers to find unexpected opportunities.
The current circulating supply of Solana (SOL) is 614.79 M USD. To get a wider picture you can check out our list of coins with the highest circulating supply, as well as the ones with the lowest number of tokens in circulation.
The safest choice when buying SOL is to go to a well-known crypto exchange. Some of the popular names are Binance, Coinbase, Kraken. But you'll have to find a reliable broker and create an account first. You can trade SOL right from TradingView charts — just choose a broker and connect to your account.
Crypto markets are famous for their volatility, so one should study all the available stats before adding crypto assets to their portfolio. Very often it's technical analysis that comes in handy. We prepared technical ratings for Solana (SOL): today its technical analysis shows the sell signal, and according to the 1 week rating SOL shows the sell signal. And you'd better dig deeper and study 1 month rating too — it's sell. Find inspiration in Solana trading ideas and keep track of what's moving crypto markets with our crypto news feed.
Solana (SOL) is just as reliable as any other crypto asset — this corner of the world market is highly volatile. Today, for instance, Solana is estimated as 3.82% volatile. The only thing it means is that you must prepare and examine all available information before making a decision. And if you're not sure about Solana, you can find more inspiration in our curated watchlists.
You can discuss Solana (SOL) with other users in our public chats, Minds or in the comments to Ideas.