SOL Buyers Have a Second ChanceHello Traders! 👋
SOL has already delivered the expansion. After breaking out of its previous consolidation, price pushed toward $120 and confirmed that buyers are still active on the daily chart.
The $107–$110 area is where I want to see the market return. This zone was resistance before the breakout; a successful defense now would show that demand has moved higher and the market is accepting prices above the old range.
If that happens, I’ll be watching for a renewed push through $120, with $1
In-depth trading ideas
SOL/USDT: Bearish MACD Divergence After Rally — Short SetupBias: Short (Bearish)
Timeframe: 15-Minute (15m)
Instrument: SOL/USDT (Binance)
Technical Analysis:
Bearish MACD Divergence: While SOL pushed higher into the $120.00 resistance zone forming a higher high, the MACD indicator marked clear lower highs. This loss of upside momentum suggests exhaustion among buyers at current levels.
Resistance Rejection: The price faced immediate rejection near the $120.00–$121.00 psychological level, breaking below local micro-trendline support.
Targ
SOLUSDT: Channel Lost, 100 USDT Back to FocusSOLUSDT is trading around 102.76 USDT after breaking below the ascending channel that had been in place since early September. The price is currently sitting below both the EMA34 and EMA89 (near 104.0), indicating that the short-term structure is increasingly bearish.
The 103.2–104.5 zone now serves as a key resistance area, representing a confluence of the previous breakdown level and the EMA cluster. If SOL rallies to this zone but faces rejection, I anticipate a drop to 101.5, followed by an
SOL/USDT — Professional Technical Analysis🚀 SOL/USDT — Professional Technical Analysis
📊 Timeframe: 2H
💰 Current Price: ~105.09 USDT
🟢 Market Structure
SOL is still trading inside a bullish ascending channel, maintaining higher highs and higher lows. Price is currently consolidating after rejection from 110.59 resistance.
🎯 Key Levels
🔴 Resistance: 110.59
🟡 Short-term Support: 102–104
🔵 Channel Support: 98–100
🟢 Major Order Block: 94.5–96.3
📈 Bullish Scenario
If SOL holds 102–104 and breaks above 106–108, the next target could be 1
SOLUSDT: Breakout Confirmed — Is 105 Next?SOL has pushed decisively above the resistance zone that capped price earlier. The breakout came with strong momentum, which tells me buyers are not simply testing the level—they are trying to take control of it.
After a move like this, a pullback into the broken zone would be healthy. The key is whether price can return there and hold above it. If former resistance starts acting as support, the breakout gains much more weight.
As long as buyers protect that area, the path toward 105 remains o
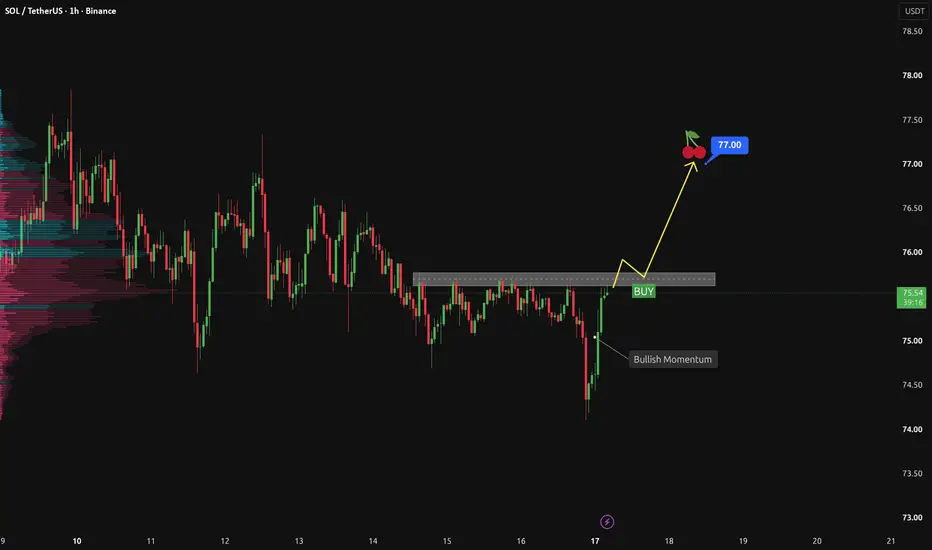
SOLUSDT Is Waiting for a Breakout. Could 77.00 Be Next?SOLUSDT is currently approaching the key resistance zone between 75.60 and 75.75, an area that has capped several previous recovery attempts. For me, this is not the time to rush into a long position. I want to see price break clearly above the zone, then return to retest and hold it as new support.
If the retest produces clear bullish confirmation, such as a strong rejection wick or increasing buying volume, it could signal that buyers have regained control. In that case, my next target would
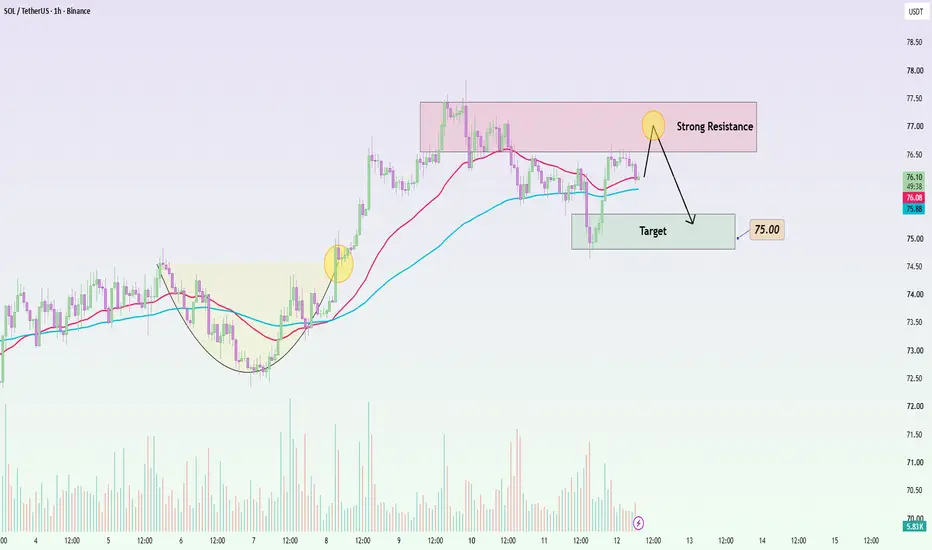
SOLUSDT: A Tough Hurdle for the BullsSOLUSDT is hovering around 76.0 USDT; despite a rebound from the 75 level, it has yet to break past the 76.6–77.4 USDT resistance zone.
Macro factors currently favor a correction scenario. The USD is edging up, Bitcoin remains under pressure near the 63.6K mark, and the crypto market is maintaining a cautious stance ahead of the US CPI data.
On the 1-hour (H1) chart, if SOL continues to face rejection at the 76.6–77.4 range, I lean towards the likelihood of the price retesting 75.0 USDT. The b
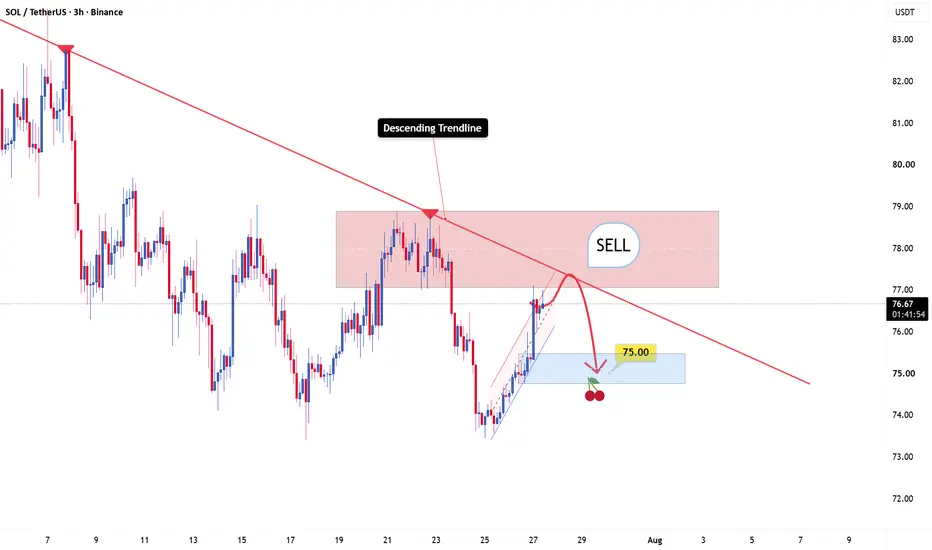
SOLUSDT: A Short-Term Pullback Could Be ComingSolana has shown strong recovery momentum recently, with buyers stepping in aggressively after the sharp decline.
However, I don’t think this upside move will continue without facing resistance. The current structure is starting to approach an important area where sellers have previously defended, and this could create some short-term pressure.
Right now, SOL is testing a key resistance zone formed by the descending trendline and the supply area around 77.00–79.00. This zone has acted as a bar
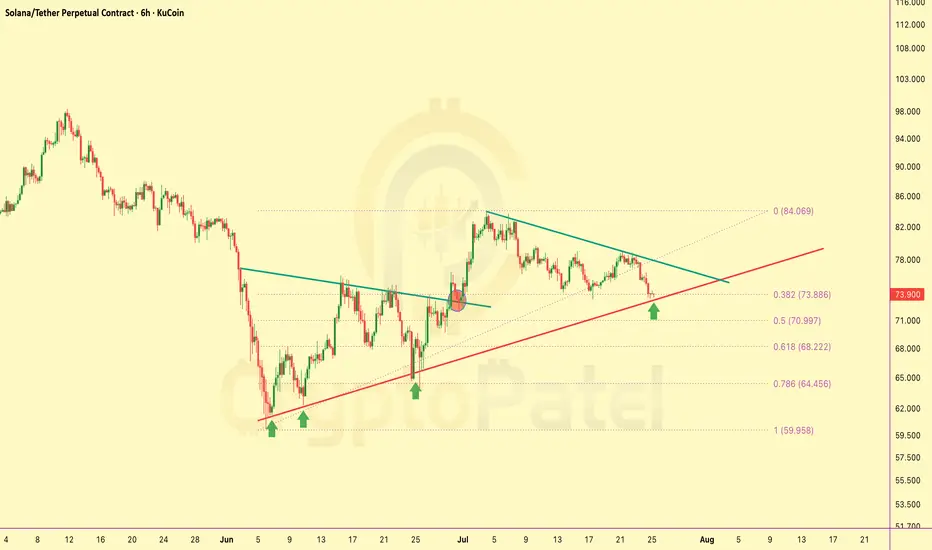
$SOL Is Sitting At The Most Important Level Of This CycleCRYPTOCAP:SOL Is Sitting At The Most Important Level Of This Cycle
#SOL is trading inside a high-confluence HTF demand zone where the previous breakout base, weekly support, and the 0.618 Fibonacci retracement all intersect.
This is the market's decision point.
▶️ Hold $73 → Bullish structure remains intact.
▶️ Lose $73 → High probability of a move into the $68–$64 liquidity zone.
▶️ Reclaim $77 → Confirms bullish continuation and opens the path toward the next HTF expansion.
The next macro
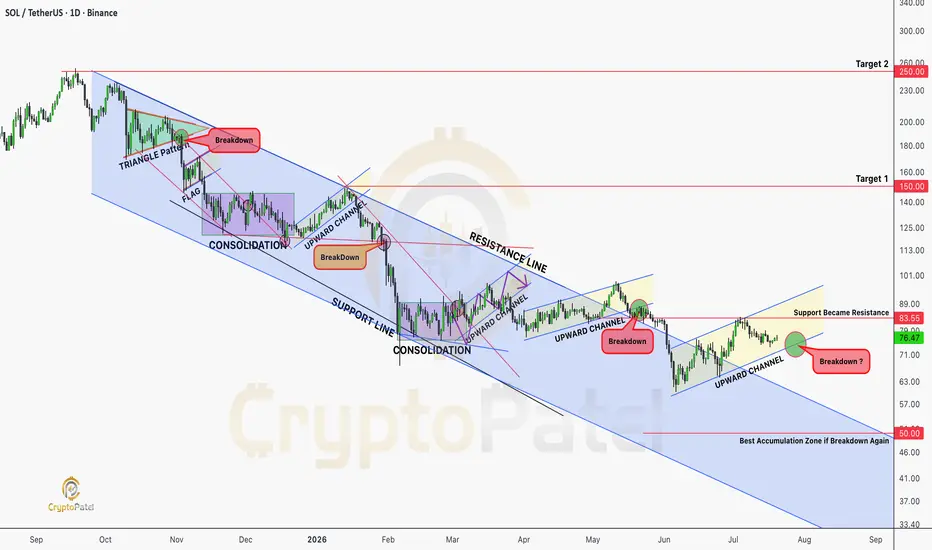
Will Solana Potential $1000 in Next Altseason?CRYPTOCAP:SOL Is Sitting At A Critical HTF Decision Point.
Lose This Rising Channel And A Move Toward The $70–$50 Accumulation Zone Becomes Increasingly Likely. Bulls Must Defend.
Long Term, I'm Highly Confident CRYPTOCAP:SOL Can Reach $500, Then $1,000. That's Why $70–$50 Looks Like A High-Conviction Accumulation Zone For Patient Investors. 🚀
NFa & Always DYOR
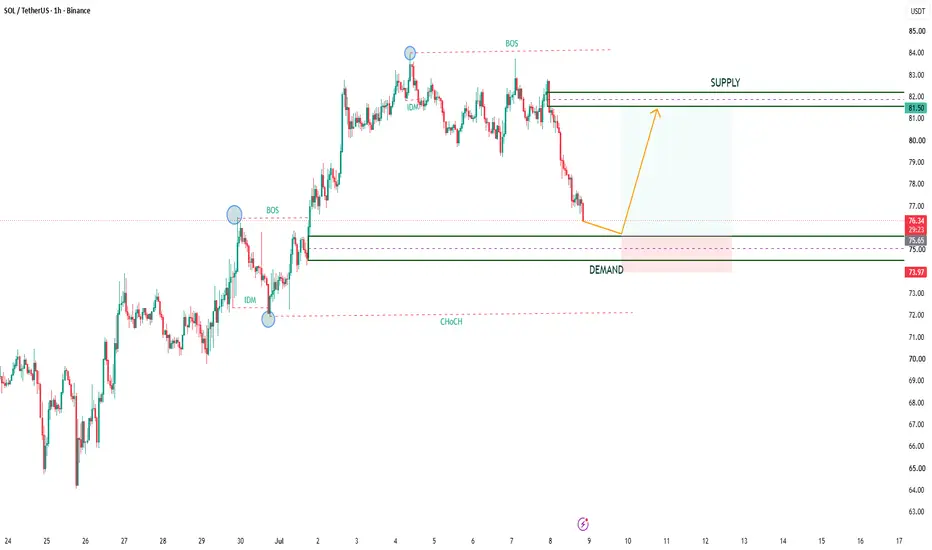
SOLUSDT Bullish SMC Setup | Demand Zone Retest + BOS + IDM (1H)his chart highlights a potential bullish Smart Money Concepts (SMC) setup on SOLUSDT (1H).
Analysis Overview
✅ Bullish Break of Structure (BOS) confirmed
✅ Inducement (IDM) sweep completed
✅ Price retracing into a high-probability Demand Zone
✅ Looking for bullish confirmation from the Demand Zone
✅ Target is the previous Supply/Liquidity area
Trading Idea
After confirming a Bullish BOS, the market created an Inducement (IDM) before entering a corrective move. Price is now approaching a well-d
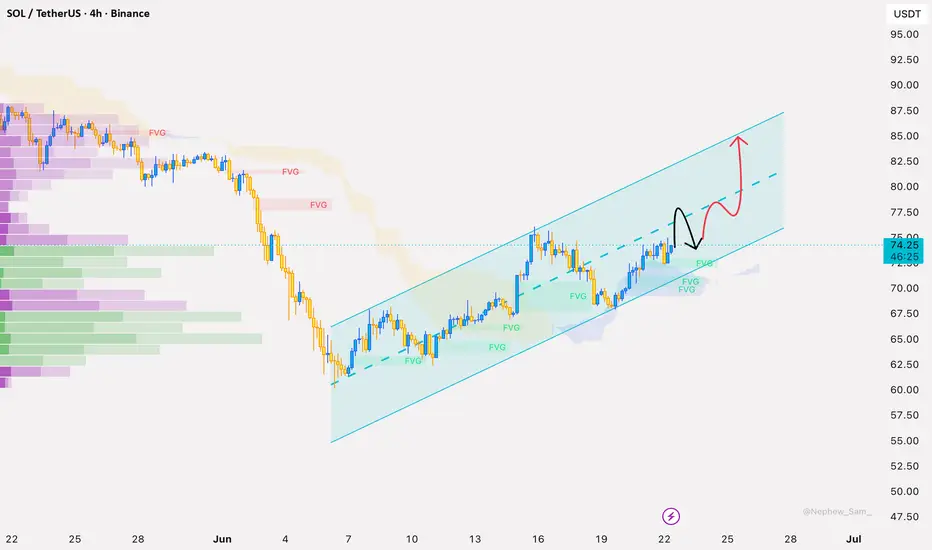
Solana Builds Momentum as Bulls Eye the $80 BreakoutSolana continues to trade with a strong bullish structure after reclaiming the $74 area. Buyers remain in control, and the recent breakout suggests the market could challenge the psychological $80 resistance.
Although crypto sentiment remains cautious due to continued Bitcoin ETF outflows, SOL is outperforming many major altcoins from a technical perspective.
Trade Setup:
Buy Zone: $75.50 – $76.50
Stop Loss: $73.50
Take Profit 1: $80.00
Take Profit 2: $84.00
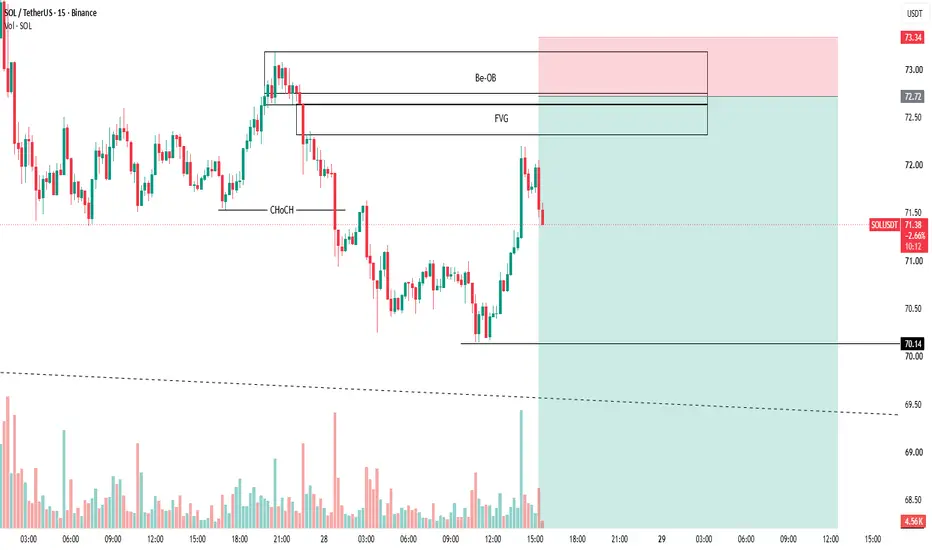
SOLUSDT CONSOLIDATION CONTINUESAs we know SOLUSDT is consolidating in a 4 hour time frame range and it has given a change of character signal near its range high at the level of 71.53 on 15 minutes time frame and has formed an order block at the levels of 73.18 to 72.63 as it has an FVG near its order block at the levels of 72.64 - 72.32, i'm planning to enter at the level of 72.75 which is 50% area of its order block and FVG combined with the stoploss slightly above the level of order block at 73.35 and i'll target the level
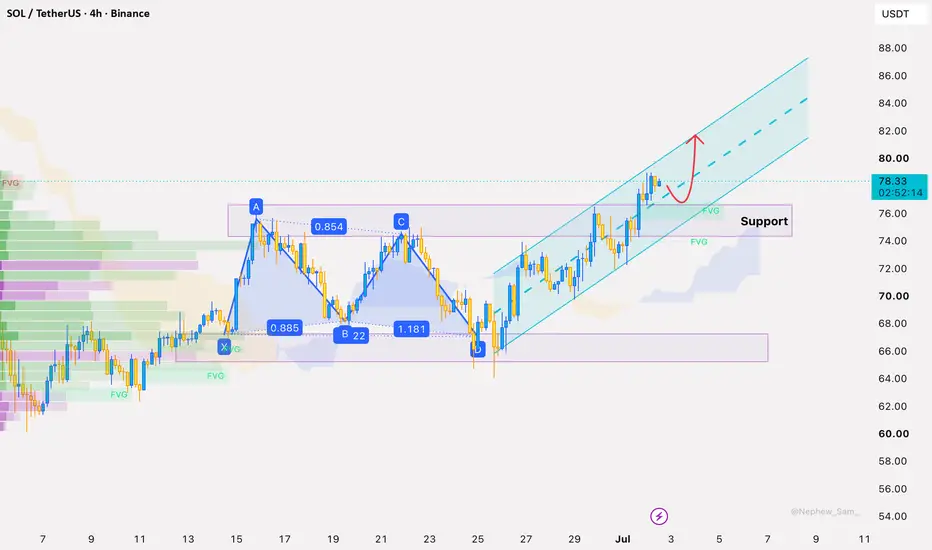
Solana Builds Strength Above $72 as Bulls Target $80Solana continues to build a constructive recovery structure after rebounding from the $61–62 area. The latest move above $72 suggests buyers remain active, while recent pullbacks have been relatively shallow.
For crypto traders, the key zone now sits around $74–76. A breakout there could attract fresh momentum buyers and open the path toward higher levels.
Trade Setup:
Buy Zone: $72.00 – $73.00
Stop Loss: $69.50
Take Profit 1: $76.00
Take Profit 2: $80.00
Take Profit 3: $82.00
As long as SOL
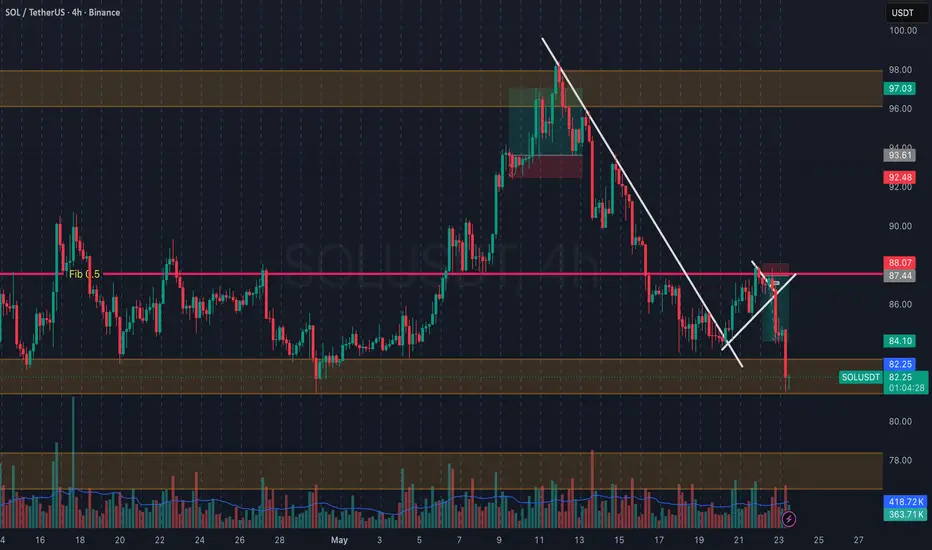
SOLUSDT 4H — Liquidity Sweep → Breakdown → Extended DumpClean example of how market makers engineer liquidity before the real move starts.
Price first swept liquidity above the local resistance and descending trendline, trapping late longs and breakout traders. Right after the sweep, rejection came aggressively and SOL started respecting bearish structure again.
I caught the first downside swing expecting a move into the support zone, but momentum was much stronger than anticipated and price continued falling almost double the projected move after
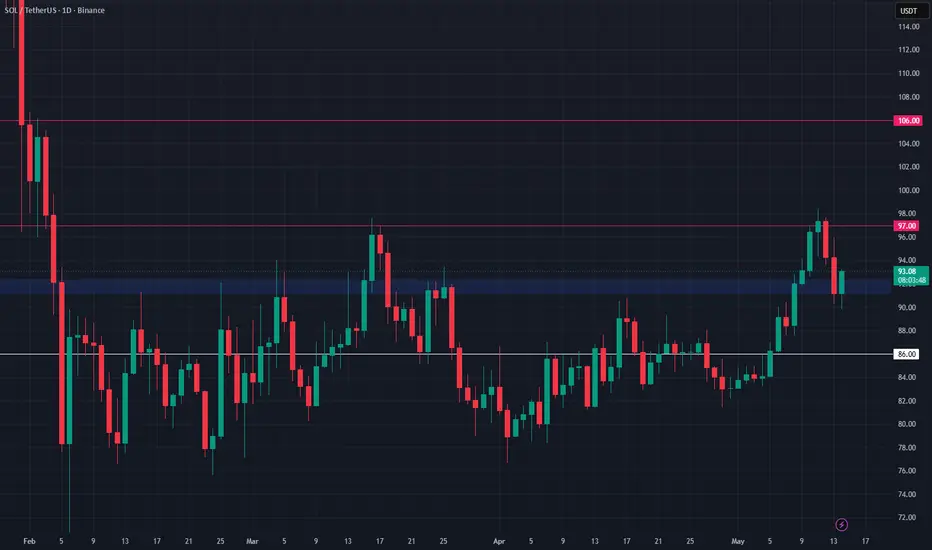
SOL Approaching Key Support — Long Swing Setup SOL is now approaching an important support zone around $91–$92, and this area could provide a good opportunity for a long swing setup. Price has pulled back, but if buyers defend this level, we may see a recovery move toward the next resistance zones.
Trading Levels:
Entry Zone: $91 – $92
Take Profit 1: $97
Take Profit 2: $106
Stop Loss: $86
Trade Type: Long Swing Trade
Risk Level: Medium
SOL/USDT (1D): Accumulation Complete? Breakout ImminentMarket Context:
Solana (SOL) has been locked in a massive daily accumulation phase since the sharp market correction in February. For over three months, the price has built a rock-solid foundation, and we are now witnessing a steady, aggressive push toward the upper boundary of this long-term range.
Technical Breakdown (Daily Timeframe):
The Accumulation Range: SOL has been perfectly respecting the structural boundaries—absorbing sell pressure at the $70 - $80 Demand Zone (lower pink box) a
SOLUSDT: Slowly Building Pressure for the Next Wave C RallySOLUSDT on the daily chart is starting to regain strength after holding the broader ascending structure from the 76 low. Price spent the last few weeks consolidating above the trendline instead of breaking below it, which shows buyers are still defending the higher timeframe trend. The recent push back above the 90.73 resistance area is an early sign that momentum may be shifting back toward the upside.
The corrective move also looks relatively controlled compared to the earlier rally. Instea
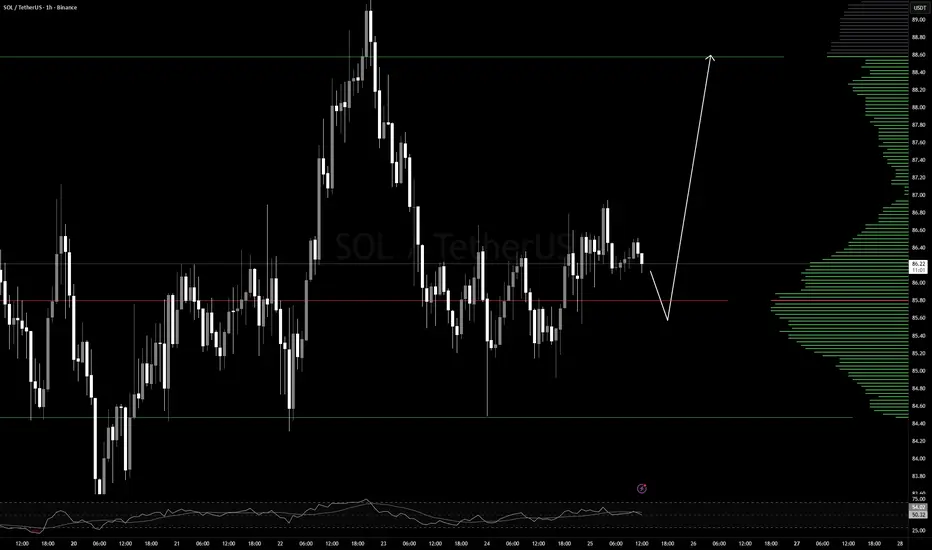
SOL/USD Attempts to Recover Towards the 90.00 LevelThe short-term market structure remains bearish, indicated by a series of Lower Highs (LH) and Lower Lows (LL). However, the price is currently testing the Major Demand Zone (lower gray box) in the 82.00-85.00 range.
Price Action: Consolidation is observed around 86.19. The emergence of several candles with long lower wicks indicates strong buying interest in the area.
The price is attempting a Change of Character (ChoCH) if it can break through the 90.00 level.
The main bias for SOLUSDT is c
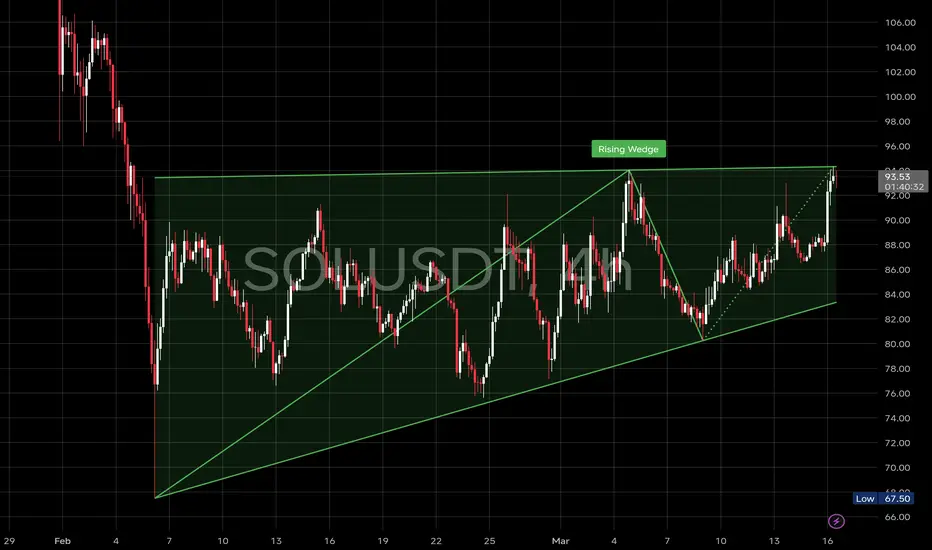
$SOL reaching the upper boundary of the rising wedge CRYPTOCAP:SOL All Targets Completed 💵
Now price is currently trading around $93 - $94, reaching the upper boundary of the rising wedge.
Now the interesting part begins.
Two possible scenarios from here:
📈 Bullish Breakout Scenario : If price breaks and holds above the upper wedge boundary (~$94). Momentum could expand quickly toward $98 → $102
📉 Rejection Scenario : If sellers defend this area again, Price could rotate back toward the mid-wedge region ($88–$90) And potentially revisit th
Solana was moving inside a rising wedge on the 4H chartCRYPTOCAP:SOL Update — Target 1 Completed 🎯
As discussed earlier, #Solana was moving inside a rising wedge on the 4H chart, with price approaching the $80–$81 lower wedge support. That zone acted as a strong reaction level multiple times in the past.
When price tested that support again, buyers stepped in exactly as expected.
From the support area around $82–$83, the market bounced strongly and hit $88.80, completing Target 1 perfectly. This confirms that the wedge structure is still being
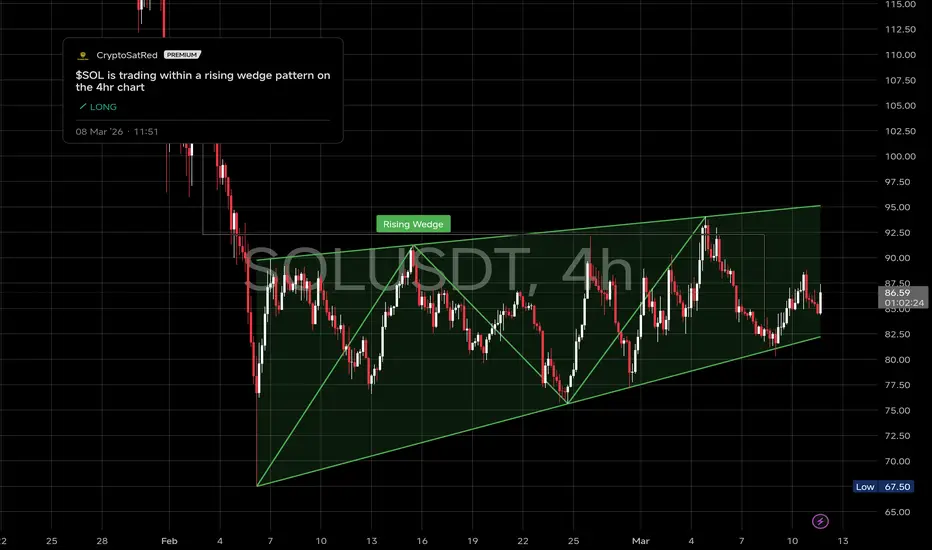
$SOL is trading within a rising wedge pattern on the 4hr chartCRYPTOCAP:SOL is presently trading within a rising wedge pattern on the 4-hour chart, with the current price around $82–$83 following a pullback from the recent $94 resistance level. The structure has been respected multiple times, and price is now approaching the lower wedge support, which is the key area to watch.
Current situation:
The $80–$81 region is acting as the lower boundary of this wedge. If buyers defend this support again, it could trigger another short-term bounce toward the uppe