As U.S. stocks head into the fourth quarter, investors are once (AMZN) seasonal advantages and structural market factors. Multiple bullish signals are currently aligning in favor of AMZN.
Santa Claus Rally Support
Historical data shows that from late November through early January, U.S. equities often experience what is known as the “Santa Claus Rally.” For Ama
Next report date
—
Report period
—
EPS estimate
—
Revenue estimate
—
5.66 EUR
57.23 B EUR
616.25 B EUR
9.66 B
About Amazon.com, Inc.
Sector
Industry
CEO
Andrew R. Jassy
Website
Headquarters
Seattle
Founded
1994
ISIN
US0231351067
FIGI
BBG000BWBBZ1
Amazon.com, Inc. is a multinational technology company, which engages in the provision of online retail shopping services. It operates through the following segments: North America, International, and Amazon Web Services (AWS). The North America segment offers retail sale of consumer products, including from sellers, advertising, and subscriptions services through North America-focused online and physical stores. The International segment focuses on retail sale of consumer products, including from sellers, advertising, and subscription services through internationally-focused online stores. The AWS segment is composed of global sales of compute, storage, database, and other services for start-ups, enterprises, government agencies, and academic institutions. The company was founded by Jeffrey P. Bezos in July 1994 and is headquartered in Seattle, WA.
Related stocks

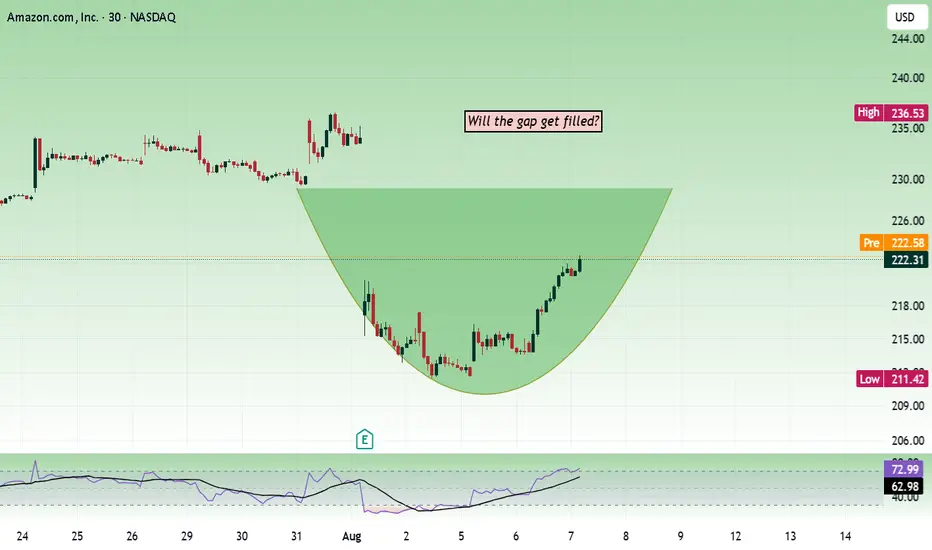
Amazon - Will the gap get filled?Price is sustaining an important level of 220. It can make the price move towards the 230 zone.
Below 220, the price will start to lose bullish strength. The next support is at 200–202, with 220 being a strong support.
Buy above 221.5 with the stop loss of 220 for the targets 223, 224.5, 227, and 22
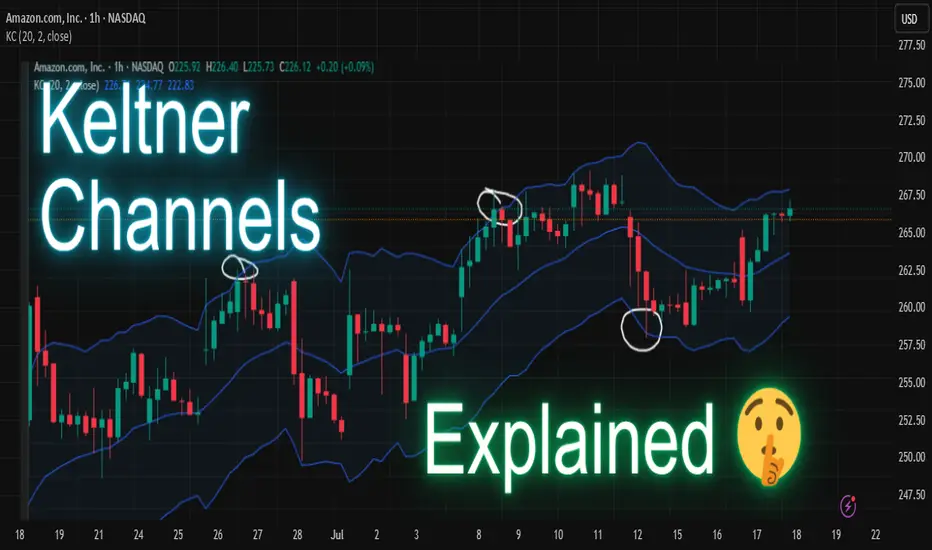
The Keltner Channels Indicator ExplainedDive into the world of Keltner Channels—a powerful volatility-based indicator used by traders to spot trends, reversals, and breakout opportunities! Let’s see how you can use it to enhance your trading decisions. 🚀
What Are Keltner Channels? 🤔
Keltner Channels consist of three lines plotted aroun
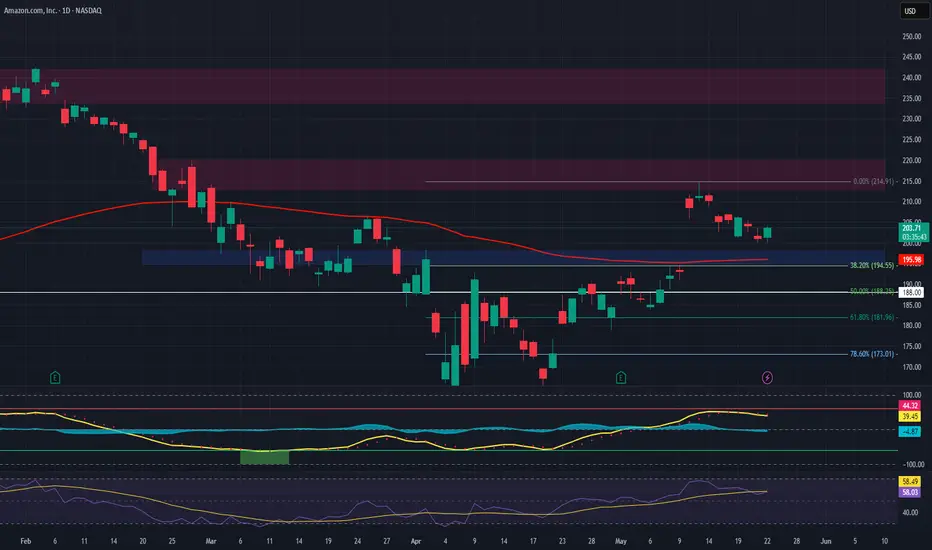
Amazon on shot high selling pressureThe chart depicts the weekly price movement of Amazon (AMZN) stock from 2022 to mid-2025, with a focus on a recent period around June 2025. Here’s an analysis based on the provided chart:
Historical Trend: The stock experienced a significant upward trend from 2022 to mid-2024, showing consistent gr

AMZN – Long Spot Trade Setup at Key SupportAmazon NASDAQ:AMZN is currently retracing into a major support level near $195, offering a solid long opportunity as broader market momentum holds up. This level has previously acted as a strong base, and price could now be positioning for a bullish continuation.
🔹 Entry Zone:
Around $195 (major
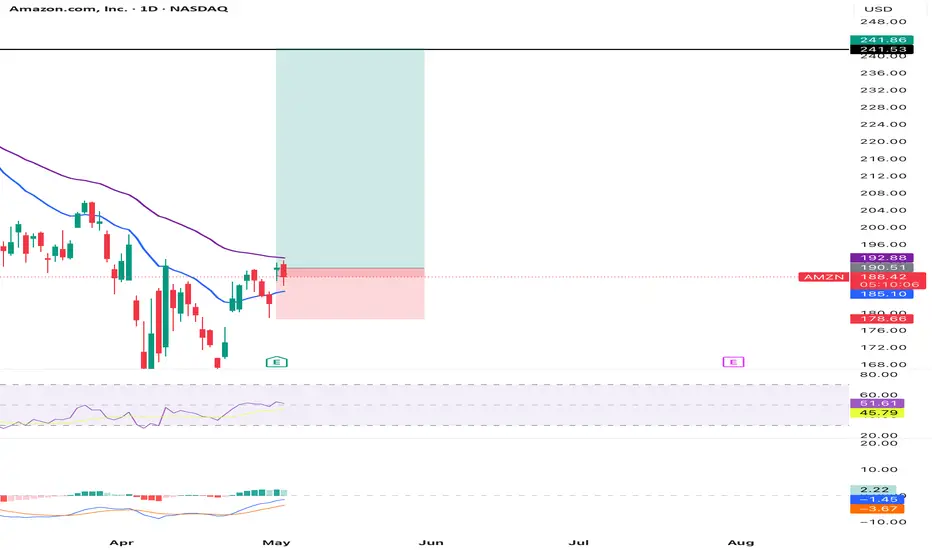
Amazon (AMZN) Swing Trade Analysis## Amazon (AMZN) Swing Trade Analysis
**Timeframe: 4H Chart (as per your screenshot, May 2, 2025)**
---
### **Technical Overview**
#### **1. Price Structure**
- **Trend:** The chart shows a recent reversal from a downtrend, with price making higher lows and attempting to break resistance around
Amazon analysisAccording to chart pattern, Amazon could face a downfall as other companies doing well in field of AI. Yet, Amazon didn't announce anything about AI project and not developing infrastructure for the same.

$AMZN - Possible Inverse Head & Shoulders NASDAQ:AMZN - Possible Inverse Head & Shoulders - Measured Move $225 which lines up with 200 SMA (yellow line). Let's see if we can get a breakout.

$AMZN Forming a Bullish Hammer Candle and Oversold on the DailyNASDAQ:AMZN forming a Bullish Hammer candle on the Daily and oversold right. It's right under 100 SMA (white line) let's see if we can get a bounce here and break back above. I was happy to see it finish the day green after being down 2% on the day.

$AMZN is oversold on the daily The past few times NASDAQ:AMZN has been oversold on the daily have proven to be great entry points. We are close to a possible support line and could go even a little further to touch the 100 SMA (white line). I am starting to accumulate NASDAQ:AMZN shares as well as April 17 220 calls @ $7.95
I

See all ideas
Summarizing what the indicators are suggesting.
Neutral
SellBuy
Strong sellStrong buy
Strong sellSellNeutralBuyStrong buy
Neutral
SellBuy
Strong sellStrong buy
Strong sellSellNeutralBuyStrong buy
Neutral
SellBuy
Strong sellStrong buy
Strong sellSellNeutralBuyStrong buy
An aggregate view of professional's ratings.
Neutral
SellBuy
Strong sellStrong buy
Strong sellSellNeutralBuyStrong buy
Neutral
SellBuy
Strong sellStrong buy
Strong sellSellNeutralBuyStrong buy
Neutral
SellBuy
Strong sellStrong buy
Strong sellSellNeutralBuyStrong buy
Displays a symbol's price movements over previous years to identify recurring trends.
US23135CC8
Amazon.com, Inc. 3.25% 12-MAY-2061Yield to maturity
5.25%
Maturity date
May 12, 2061
US23135CK0
Amazon.com, Inc. 4.1% 13-APR-2062Yield to maturity
5.24%
Maturity date
Apr 13, 2062
US23135CJ3
Amazon.com, Inc. 3.95% 13-APR-2052Yield to maturity
5.21%
Maturity date
Apr 13, 2052
AMZN4531868
Amazon.com, Inc. 4.25% 22-AUG-2057Yield to maturity
5.20%
Maturity date
Aug 22, 2057
US23135BT2
Amazon.com, Inc. 2.5% 03-JUN-2050Yield to maturity
5.18%
Maturity date
Jun 3, 2050
AMZN5182959
Amazon.com, Inc. 3.1% 12-MAY-2051Yield to maturity
5.18%
Maturity date
May 12, 2051
AMZN4996701
Amazon.com, Inc. 2.7% 03-JUN-2060Yield to maturity
5.17%
Maturity date
Jun 3, 2060
AMZN4531866
Amazon.com, Inc. 4.05% 22-AUG-2047Yield to maturity
5.13%
Maturity date
Aug 22, 2047
US23135AQ9
Amazon.com, Inc. 4.95% 05-DEC-2044Yield to maturity
4.95%
Maturity date
Dec 5, 2044
AMZN5182958
Amazon.com, Inc. 2.875% 12-MAY-2041Yield to maturity
4.92%
Maturity date
May 12, 2041
AMZN4531864
Amazon.com, Inc. 3.875% 22-AUG-2037Yield to maturity
4.58%
Maturity date
Aug 22, 2037
See all AMZ bonds
Curated watchlists where AMZ is featured.


Frequently Asked Questions
The current price of AMZ is 181.82 EUR — it has increased by 0.38% in the past 24 hours. Watch Amazon.com, Inc. stock price performance more closely on the chart.
Depending on the exchange, the stock ticker may vary. For instance, on SWB exchange Amazon.com, Inc. stocks are traded under the ticker AMZ.
AMZ stock has fallen by −6.67% compared to the previous week, the month change is a −6.81% fall, over the last year Amazon.com, Inc. has showed a 5.56% increase.
We've gathered analysts' opinions on Amazon.com, Inc. future price: according to them, AMZ price has a max estimate of 262.83 EUR and a min estimate of 197.55 EUR. Watch AMZ chart and read a more detailed Amazon.com, Inc. stock forecast: see what analysts think of Amazon.com, Inc. and suggest that you do with its stocks.
AMZ stock is 1.82% volatile and has beta coefficient of 1.30. Track Amazon.com, Inc. stock price on the chart and check out the list of the most volatile stocks — is Amazon.com, Inc. there?
Today Amazon.com, Inc. has the market capitalization of 1.96 T, it has increased by 1.17% over the last week.
Yes, you can track Amazon.com, Inc. financials in yearly and quarterly reports right on TradingView.
Amazon.com, Inc. is going to release the next earnings report on Oct 30, 2025. Keep track of upcoming events with our Earnings Calendar.
AMZ earnings for the last quarter are 1.43 EUR per share, whereas the estimation was 1.13 EUR resulting in a 26.44% surprise. The estimated earnings for the next quarter are 1.34 EUR per share. See more details about Amazon.com, Inc. earnings.
Amazon.com, Inc. revenue for the last quarter amounts to 142.36 B EUR, despite the estimated figure of 137.88 B EUR. In the next quarter, revenue is expected to reach 151.55 B EUR.
AMZ net income for the last quarter is 15.42 B EUR, while the quarter before that showed 15.83 B EUR of net income which accounts for −2.60% change. Track more Amazon.com, Inc. financial stats to get the full picture.
No, AMZ doesn't pay any dividends to its shareholders. But don't worry, we've prepared a list of high-dividend stocks for you.
As of Oct 17, 2025, the company has 1.56 M employees. See our rating of the largest employees — is Amazon.com, Inc. on this list?
EBITDA measures a company's operating performance, its growth signifies an improvement in the efficiency of a company. Amazon.com, Inc. EBITDA is 115.19 B EUR, and current EBITDA margin is 19.15%. See more stats in Amazon.com, Inc. financial statements.
Like other stocks, AMZ shares are traded on stock exchanges, e.g. Nasdaq, Nyse, Euronext, and the easiest way to buy them is through an online stock broker. To do this, you need to open an account and follow a broker's procedures, then start trading. You can trade Amazon.com, Inc. stock right from TradingView charts — choose your broker and connect to your account.
Investing in stocks requires a comprehensive research: you should carefully study all the available data, e.g. company's financials, related news, and its technical analysis. So Amazon.com, Inc. technincal analysis shows the sell today, and its 1 week rating is sell. Since market conditions are prone to changes, it's worth looking a bit further into the future — according to the 1 month rating Amazon.com, Inc. stock shows the buy signal. See more of Amazon.com, Inc. technicals for a more comprehensive analysis.
If you're still not sure, try looking for inspiration in our curated watchlists.
If you're still not sure, try looking for inspiration in our curated watchlists.