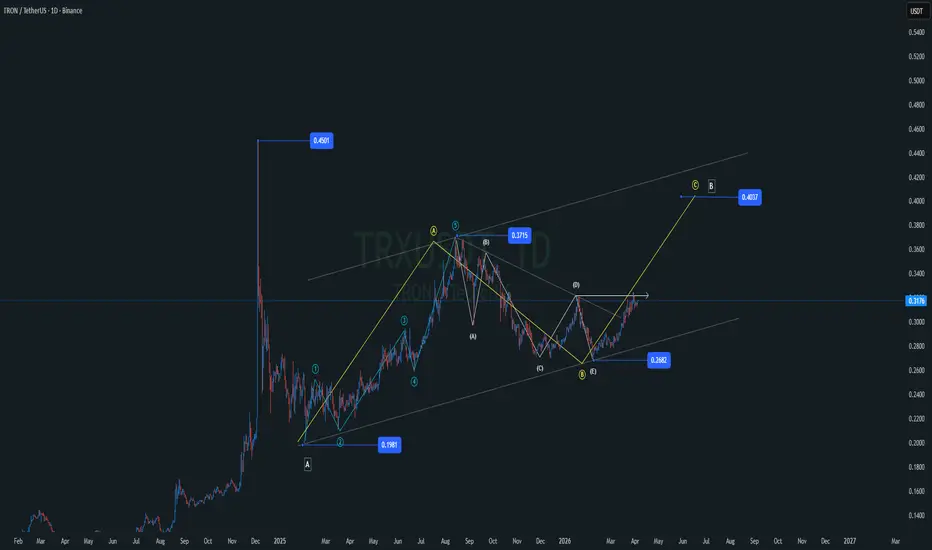
Tron TRXUSDTWave A correction from 0.19 to 0.35 Then B, maybe stop at 0.26 I expect a C wave of ABC, go to 0.4 Waiting for a pullback entry.Longby f2high1
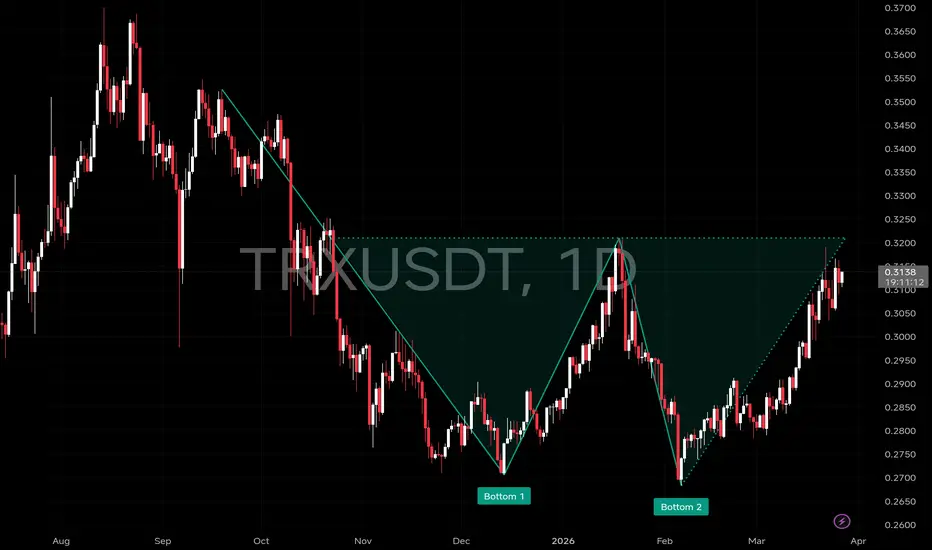
$TRX forming a double bottom pattern on 1 Day Chart AMEX:TRX is now sitting at a critical breakout zone after forming a clean double bottom structure on the daily timeframe. This isn’t just another setup — this is a high-pressure decision point. Price has already formed Bottom 1 and Bottom 2, and now it’s pushing toward the major resistance zone around 0.32. Right now, #TRX is slightly below this level (~0.313), showing strength but still lacking confirmation. This is the last chance zone before expansion. If bulls manage to break and sustainLongby CryptoSatRed1
$TRX is currently trading inside a rising wedge on the 12H chartAMEX:TRX is currently trading inside a rising wedge on the 12H timeframe, with price sitting around 0.289–0.290 after another rejection near the upper wedge resistance around 0.291–0.292. Price attempted to break the upper wedge, but the breakout failed and sellers immediately pushed it back inside the structure. This type of rejection often leads to a rotation toward the lower boundary of the wedge. Right now, momentum is slightly weakening after the rejection, which increases the probabilitShortby CryptoSatRed1
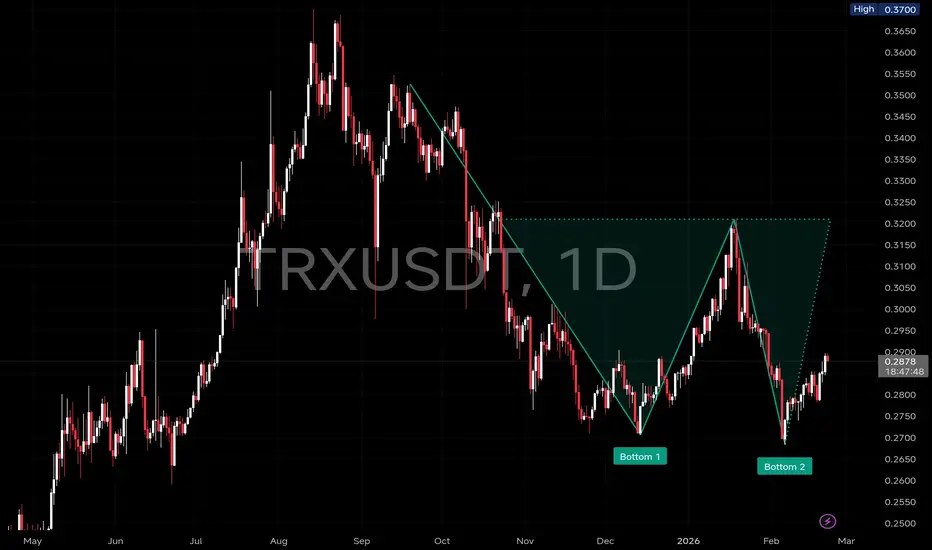
$TRX 1 Day Chart Outlook AMEX:TRX is shaping a potential double bottom structure on the daily timeframe after a prolonged correction from the 0.37 highs. Price is currently trading around 0.288, attempting to reclaim momentum after defending the 0.27–0.275 region twice. The neckline zone sits around 0.321 . That level rejected the last bounce and remains the key barrier. A daily close and acceptance above 0.321 would confirm strength and open room toward 0.34, followed by 0.36–0.37 if continuation builds. As long as Longby CryptoSatRed1
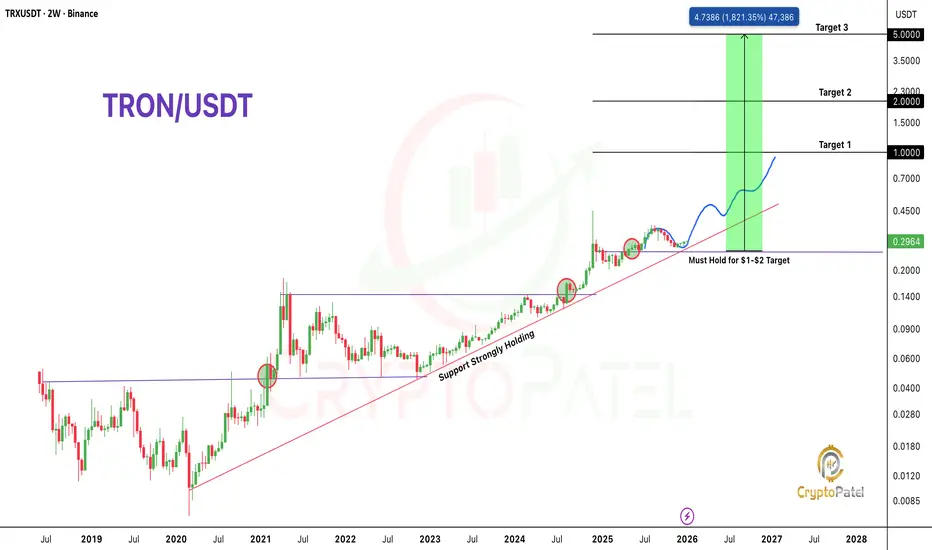
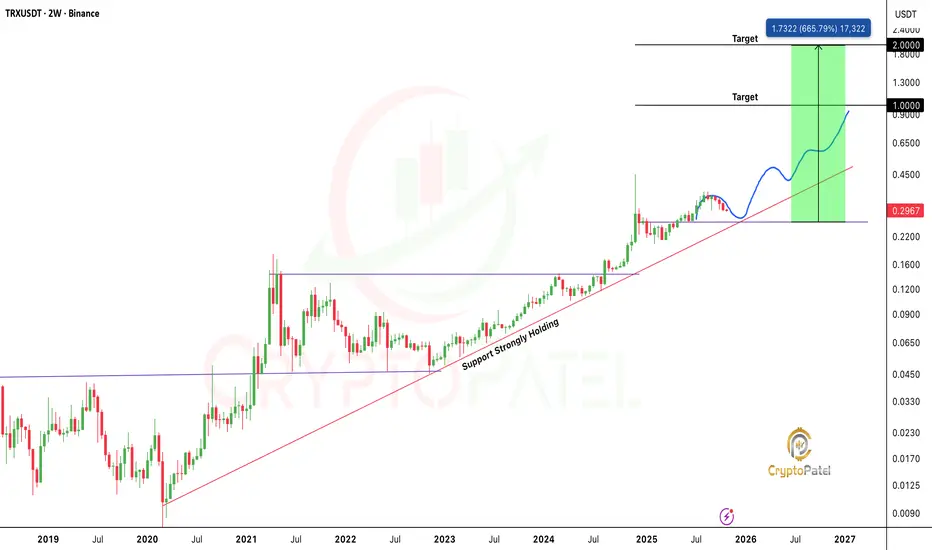
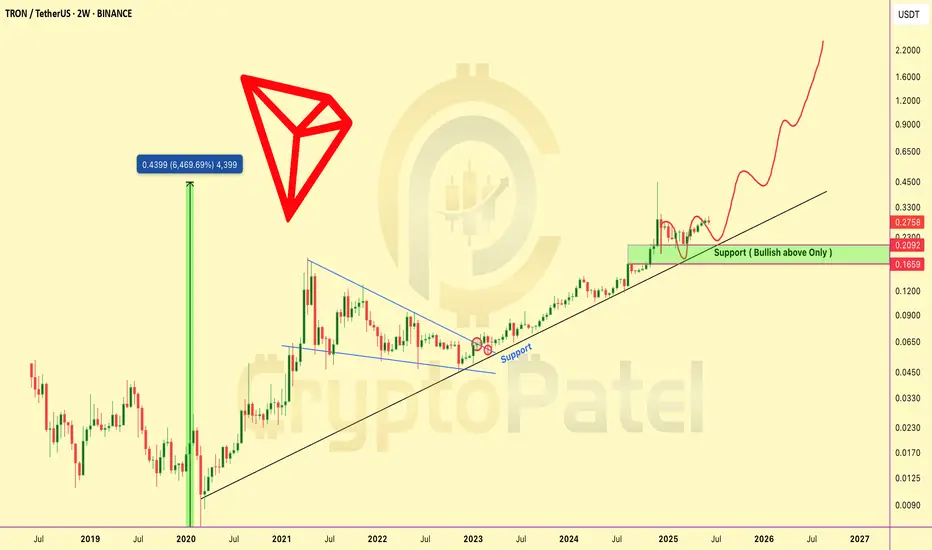
$TRX PRICE FORECAST | IS $5 POSSIBLE? | ANALYSIS BY CRYPTOPATELCRYPTOCAP:TRX PRICE FORECAST | IS $5 POSSIBLE? | ANALYSIS BY CRYPTOPATEL #TRX Is Quietly Building A Massive Multi-Year Base On The 2W Chart. Price Has Respected The Same Rising HTF Trendline Since 2020 — A Clear Sign Of Long-Term Strength. Technical Highlights: ✅ Clean Higher Highs & Higher Lows ✅ Multi-Year Ascending HTF Trendline Holding ✅ Strong HTF Demand Zone Holding At ~$0.25 ✅ Extended Consolidation → Expansion Setup ✅ Macro Trend Bias Remains Bullish CryptoPatel Targets: $1 → $2 → $5Longby CryptoPatel158
Will TRON hit $2 in this bull run?If CRYPTOCAP:TRX loses $0.26 I'm deleting this tweet. If it holds? We're going to $2 💎 Currently: $0.26 ✅ Target: $2.00 🔜 Upside: 600% Bulls in full control and NOT losing this level 💪 Screenshot this tweet NFA & DYORLongby CryptoPatel4
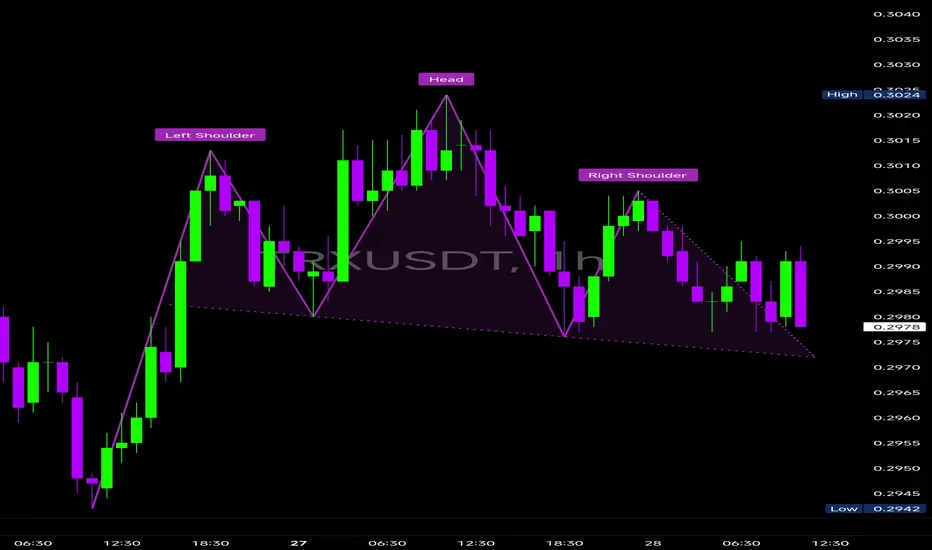
$TRX is forming a classic Head & Shoulders pattern on the 1-hourCRYPTOCAP:TRX is forming a classic Head & Shoulders pattern on the 1-hour timeframe — a structure often hinting at a trend reversal from bullish to bearish momentum. 🔹Left Shoulder: Formed near 0.3005, showing the first local top. 🔸Head: Peaked around 0.3030, marking the highest point of the current uptrend. 🔹Right Shoulder: Developed at 0.3000, slightly lower, confirming momentum loss. 🔸Neckline: Around 0.2970–0.2980, acting as the critical support and trigger zone. If the neckline breaksby CryptoSatRed0
TRON $TRX WILL BOUNCE BACK HARDCRYPTOCAP:TRX 💰4H Analysis Right now, the price is testing a buy zone around $0.2926–$0.2982. If there’s a quick bounce from this area, it could be a good spot to open long positions 🐬. The main idea is to catch the reversal and target a move back up to the highlighted POI zone. 🚀Long targets: $0.3135, $0.3250, $0.3330 for Scalping.Longby HyBlockCap0
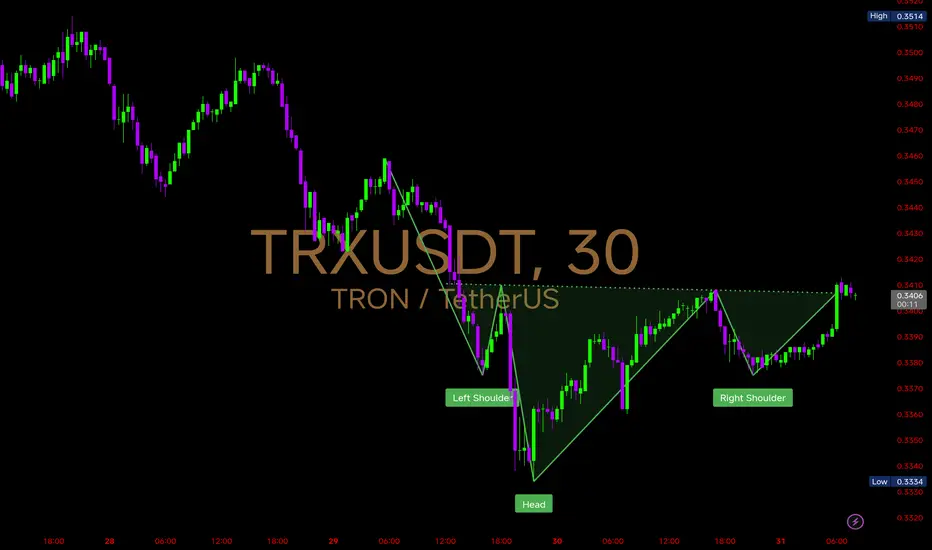
$TRX on the 30mins chart has formed a Inverse Head & Shoulders AMEX:TRX on the 30mins chart has formed a clear Inverse Head & Shoulders pattern ✅ 🔹 Left Shoulder – 0.338 🔹 Head – 0.333 🔹 Right Shoulder – 0.337 🔹 Breakout neckline – around 0.341 ✅ If price sustains above the neckline (0.341), momentum could push #TRX toward 0.345 → 0.351 → 0.360 in short-term. ⚠️ If it fails to hold, we may retest supports at 0.337 → 0.333. Inverse H&S is typically a bullish reversal pattern, so watch for volume confirmation — if buyers step in, price could deliver a stby CryptoSatRed1
Will TRON hit $1 Club?TRON rise has been nothing short of epic. From $0.0068 at launch to $0.36 today, over 50x growth. $1 isn’t a dream anymore… it’s getting closer every day. Who’s ready for CRYPTOCAP:TRX to crash into the $1 club? 🚀 NFA & DYORLongby CryptoPatel1
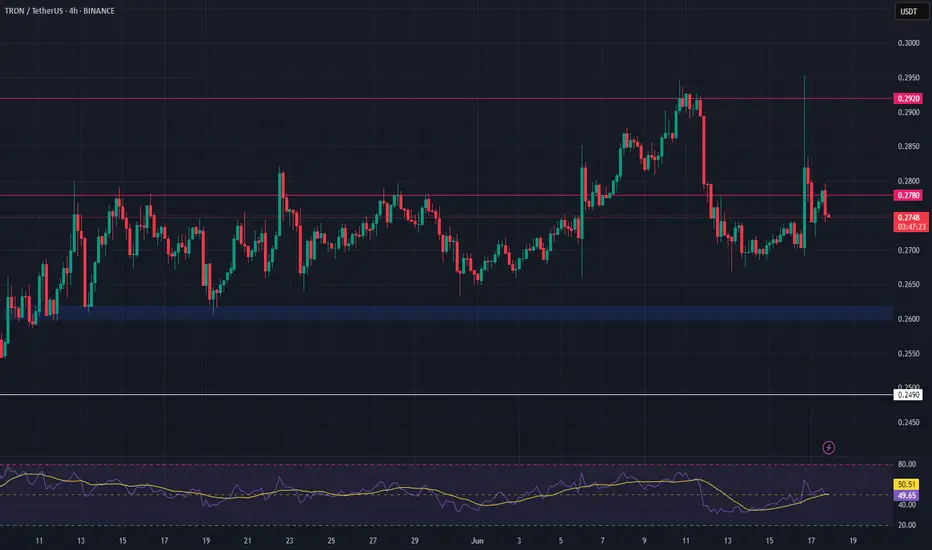
TRX Long Swing Setup – Waiting for Pullback After Bullish RallyTRX has seen a strong rally over the past few days, and we’re now watching for a retracement into support. The $0.260–$0.262 zone offers a potential long spot entry as price cools off. 📌 Trade Setup: • Entry Zone: $0.260 – $0.262 • Take Profit Targets: o 🥇 $0.278 o 🥈 $0.292 • Stop Loss: Daily close below $0.249Longby Richtv_official2
TRX NEXT EXPLOSION INCOMING? TRX NEXT EXPLOSION INCOMING? TRX is showing a strong bullish setup after breaking out of a long-term consolidation pattern. 🔹 Price has cleanly broken out of a multi-year descending structure 🔹 Retested the key support zone around $0.21–$0.23 🔹 Still respecting the long-term ascending trendline from 2020 🔹 Historical move: 6,469% rally in the previous cycle — current structure suggests similar potential Key Technical Levels to Watch: 🟩 Support Zone: $0.209–$0.230 🟩 As long as TRX holds above tLongby CryptoPatel1
#TRON to $1? Highly Possible! But Gold Entry is Key #TRON to $1? Highly Possible! But Gold Entry is Key 🚀 📉 Best Accumulation Zone for CRYPTOCAP:TRX : $0.140 - $0.10 🏆 Patience & Strategy Win the Game! NFA. DYOR! CRYPTOCAP:TRX #Altcoins Longby CryptoPatel2
$TRX hit our 200% target as predicted! 🚀 CRYPTOCAP:TRX hit our 200% target as predicted! Tron is showing strong momentum, and I still believe $1 is possible this bull run! 📉 Best buy zone: $0.180 - $0.160 (if we get it). Who’s holding TRX to $1? RT & Like if you’re bullish! 🔄 Longby CryptoPatel4
Trx offering good opportunity to grab.Tron chart showing clear breakdown in 4hr candle and have a 10% upside potential.Longby Cashkhabar01
CATEGORY - TRUMP TEAM TOKENS - TRX ! 1. After the pump to new all-time highs (0.45), there was a 50% pullback, which eliminated even leveraged positions with 2 leverage! 2. The range of 0.22 - 0.29 was formed, where within this range, the buyer's defensive reaction to the level of 0.22 was obtained 2 times. 3. A clear volume pattern (marked with a red arc) on the OBV chart shows the dominance of buyers and the expectation of continued growth EXPECTATIONS: the best entry point was already on 20.01 at a price of about 0.23 and I mLongby LemonBrazers0
TRON bullish toward $0.5 ?#TRON is looking bullish! All resistance levels have been broken, and it's now heading toward $0.30-$0.50. I'm expecting a 200-300% upward move from here. Strong support at $0.140 Longby CryptoPatel3
TRX TronBINANCE:TRXUSDT BINANCE:TRXUSDT.P #TRX is in a cautious climb, sitting around 0.16006 after a recent pullback. The chart shows a steady upward trend with gradual gains, indicating that the bulls are testing the waters. There's a key zone between 0.16143 and 0.16483 that might act as a decision point. If the bulls push through with confidence, we could see an attempt toward 0.16837 and possibly higher. However, if it stalls here, we might see some consolidation or a retest of the support Longby hfwkjfhbwkjhfbu11
TRXUSDTWe can accumulate trx at current price for mention elliot waves, this is the second time i am posting trx chart. TRX is stil bullish for me. This crypto is sideways from a long time and form a descending triangle and as per Elliot wave analysis we can see a third wave in this crypto. I have mention two levels as per third wave analysis we can see a downfall from this two point the it will form a 4-5 wave . then it will go on let's see how it will perform Thanks ishu prajapatiLongby THINKLIKEATRADER2
TRON View!A well-known figure in the crypto industry, Justin Sun, founder of TRON TRXUSD and chief adviser to Huobi, opened up in an unusual post on social networks. In particular, he responded to rumors regarding his Bitcoin investments. Sun expressed confidence in Bitcoin's future but clarified that he did not take a long position at the $69,000 price level. I am very optimistic about the development of Bitcoin and have great confidence in its future. However, I would like to clarify that I did not Longby FXBANkthe805513
Justin Sun Reveals Gas-Free Stablecoin Transfers on TRON NetworkTRON founder Justin Sun announced that his team is developing a stablecoin solution to increase institutional adoption of such assets. On July 6, Sun revealed that a gas-free stablecoin solution will launch on the TRON network in the fourth quarter of this year. Gas-Free Stablecoin Solution Sun explained that this innovation means users will not need to pay a gas fee for stablecoin transactions. Instead, the stablecoins will cover the fees themselves. This solution will initially be availableby FXBANkthe80551
Will TRX Price Cross $0.5 Mark This Year?Tron has a market cap of $10 Billion and is ranked 16th in the cryptoverse. The VM ratio of the asset price is 0.02 with a drop of 7% in the volume. TRX is currently trading near the value of $0.11 with a drop of 0.14% in the intraday session. TRX token price is currently seeing a weak consolidation on the daily chart. It is trading below the 50 and 100 EMA with a negative crossover in the past. The upside trend of TRX price can see a halt near $0.2. Meanwhile the support price can be seen near by Ritika_TCR14
buythis is trading in oversold area and expecting a nice rally from current priceLongby Magesh1510-111

 Long