$XRP is currently sitting at the lower trendline support CRYPTOCAP:XRP is currently sitting at the lower trendline support of a falling wedge on the daily timeframe. This is a sensitive area where price usually decides between relief bounce or deeper continuation — and right now, pressure is clearly building.
The 1.71 level is the key line in the sand.
Related pairs

$XRP PRICE PREDICTION | MULTI-YEAR BREAKOUT TOWARD $10+?CRYPTOCAP:XRP is trading above a confirmed multi-year breakout zone on the higher timeframe after completing a long accumulation phase.
Price has already delivered a strong expansion move and is now building structure for the next leg higher.
TECHNICAL OVERVIEW (HTF):
✔ Descending Wedge Breakout

XRPUSDT – Bullish Outlook from CMPXRPUSDT is showing strong bullish structure from the current market price (CMP). Price has successfully held above the key support zone, indicating that buyers are actively defending lower levels. The recent consolidation near support suggests accumulation, not distribution.
Momentum indicators are

The $XRP has formed a clear double-bottom pattern The CRYPTOCAP:XRP has formed a clear double-bottom pattern following a prolonged intraday downtrend. The aggressive sell pressure has clearly slowed, and buyers are now defending the lows around 2.15–2.16, which is a positive shift in short-term structure.
This is no longer a panic zone — it’s a

$XRP has cleanly broken out from a double-bottom CRYPTOCAP:XRP has cleanly broken out from a double-bottom structure on the 15m chart, exactly the kind of reversal pattern traders wait for after a corrective phase. Price defended the same demand zone twice, sellers failed to push lower, and buyers finally stepped in with strength.
The breakout c

$XRP is trading inside a clear falling wedge on the 1H chartCRYPTOCAP:XRP is trading inside a clear falling wedge on the 1H chart, a structure that usually forms during corrective phases rather than full trend breakdowns. Price has been making lower highs and lower lows, but the range is tightening — signaling selling pressure is gradually fading.
The lowe

$XRP /USDT – Weekly Technical View (Short Analysis)#XRP has completed a strong impulsive move from long-term lows, topping near the 3.5–3.6 USDT resistance zone, which aligns with a major historical supply area. The rejection from this zone suggests a corrective phase is underway, forming a descending structure.
Price is currently hovering around 1

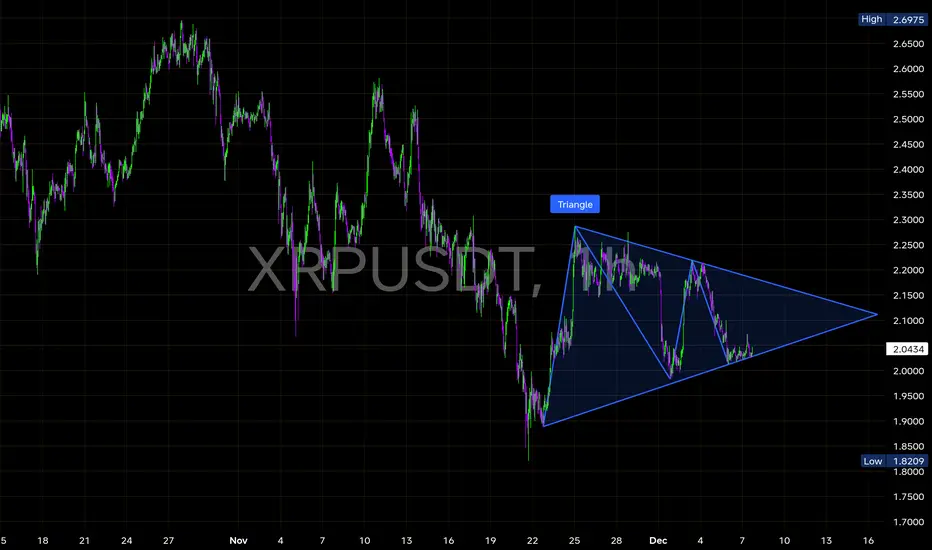
XRP is getting tighter in a big symmetrical triangleXRP is getting tighter in a big symmetrical triangle, bouncing between 2.04 support and the downward resistance line.This structure usually ends with a sharp breakout as volatility coils to its lowest point.
🔹Price is respecting the higher-low trendline, showing buyers still defending the structure
professional, price-action analysis of your XRP/USDT🔵 1. NO-TRADE ZONE
📍 2.018 – 2.088
(Your chart shows the dotted-line area + the nearest support & resistance)
Why this is a NO-TRADE Zone?
Price is in a sideways compression range.
Market is showing low momentum, lots of fake moves.
Best trades come after breakout + retest of this zone.
⚠️ Ins

XRPUSDT – 4H | Channel Rejection + Re-Test | High RR Long SetupXRP is respecting a long-term descending channel, and the recent price action shows a strong bullish reaction from the lower boundary of the channel. After sweeping liquidity at the lows, price has broken back above the inner trendline and is now retesting it as support.
🔍 Key Technical Points
Pri

See all ideas
Summarizing what the indicators are suggesting.
Oscillators
Neutral
SellBuy
Strong sellStrong buy
Strong sellSellNeutralBuyStrong buy
Oscillators
Neutral
SellBuy
Strong sellStrong buy
Strong sellSellNeutralBuyStrong buy
Summary
Neutral
SellBuy
Strong sellStrong buy
Strong sellSellNeutralBuyStrong buy
Summary
Neutral
SellBuy
Strong sellStrong buy
Strong sellSellNeutralBuyStrong buy
Summary
Neutral
SellBuy
Strong sellStrong buy
Strong sellSellNeutralBuyStrong buy
Moving Averages
Neutral
SellBuy
Strong sellStrong buy
Strong sellSellNeutralBuyStrong buy
Moving Averages
Neutral
SellBuy
Strong sellStrong buy
Strong sellSellNeutralBuyStrong buy
Displays a symbol's price movements over previous years to identify recurring trends.
Frequently Asked Questions
The current price of XRP / TetherUS (XRP) is 1.4429 USDT — it has risen 1.45% in the past 24 hours. Try placing this info into the context by checking out what coins are also gaining and losing at the moment and seeing XRP price chart.
XRP / TetherUS price has fallen by −8.76% over the last week, its month performance shows a −30.74% decrease, and as for the last year, XRP / TetherUS has decreased by −39.70%. See more dynamics on XRP price chart.
Keep track of coins' changes with our Crypto Coins Heatmap.
Keep track of coins' changes with our Crypto Coins Heatmap.
XRP / TetherUS (XRP) reached its highest price on Jul 18, 2025 — it amounted to 3.6607 USDT. Find more insights on the XRP price chart.
See the list of crypto gainers and choose what best fits your strategy.
See the list of crypto gainers and choose what best fits your strategy.
XRP / TetherUS (XRP) reached the lowest price of 0.1013 USDT on Mar 13, 2020. View more XRP / TetherUS dynamics on the price chart.
See the list of crypto losers to find unexpected opportunities.
See the list of crypto losers to find unexpected opportunities.
The safest choice when buying XRP is to go to a well-known crypto exchange. Some of the popular names are Binance, Coinbase, Kraken. But you'll have to find a reliable broker and create an account first. You can trade XRP right from TradingView charts — just choose a broker and connect to your account.
Crypto markets are famous for their volatility, so one should study all the available stats before adding crypto assets to their portfolio. Very often it's technical analysis that comes in handy. We prepared technical ratings for XRP / TetherUS (XRP): today its technical analysis shows the sell signal, and according to the 1 week rating XRP shows the sell signal. And you'd better dig deeper and study 1 month rating too — it's sell. Find inspiration in XRP / TetherUS trading ideas and keep track of what's moving crypto markets with our crypto news feed.
XRP / TetherUS (XRP) is just as reliable as any other crypto asset — this corner of the world market is highly volatile. Today, for instance, XRP / TetherUS is estimated as 1.75% volatile. The only thing it means is that you must prepare and examine all available information before making a decision. And if you're not sure about XRP / TetherUS, you can find more inspiration in our curated watchlists.
You can discuss XRP / TetherUS (XRP) with other users in our public chats, Minds or in the comments to Ideas.