XRP Breaks Above $3 – Bullish Momentum BuildsOverview:
XRP has officially closed the week above the $3 mark, a psychological resistance now turning into support. This is a major technical shift suggesting renewed bullish control.
🔑 Key Levels to Watch:
Support: $3.00
Short-Term Target: $3.20
Major Resistance / Magnet: $3.60 (All-Time High)
Related pairs

XRP Price Action – Accumulation Before GrowthXRP is currently navigating a phase defined by liquidity-driven swings and rapid sentiment shifts. After the market endured a heavy decline, buyers have re-emerged, showing resilience through aggressive rebounds. This behavior reflects a deeper pattern: sellers are losing efficiency in driving the m

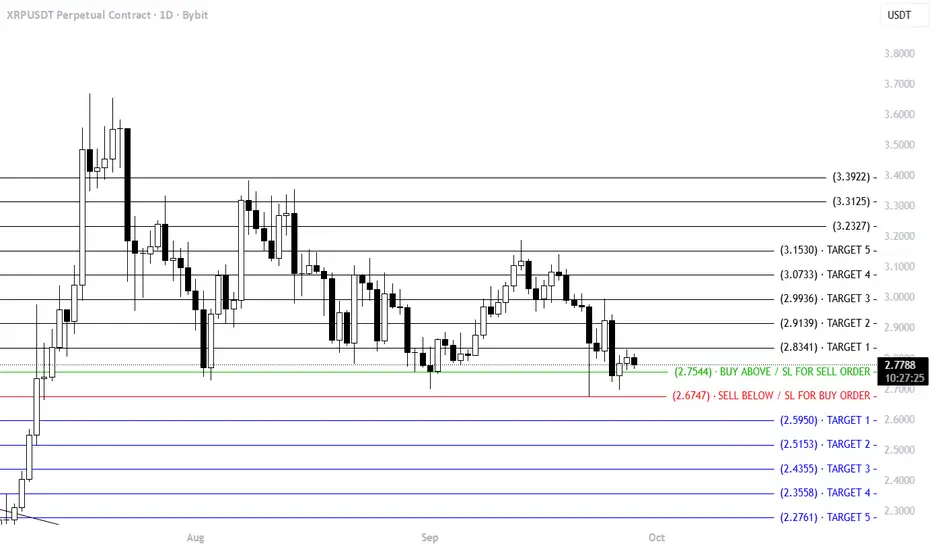
Trading Levels for XRPUSDTrading Levels for XRPUSD
Anyone can Trade on both sides (as per levels
Levels shared on chart
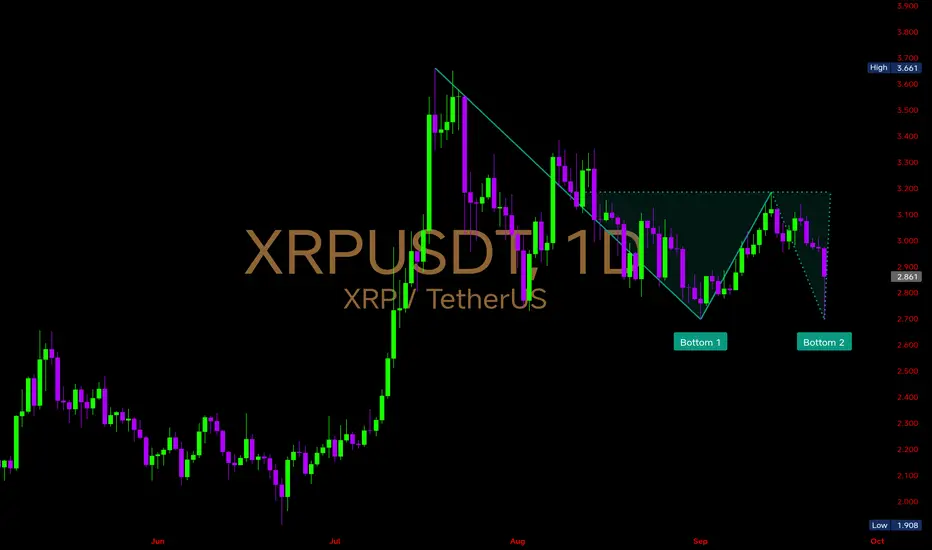
$XRP is showing a double bottom setup on the daily chartCRYPTOCAP:XRP is showing a double bottom setup on the daily chart, with price retesting the key support at 2.70.
⚡ If Bulls Defend 2.70:
Momentum could ignite a breakout above 3.20, opening the path toward 3.30 → 3.50 → 3.66 and confirming a strong reversal pattern.
⚠️ If Bears Take Over:
A break
XRPUSDT Buying ViewXRPUSDT – Buying View 📈
Price is consolidating near support around 3.03 – 3.02, showing signs of accumulation.
A breakout from this zone is expected to push price toward the next resistance at 3.067 – 3.07.
Entry: 3.03 – 3.035
Target: 3.067 – 3.07
Stop Loss: 3.025 (below support)

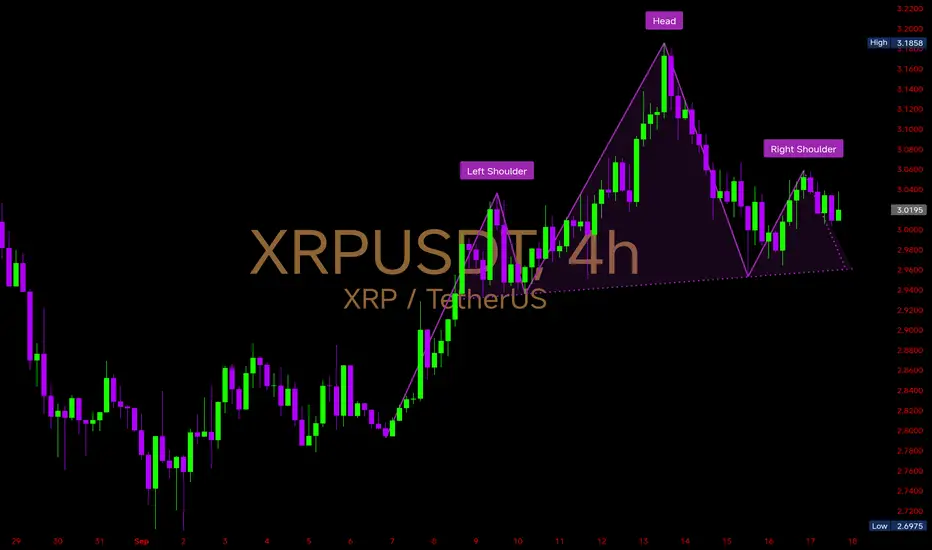
$XRP is currently forming a Head & Shoulders pattern on the 4Hr CRYPTOCAP:XRP is currently forming a Head & Shoulders pattern on the 4Hr timeframe — a structure often viewed as a trend reversal signal.
🔹 Immediate Levels to Watch
Resistance: $3.06 (short-term barrier)
Major Resistance: $3.18 (head top, key rejection point)
Support Zone: $2.95 – $3.00 (neckl
XRP/USDT – Buy Setup on 15-Min ChartXRP is currently consolidating near 2.99 and respecting key support levels. The price action has formed a range and is now showing signs of accumulation.
📌 Entry: 2.9962 (CMP)
🎯 Target: 3.0582
🛑 Stop Loss: 2.9463
🔎 Analysis:
Price is trading inside a well-defined range with higher lows forming.

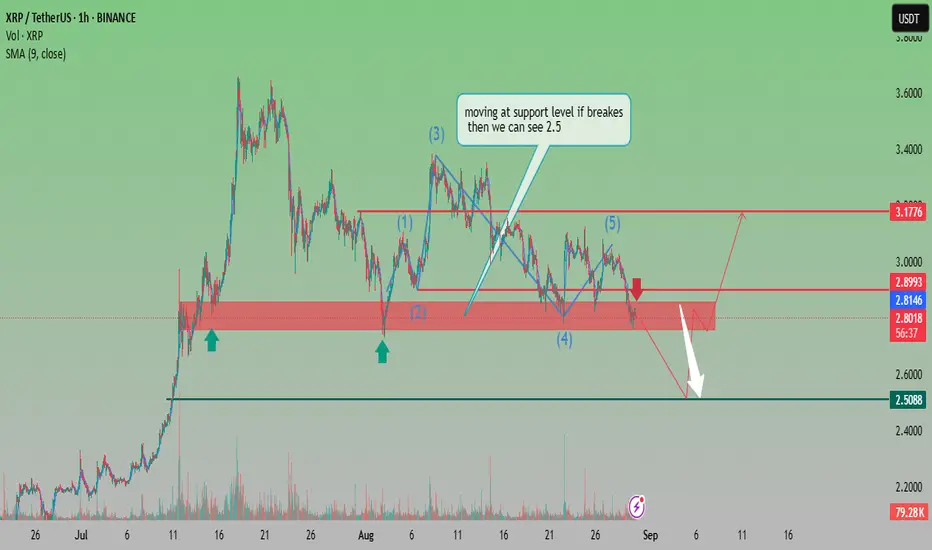
XRP Testing Key Support Zone – Potential Drop Toward $2.50 if ?Analysis:
XRP is currently trading around $2.80, right at a critical support level. The chart highlights a 5-wave Elliott structure, with the recent wave (5) completing near resistance. Price action is now consolidating in a key demand zone around $2.80 – $2.90.
If the support holds, we could see a
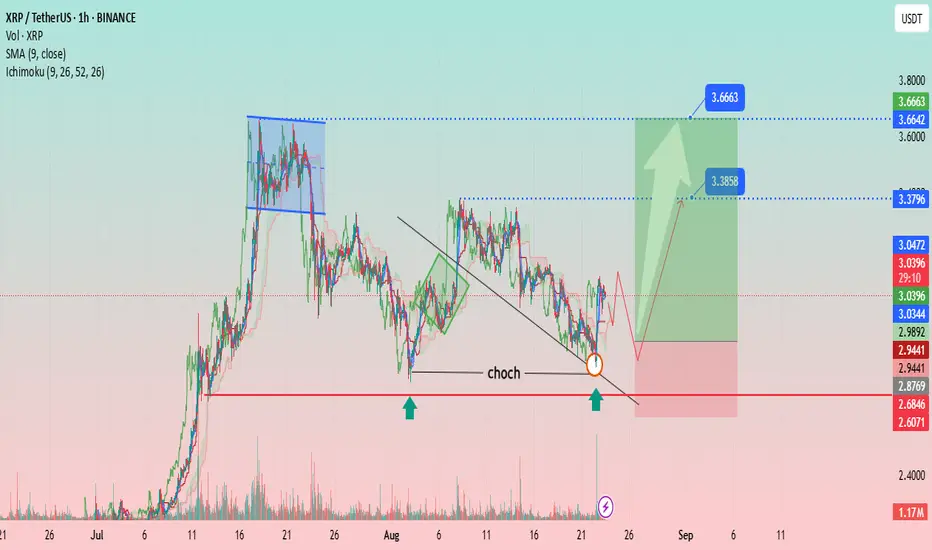
XRP/USDT – Bullish Reversal Setup After CHoCH BreakoutAnalysis:
The chart shows XRP/USDT (1H timeframe) developing a bullish structure after a Change of Character (CHoCH) confirmation near the $2.94 support zone. Price respected the key demand area (highlighted by green arrows) and broke above the descending trendline, signaling potential reversal mom
$XRP – Inverse Head & Shoulders CRYPTOCAP:XRP – Inverse Head & Shoulders
Price is trading at $3.07 after bouncing from $2.66 (recent low).
The 4Hr chart is forming a classic Inverse Head & Shoulders pattern → a strong bullish reversal setup.
🔹 Inverse H&S often signals a trend reversal from bearish to bullish.
🔹Price is sta

See all ideas
Summarizing what the indicators are suggesting.
Oscillators
Neutral
SellBuy
Strong sellStrong buy
Strong sellSellNeutralBuyStrong buy
Oscillators
Neutral
SellBuy
Strong sellStrong buy
Strong sellSellNeutralBuyStrong buy
Summary
Neutral
SellBuy
Strong sellStrong buy
Strong sellSellNeutralBuyStrong buy
Summary
Neutral
SellBuy
Strong sellStrong buy
Strong sellSellNeutralBuyStrong buy
Summary
Neutral
SellBuy
Strong sellStrong buy
Strong sellSellNeutralBuyStrong buy
Moving Averages
Neutral
SellBuy
Strong sellStrong buy
Strong sellSellNeutralBuyStrong buy
Moving Averages
Neutral
SellBuy
Strong sellStrong buy
Strong sellSellNeutralBuyStrong buy
Displays a symbol's price movements over previous years to identify recurring trends.
Frequently Asked Questions
The current price of XRP / UST (XRP) is 2.39090000 USDT — it hasn't changed in the past 24 hours. Try placing this info into the context by checking out what coins are also gaining and losing at the moment and seeing XRP price chart.
XRP / UST price has fallen by −22.12% over the last week, its month performance shows a −20.63% decrease, and as for the last year, XRP / UST has increased by 350.80%. See more dynamics on XRP price chart.
Keep track of coins' changes with our Crypto Coins Heatmap.
Keep track of coins' changes with our Crypto Coins Heatmap.
XRP / UST (XRP) reached its highest price on Jul 18, 2025 — it amounted to 3.65930000 USDT. Find more insights on the XRP price chart.
See the list of crypto gainers and choose what best fits your strategy.
See the list of crypto gainers and choose what best fits your strategy.
XRP / UST (XRP) reached the lowest price of 0.17400000 USDT on Dec 29, 2020. View more XRP / UST dynamics on the price chart.
See the list of crypto losers to find unexpected opportunities.
See the list of crypto losers to find unexpected opportunities.
The safest choice when buying XRP is to go to a well-known crypto exchange. Some of the popular names are Binance, Coinbase, Kraken. But you'll have to find a reliable broker and create an account first. You can trade XRP right from TradingView charts — just choose a broker and connect to your account.
Crypto markets are famous for their volatility, so one should study all the available stats before adding crypto assets to their portfolio. Very often it's technical analysis that comes in handy. We prepared technical ratings for XRP / UST (XRP): today its technical analysis shows the strong sell signal, and according to the 1 week rating XRP shows the sell signal. And you'd better dig deeper and study 1 month rating too — it's buy. Find inspiration in XRP / UST trading ideas and keep track of what's moving crypto markets with our crypto news feed.
XRP / UST (XRP) is just as reliable as any other crypto asset — this corner of the world market is highly volatile. Today, for instance, XRP / UST is estimated as 8.41% volatile. The only thing it means is that you must prepare and examine all available information before making a decision. And if you're not sure about XRP / UST, you can find more inspiration in our curated watchlists.
You can discuss XRP / UST (XRP) with other users in our public chats, Minds or in the comments to Ideas.