One of the most decisive factors for markets right now is the expansion of liquidity. The growth of global M2 remains evident, particularly in China, where the economy faces a deflationary backdrop that forces authorities to maintain – and even expand – both monetary and fiscal stimulus. Ultimately, these flows permeate global financial markets and, as I’ve explained on several occasions, liquidity is the fuel that drives asset prices.
A Parallel with 2024
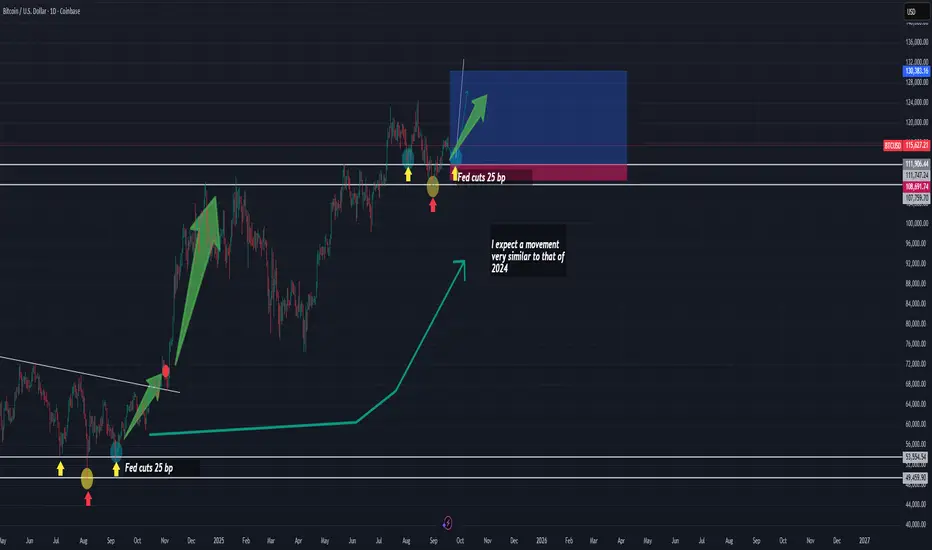
What we are observing today shows remarkable similarities with what happened in 2024. Back then, the start of Federal Reserve rate cuts marked a turning point. Even a moderate 25-basis-point cut triggered a rebound that coincided with a technical consolidation phase in Bitcoin, shaped as a descending channel.
Later, in November 2024, when the Fed accelerated the move with a 50-basis-point cut, the result was a much more aggressive bullish impulse.
Today, we find ourselves in an environment with rising probabilities of further cuts in upcoming Fed meetings, which could once again act as a catalyst.
Correlation Context with the Nasdaq 100
Meanwhile, the Nasdaq 100 is printing all-time highs, reflecting the strong risk appetite in tech assets. Bitcoin, in contrast, remains slightly behind its own highs. This divergence can be interpreted as a window of opportunity: if additional liquidity is confirmed through another rate cut, the momentum could spill over into Bitcoin and provide the strength needed to form a technical reversal structure—very similar to the inverted Head and Shoulders (H&S) pattern observed in 2024.
Trading Strategy
Entry Zone: 111,906.44
Stop Loss (SL): 108,607.83
Take Profit (TP): 130,383.16
A Parallel with 2024
What we are observing today shows remarkable similarities with what happened in 2024. Back then, the start of Federal Reserve rate cuts marked a turning point. Even a moderate 25-basis-point cut triggered a rebound that coincided with a technical consolidation phase in Bitcoin, shaped as a descending channel.
Later, in November 2024, when the Fed accelerated the move with a 50-basis-point cut, the result was a much more aggressive bullish impulse.
Today, we find ourselves in an environment with rising probabilities of further cuts in upcoming Fed meetings, which could once again act as a catalyst.
Correlation Context with the Nasdaq 100
Meanwhile, the Nasdaq 100 is printing all-time highs, reflecting the strong risk appetite in tech assets. Bitcoin, in contrast, remains slightly behind its own highs. This divergence can be interpreted as a window of opportunity: if additional liquidity is confirmed through another rate cut, the momentum could spill over into Bitcoin and provide the strength needed to form a technical reversal structure—very similar to the inverted Head and Shoulders (H&S) pattern observed in 2024.
Trading Strategy
Entry Zone: 111,906.44
Stop Loss (SL): 108,607.83
Take Profit (TP): 130,383.16
Disclaimer
The information and publications are not meant to be, and do not constitute, financial, investment, trading, or other types of advice or recommendations supplied or endorsed by TradingView. Read more in the Terms of Use.
Disclaimer
The information and publications are not meant to be, and do not constitute, financial, investment, trading, or other types of advice or recommendations supplied or endorsed by TradingView. Read more in the Terms of Use.