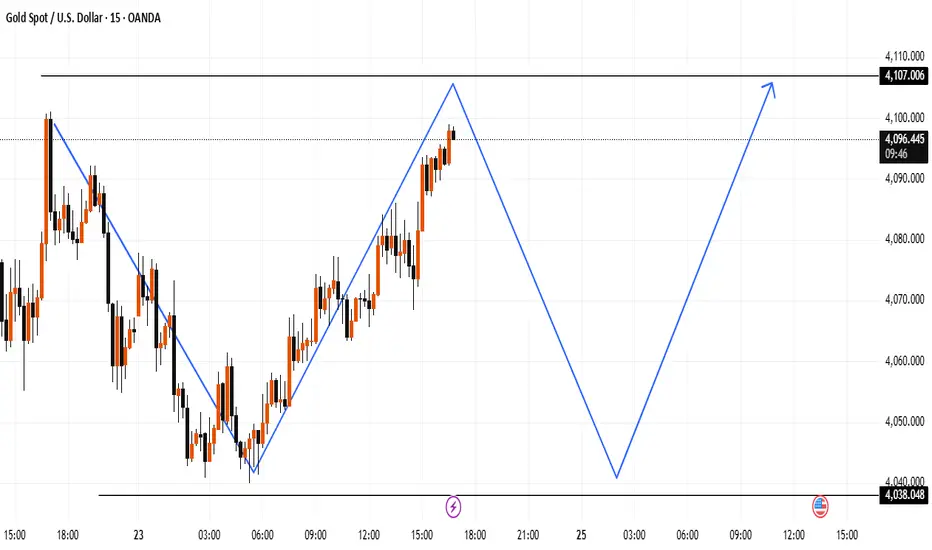
This chart highlights a possible short-term completion of the current upward leg, followed by a deeper corrective move toward the lower support zone near 4038, before a potential bullish continuation toward the 4107 area.
The projection is based on simple market structure:
Price has reached a previous reaction zone.
A corrective wave may form if rejection appears.
A new impulse could develop from the lower support level.
The projection is based on simple market structure:
Price has reached a previous reaction zone.
A corrective wave may form if rejection appears.
A new impulse could develop from the lower support level.
Trade active
its time to trade activeDisclaimer
The information and publications are not meant to be, and do not constitute, financial, investment, trading, or other types of advice or recommendations supplied or endorsed by TradingView. Read more in the Terms of Use.
Disclaimer
The information and publications are not meant to be, and do not constitute, financial, investment, trading, or other types of advice or recommendations supplied or endorsed by TradingView. Read more in the Terms of Use.