Analysis:
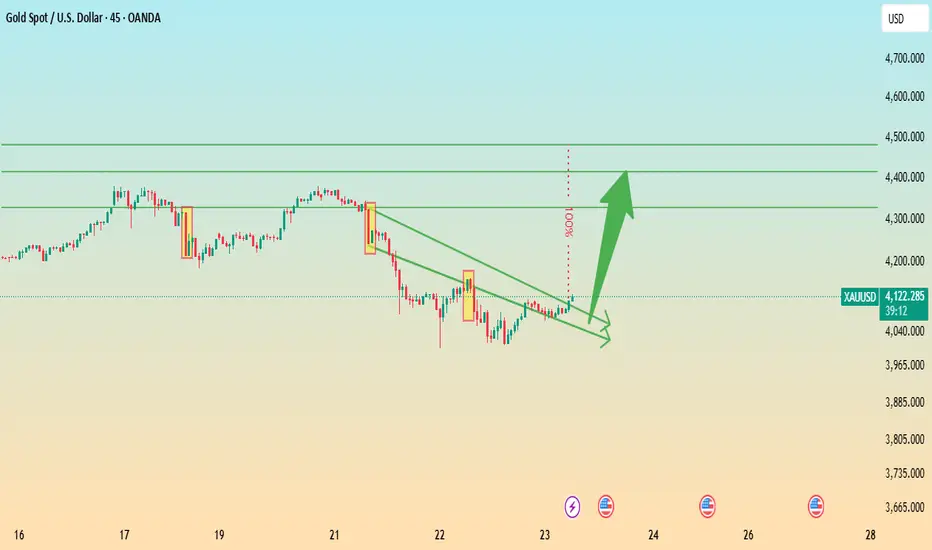
The XAU/USD (Gold vs. USD) chart on the 45-minute timeframe shows price action forming a descending wedge pattern, a typically bullish reversal formation. The price has been compressing between lower highs and lower lows but is now testing the upper trendline resistance, indicating a possible breakout.
Key observations:
Trendline Breakout Zone: The narrowing wedge suggests weakening bearish momentum. A confirmed breakout above the trendline could trigger strong upward momentum.
Targets: The projected upside targets are around 4,300, 4,400, and 4,500, aligning with previous resistance zones.
Support Zone: Immediate support remains near 4,050–4,000, where the lower wedge boundary provides buying interest.
Momentum Indicator: Gradual bullish recovery and decreasing downside pressure indicate renewed buyer strength.
Join My telegram channel Free:
t.me/tradewithmrdavid
💎
VIP Channels:
Forex:+400Pips & Crypto +420% monthly profit at VIP.
check pinned message in telegram for more information.
t.me/tradewithmrdavid
💎
VIP Channels:
Forex:+400Pips & Crypto +420% monthly profit at VIP.
check pinned message in telegram for more information.
Disclaimer
The information and publications are not meant to be, and do not constitute, financial, investment, trading, or other types of advice or recommendations supplied or endorsed by TradingView. Read more in the Terms of Use.