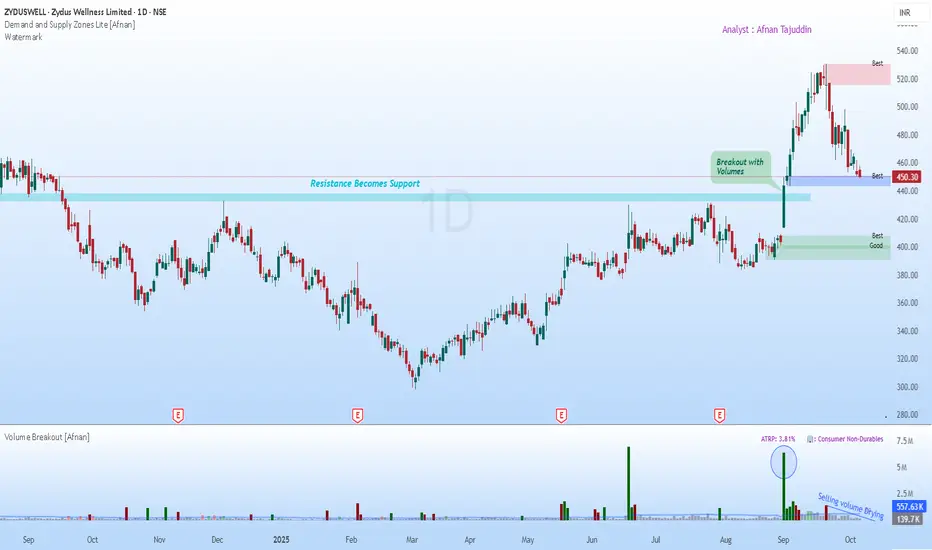
Powerful Setup & Art of the Pullback: Supply & Demand Concept📊 Supply & Demand View 📊
When you look closely, supply and demand zones are essentially the fingerprints of institutional activity. Big players rarely dump or buy entire positions in one shot—they stagger their trades, leaving behind identifiable imbalances on the charts. Every time price revisits
Explore the community
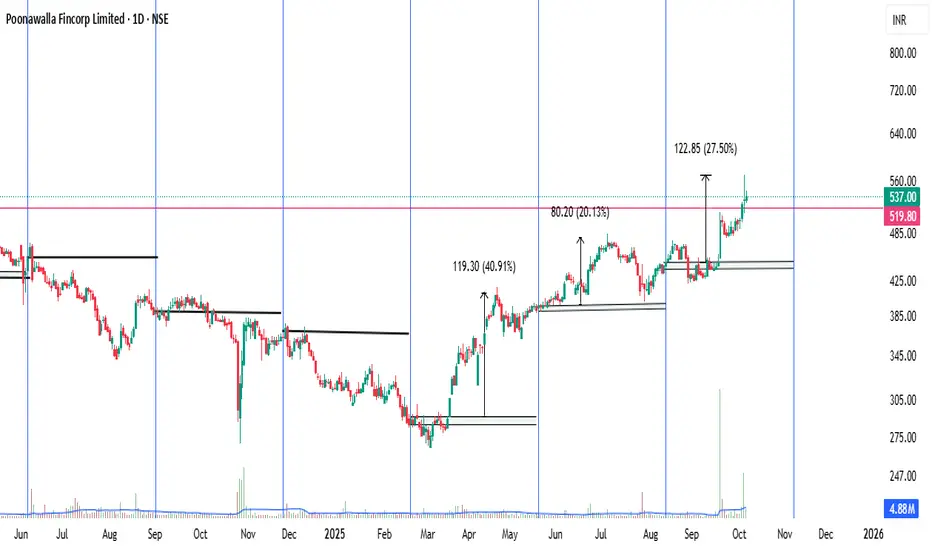
Poonawalla Fincorp (POONAWALLA)Poonawalla Fincorp Limited (NSE: POONAWALLA), a non-banking financial company (NBFC) under the Cyrus Poonawalla Group, focuses on consumer and MSME lending, including personal loans, vehicle finance, and supply chain financing. As of October 7, 2025, the stock trades around ₹565, up ~8% in the last
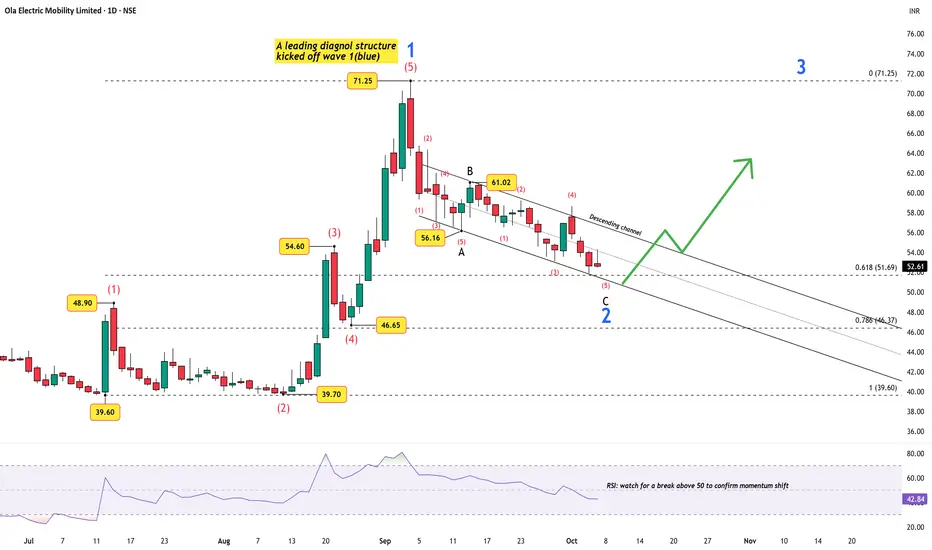
Charging Up for Wave 3 — Ola’s Motor Just Got Certified!The electric vehicle (EV) space in India is heating up again — and Ola Electric seems to be quietly positioning itself for the next leg of growth. The company’s recent government certification for its in-house ferrite motor marks an important milestone: a domestically designed motor that avoids co
ETHUSD: Where Price Could Go?4h tf
ETHUSD has bounced back strongly from around $3,826 after completing an A-B-C wave pattern. Right now, the price is testing resistance near $4,756. It could drop a little to around $4,440 before moving higher again. If the uptrend continues, the next target levels are $4,955, $5,300, and $5,5

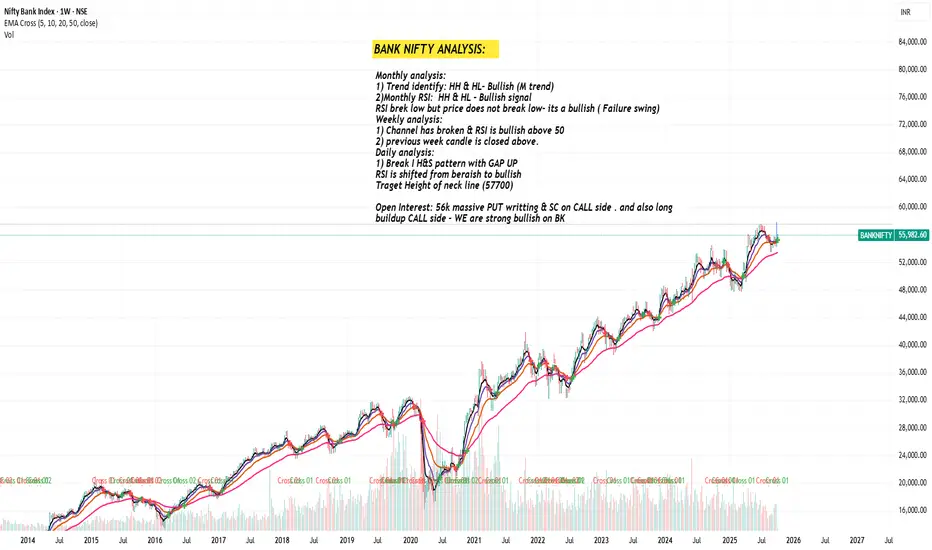
BANK NIFTY ANALYSIS: Strong BullishMonthly analysis:
1) Trend identify: HH & HL- Bullish (M trend)
2)Monthly RSI: HH & HL - Bullish signal
RSI brek low but price does not break low- its a bullish ( Failure swing)
Weekly analysis:
1) Channel has broken & RSI is bullish above 50
2) previous week candle is closed above.
Daily analysi
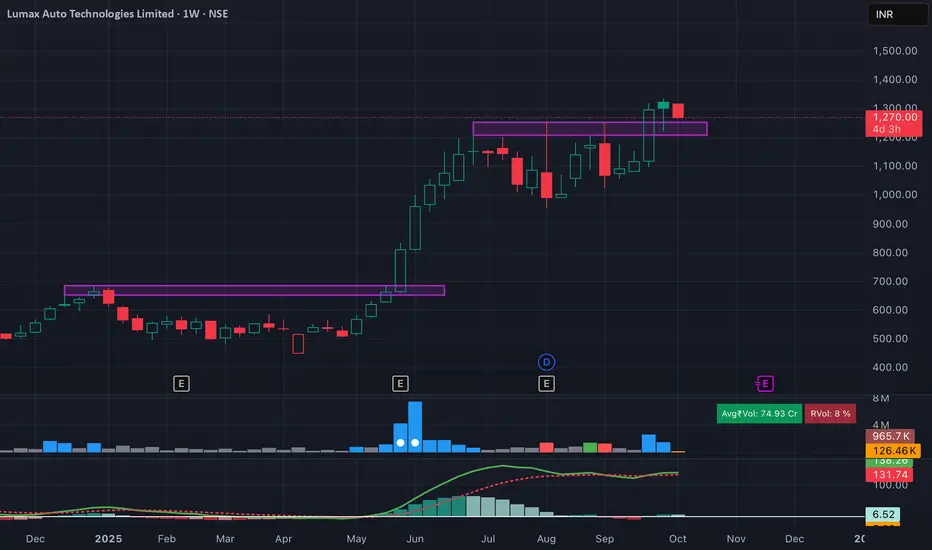
Lumax Auto Technologies – Fresh Breakout & Retest OpportunityLumax Auto Technologies has given a clean breakout above the 1,200–1,230 resistance zone and is now retesting the breakout on the weekly chart. Structure remains strong with higher highs and higher lows — showing continuation of the uptrend.
MACD is stabilizing after a healthy correction, suggesting
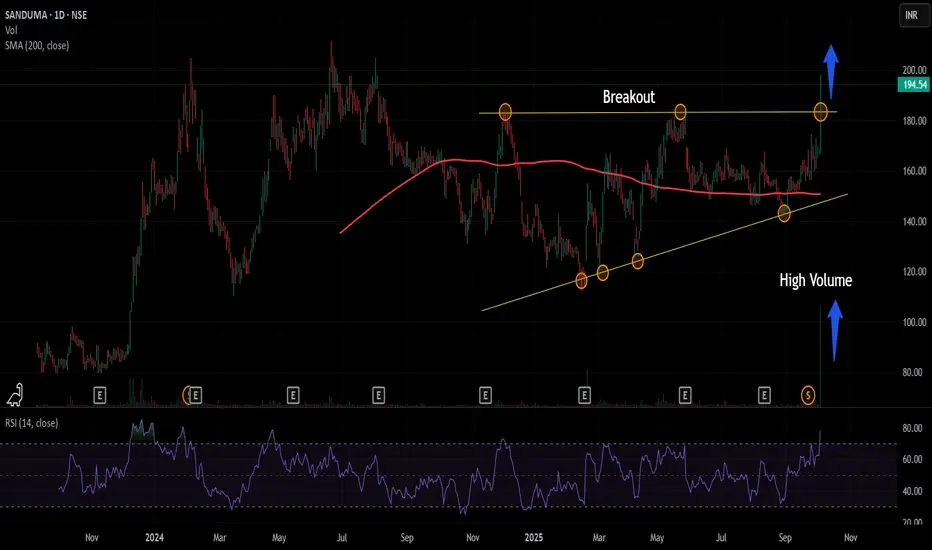
Sandur Manganese & Iron Ores Ltd : Breakout Sandur Manganese & Iron Ores Ltd is in consolidation since last one year. On Friday 3rd of Oct the stock moved up 15% with huge uptick in the volume.
The RSI reading above 70 also suggest there is momentum in the move.
Sector : Metal, outperforming to Nifty 50 benchmark
Looking at the price ch
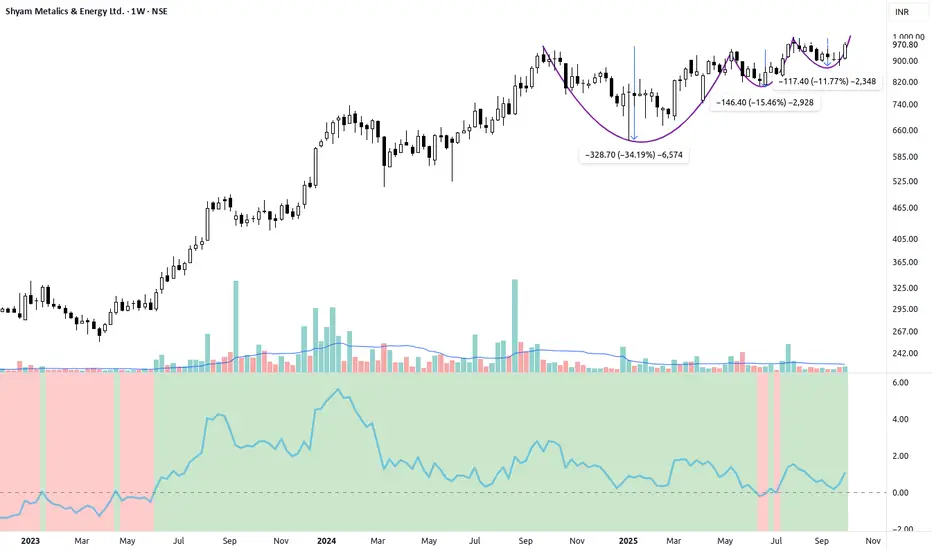
SHYAMMETL -High-Conviction VCP Breakout Setup1. The Setup: Textbook Volatility Contraction Pattern (VCP)
SHYAMMETL is setting up for a major breakout after consolidating near its all-time highs. The chart shows a classic Volatility Contraction Pattern (VCP), a powerful sign of institutional accumulation and supply exhaustion.
We can clearly
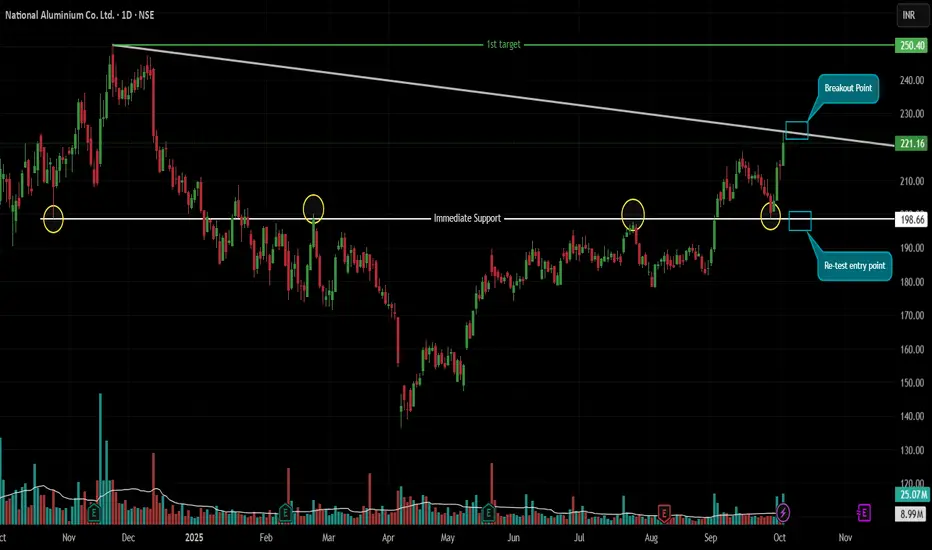
Two Precision Setups for a Major Move | Breakout vs. ReboundChart: NSE:NALCO | Daily Timeframe
📈 Executive Summary:
Nalco Ltd. is at a technical crossroads, compressed between a massive 12-month descending trendline and a rock-solid multi-touch support zone. This creates two high-probability, well-defined trading opportunities for both momentum and value t
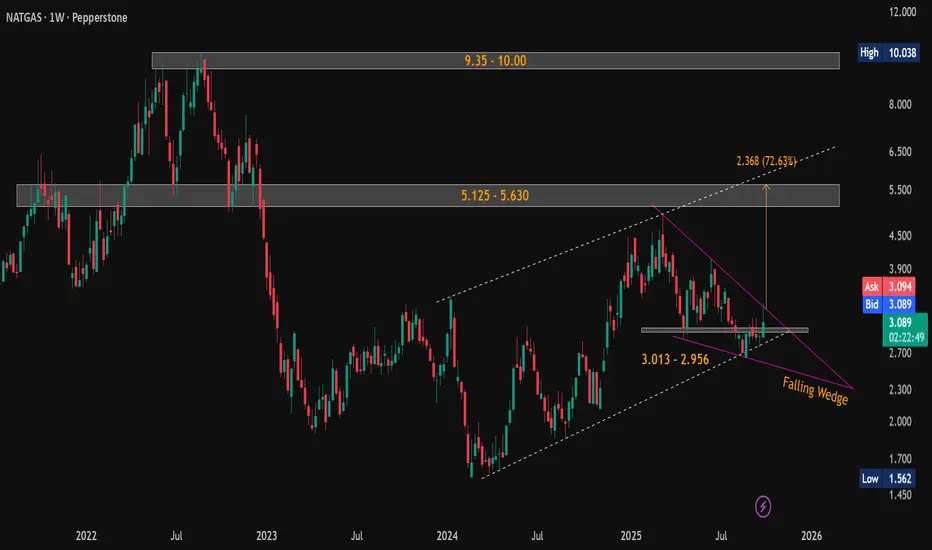
Natural Gas (NG) Weekly Breakout Brewing — 80% Upside Potential!Current Price: $3.090
Technical View (Weekly Timeframe):
Natural Gas has formed a classic falling wedge pattern on the weekly chart - a strong bullish reversal setup. Price action is currently on the verge of breakout , with increasing volume and narrowing range suggesting imminent movement.
See all editors' picks ideas
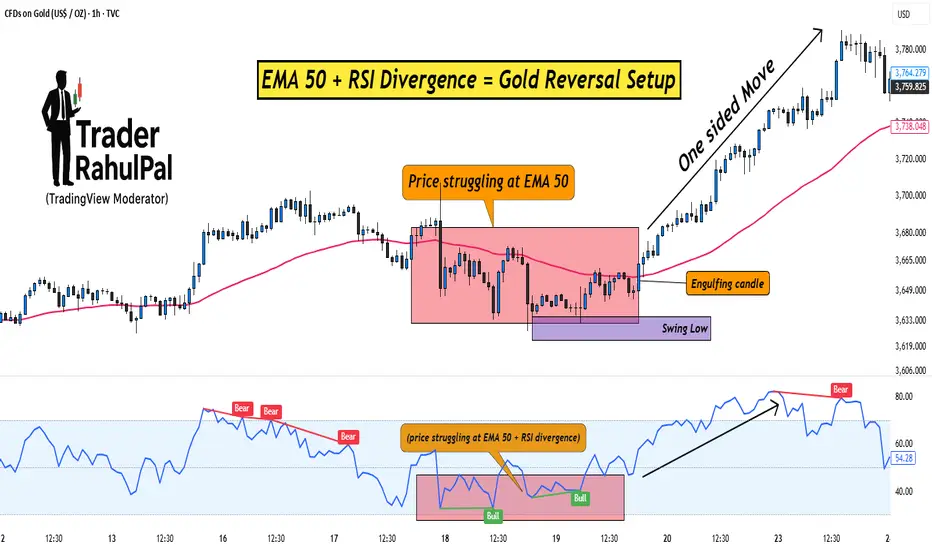
EMA 50 + RSI Divergence = Gold Reversal Setup!Hello Traders!
Gold often makes sharp one-sided moves, trapping traders who enter too late. But if you know how to combine a simple moving average with a momentum indicator, you can spot high-probability reversal setups.
One such method is using the EMA 50 together with RSI Divergence . Let’s br
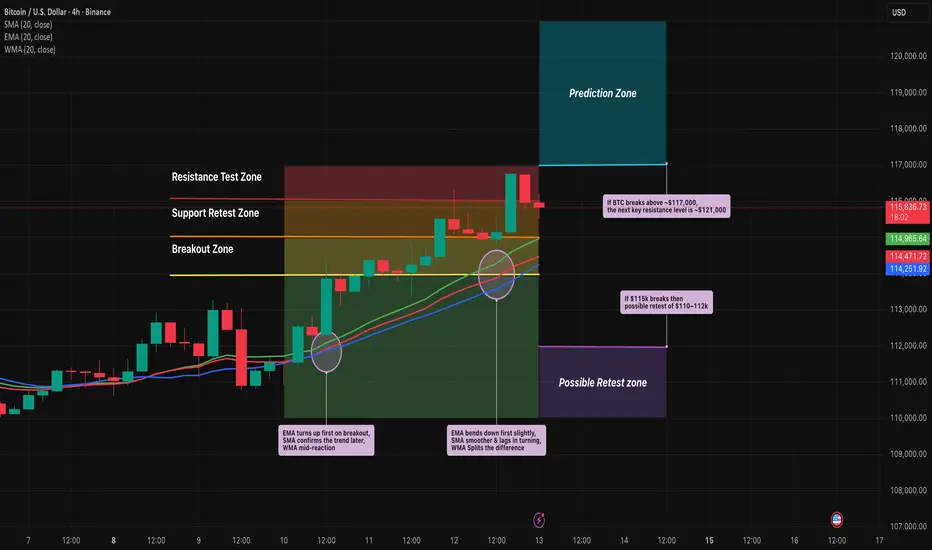
EMA vs SMA vs WMA: Which Moving Average Should You Use?🔎 Intro / Overview
Moving Averages remain one of the most trusted tools in technical analysis. They smooth price action, highlight the trend, and often act as dynamic support or resistance.
In this post, we compare the 20-period SMA, EMA, and WMA on BTCUSD 4H to show how each reacts differentl
Small Account Challenge1. Introduction to the Small Account Challenge
The world of trading often fascinates people because of the possibility of turning small sums of money into significant wealth. But in reality, most aspiring traders don’t begin with huge capital. They usually start with a small account—sometimes $100,

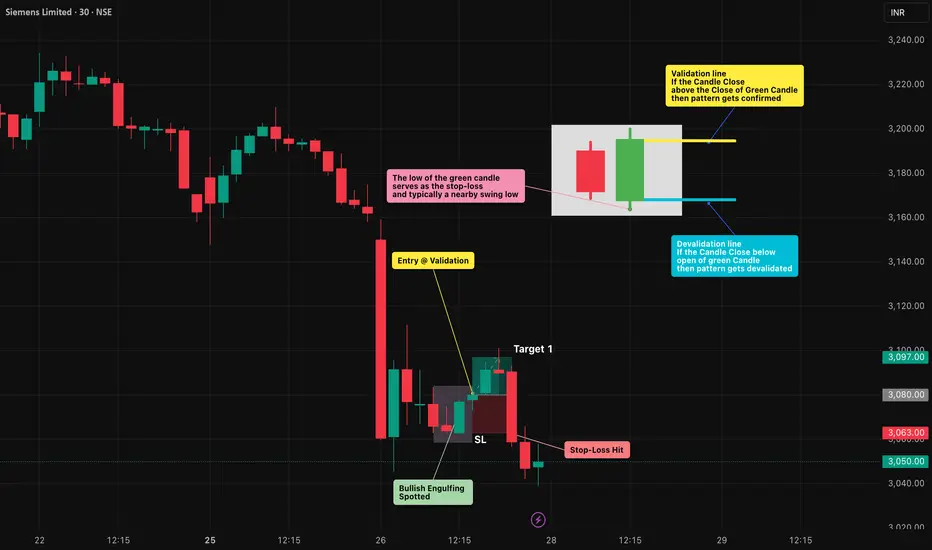
Bullish Engulfing Pattern: Spotting Reversals with Discipline🔎 Intro / Overview
Managing risk is just as important as finding an entry. The Bullish Engulfing is one of the most effective candlestick patterns to identify potential reversals. When traded with discipline, it signals a shift from seller pressure to buyer control, helping traders time their ent
Commit to the Shift next week - focuse on becoming consistent
For the next week, we’re focusing on two powerful tasks that will move you closer to becoming a consistently profitable trader:
✅ Task 1: Deep self-reflection. Understand your strengths, demons, and bad habits—the things holding you back from consistency. Identify your triggers and write them down

Survival First, Success LaterThere was once a stone that lay deep in the heart of a flowing river.
Every day, the water rushed past it, sometimes gently, sometimes with force. The stone wanted to stay strong, unmoved. It believed that by holding its ground, it could outlast the river.
For years, the stone resisted. It didn’t
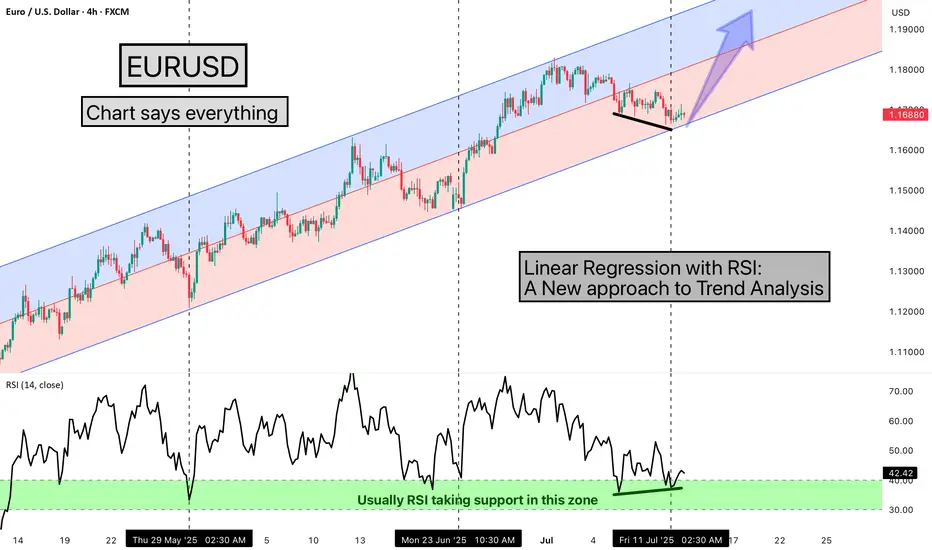
Linear Regression with RSI: A New approach to Trend AnalysisHello Friends,
Welcome to RK_Chaarts,
Today we are going to learn one Method of analysing the chart, here we are using EURUSD chart, and the method we're using is very simple & interesting, We are using the Linear Regression Trend Channel & Relative Strength Index (RSI), What happens in this metho
Who Should Avoid Trading? Is That You? Ask YourselfThere is no doubt that trading is the simplest business in the world. You just need to do a small paperwork which is online these days, need a laptop or PC and an internet connection. Besides that, all you need is time. But here the simplest should not be confused with the Easy. Although you just ne

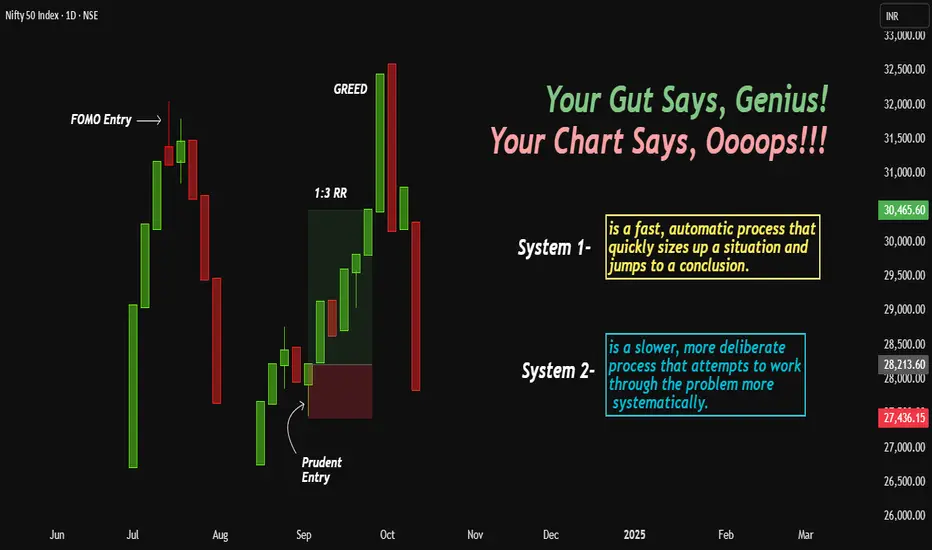
Brain Hunts, Wallet Hurts!In this brief article, I aim to throw some light upon a typical trader's psychology, which is often swayed by greed and fear, and the constant battle between careful analysis and impulsive decisions.
Traders who actually trade and not just analyze understand that the stock market is not merely a ga
Effective inefficiencyStop-Loss. This combination of words sounds like a magic spell for impatient investors. It's really challenging to watch your account get smaller and smaller. That's why people came up with this magic amulet. Go to the market, don't be afraid, just put it on. Let your profits run, but limit your los

See all editors' picks ideas
Daily analysis for Nifty50: 29/09/25Nifty is still not bullish. A trendline support test is quite possible. That comes at around 24535-24520 range of price. If that is breaching it will test lower levels of 24560, 24405 and 24360 as downside fall.
On bounce it will rise till 24630 to 24740 as resistance.

bankniftyI feel that bank nifty and axis bank has shown good recovery in the past two weeks. With axis bank closing over 200 dma and with strong gains for last three days, the momemtum should continue. Good time to buy for investors and traders as one can go positionally long here with targets of 1140 and

Dow Theory Update and Nifty AnalysisIn this video, we have explained the following points -
* A new Dow Top "A1" has been created by Nifty50.
* The significance of the new Dow Top has been explained.
* The current structure of Nifty has been discussed.
* The importance of waiting for the next candle and the current key support lev

Commit to the Shift next week - focuse on becoming consistent
For the next week, we’re focusing on two powerful tasks that will move you closer to becoming a consistently profitable trader:
✅ Task 1: Deep self-reflection. Understand your strengths, demons, and bad habits—the things holding you back from consistency. Identify your triggers and write them down
Market Analysis and Nifty AnalysisIn this video, I have provided an overall market analysis. :
Although the market is green today, it's important to stay cautious.
Small caps are forming range-bound bullish engulfing candles, but we need to wait for the closing.
Nifty continues to form lower lows on the lower time frame. A

Nifty 50 Analysis and Dow theory LevelNifty 50 Analysis:
Points discussed in the video-
How we should observe structure when there is a big gap.
Importance of current gap up on major resistance.
Importance of today's closing.
Dow Theory Level:
As per Dow theory, we are heading towards trend change and uptrend will be there.
O

What is Object Tree and it's UsesHi mates kindly watch the video for understanding the Object tree and it's uses in technical analysis as i feel the new entrants to technical analysis still might not know about it, I hope you will like this publication,
Thanks for watching and giving your time.
Best regards- Amit

A clear Falling channel pattern in Amara Raja(Hindi)NSE:ARE_M From it's All time high it has formed a falling channel pattern and now it is ready to break it for a higher high. Target is an all-time high and SL will be 1340 and below as per risk appetite and holding capacity.

Nifty Analysis for 21-Oct-24 and Short term Orient AromaticsStock has been analyzed based on my trendline analysis. Please note that levels given are for training and educational purpose only. Please do consult your financial advisor before investing in the stock

MAHINDRA LOGISTICSHello & welcome to this analysis
It has resistance near 550 while strong support between 500-450
One can accumulate the stock in the wider range of 550-450 for possible upside levels of 650-725-900.
View would go wrong if it starts slipping below 350
Happy investing

See all editors' picks ideas
PongExperience PONG! The classic arcade game, now on your charts!
With this indicator, you can finally achieve your lifelong dream of beating the Markets. . . at PONG!
Pong is jam-packed with features! Such as:
2 Paddles
A moving dot
Floating numbers
The idea of a net
This indicator is solel

Options Max Pain Calculator [BackQuant]Options Max Pain Calculator
A visualization tool that models option expiry dynamics by calculating "max pain" levels, displaying synthetic open interest curves, gamma exposure profiles, and pin-risk zones to help identify where market makers have the least payout exposure.
What is Max Pain?
Max

Volume Profile 3D (Zeiierman)█ Overview
Volume Profile 3D (Zeiierman) is a next-generation volume profile that renders market participation as a 3D-style profile directly on your chart. Instead of flat histograms, you get a depth-aware profile with parallax, gradient transparency, and bull/bear separation, so you can see w

RiskMetrics█ OVERVIEW
This library is a tool for Pine programmers that provides functions for calculating risk-adjusted performance metrics on periodic price returns. The calculations used by this library's functions closely mirror those the Broker Emulator uses to calculate strategy performance metrics (

Simple Decesion Matrix Classification Algorithm [SS]Hello everyone,
It has been a while since I posted an indicator, so thought I would share this project I did for fun.
This indicator is an attempt to develop a pseudo Random Forest classification decision matrix model for Pinescript.
This is not a full, robust Random Forest model by any stretch o

Tick CVD [Kioseff Trading]Hello!
This script "Tick CVD" employs live tick data to calculate CVD and volume delta! No tick chart required.
Features
Live price ticks are recorded
CVD calculated using live ticks
Delta calculated using live ticks
Tick-based HMA, WMA, EMA, or SMA for CVD and price
Key tick levels (S

analytics_tablesLibrary "analytics_tables"
📝 Description
This library provides the implementation of several performance-related statistics and metrics, presented in the form of tables.
The metrics shown in the afforementioned tables where developed during the past years of my in-depth analalysis of various str

Adaptive Trend Classification: Moving Averages [InvestorUnknown]Adaptive Trend Classification: Moving Averages
Overview
The Adaptive Trend Classification (ATC) Moving Averages indicator is a robust and adaptable investing tool designed to provide dynamic signals based on various types of moving averages and their lengths. This indicator incorporates multipl

Statistics • Chi Square • P-value • SignificanceThe Statistics • Chi Square • P-value • Significance publication aims to provide a tool for combining different conditions and checking whether the outcome is significant using the Chi-Square Test and P-value.
🔶 USAGE
The basic principle is to compare two or more groups and check the results

FiniteStateMachine🟩 OVERVIEW
A flexible framework for creating, testing and implementing a Finite State Machine (FSM) in your script. FSMs use rules to control how states change in response to events.
This is the first Finite State Machine library on TradingView and it's quite a different way to think about your

See all editors' picks scripts