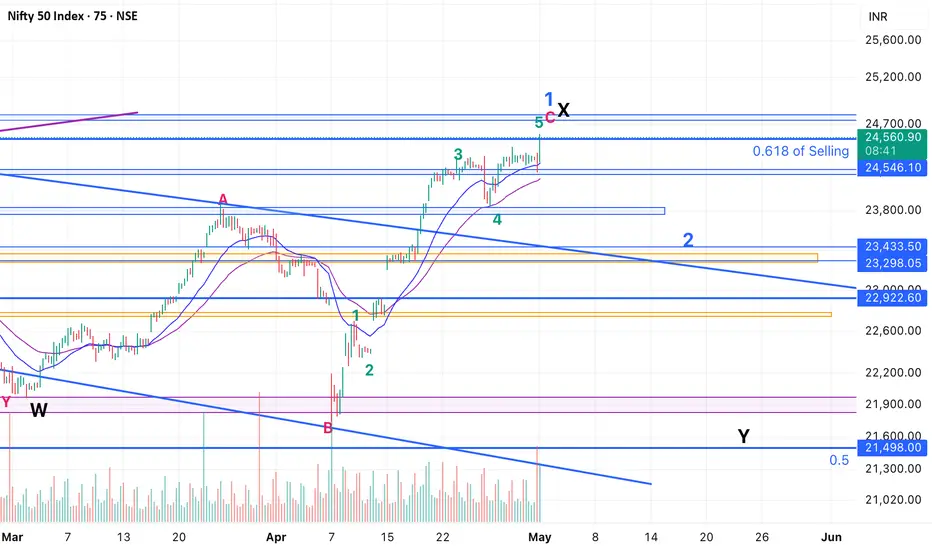
Nifty - Elliot Wave Analysis - Short Opportunity!We have had a good run-up from April lows. Today's buying seems like the last leg up which should end 5th up.
Now there are two possibilities:
1. Bullish Scenario: Nifty has completed correction in April first week and we have done Wave 1 in an impulse of 5 waves up. In this case we should retrace 38-50% of the move from April lows. So, expect 500-1000 points in Wave 2.
2. Bearish Scenario: The entire move up from April lows was corrective and part of larger X. X is formed by ABC where C is 5 waves up - i.e. the move from April first week lows.
If this is the case, then we head to new low in Y. 21500 or lower.
In both cases this is the time to initiate shorts and ride at least 500 points the move down. All the best!
Elliott Wave
XAU/USD Elliott Wave Count: Preparing for Final ImpulseXAU/USD appears to be in a textbook 5-wave impulsive structure on the 4H chart, with the market now completing Wave 4 as a classic ABC corrective flat/pennant.
The impulsive move from the Wave 2 low has formed clear internal substructures, with Wave 3 exhibiting extended price action, consistent with Elliott Wave guidelines.
Currently, price is consolidating in a contracting pattern labeled Wave 4 (A-B-C), which looks to be near completion. Based on wave symmetry and Fibonacci projections, a strong upside move is anticipated once Wave 4 concludes, leading into the final Wave 5 rally.
Entry Zone: 3286.875
Target: 3367.440– 3410.210
Stop Loss: Below 3260.190.

FAZE3Q LONGThe Elliott Wave analysis shows that the stock has completed waves (i), (ii), (iii), (iv), and (v), as represented by blue numbers on the daily chart.
Stock is in correction now.
Wave correction will go in waves (a), (b), and (c) in blue color on the chart.
Wave (a) is completed, and wave (b) is in progress.
Wave (b) will go in three sub-waves (a, b, and c in red color).
Wave a and b is completed and wave c is in progress.
wave c will unfold in five sub-waves (black circle) shown in the chart above.
Wave 1, 2, 3, and 4 in a black circle is finished, and wave 5 will start.
Wave levels are shown on the chart.
Level of Invalidation
Wave (a) has been identified as the invalidation level, which is 366.05. Because According to the wave rules, Wave (b) cannot cross the pricing territory of Wave (a). If the price falls below this level, it may signal that the projected Elliott Wave pattern is not what it appears.
I am not a registered Sebi analyst. My research is strictly for scholarly interests.
Before you trade or invest, please consult with your financial advisor. I am not responsible for your earnings or losses.
Regards,
Dr Vineet

JSFB LONGThe Elliott Wave Theory's description of the structure and pattern of price movements in financial markets is known as the Elliott Wave Structure.
The Elliott Wave analysis indicates that the stock has completed waves (i) and (ii), which are shown as blue numbers on the daily chart. Journey of Wave (iii) will start.
It is anticipated that wave (iii) will have about five subdivisions shown in red color.
wave i (in red color) of wave (iii) will unfold in five sub waves shown in black circle.
Wave levels of wave i in red color is shown on chart.
Level of Invalidation
The starting point of Wave (i) has been identified as the invalidation level at 365. Because as per wave rules Wave (ii) cannot cross the starting point of Wave (i). If the price falls below this level, it can indicate that the expected Elliott Wave pattern is not as it seems.
I am not a registered Sebi analyst. My research is being done only for academic interests.
Please speak with your financial advisor before trading or making any investments. I take no responsibility whatsoever for your gains or losses.
Regards
Dr Vineet

End of correction of w (iv)We see end of w (iv) . Alteration of w(i) and w(iv) is there . I have seen many w(3) with an extended w 5 . This is atypical . But anyway w(iv) has ended . It is end of correction . We will see how the waves materialize .

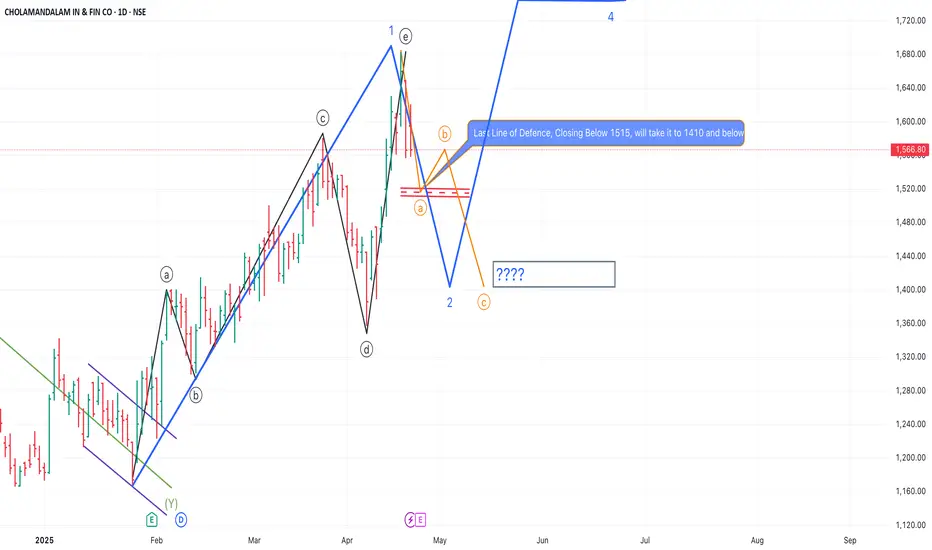
CHOLAMANDALAM NEEDS BREAK After a good run up any stock needs break. Cholamandalam Investment and Finance Company is no different. What you see on the chart is the completion of the Leading Diagonal, what's coming next is correction a-b-c. Now the question stands is how many days of break is needed before it could resume its upward Journey. If its closes below 1515, then the vacation is long.
Watchout for the levels in chart. when its ready it will be difficult to stop Cholamandalam's upward journey.
Please refer my earlier chart, hope you guys have benefited.
Disclaimer: This is only for Educational Purpose. I am not an SEBI registered member.
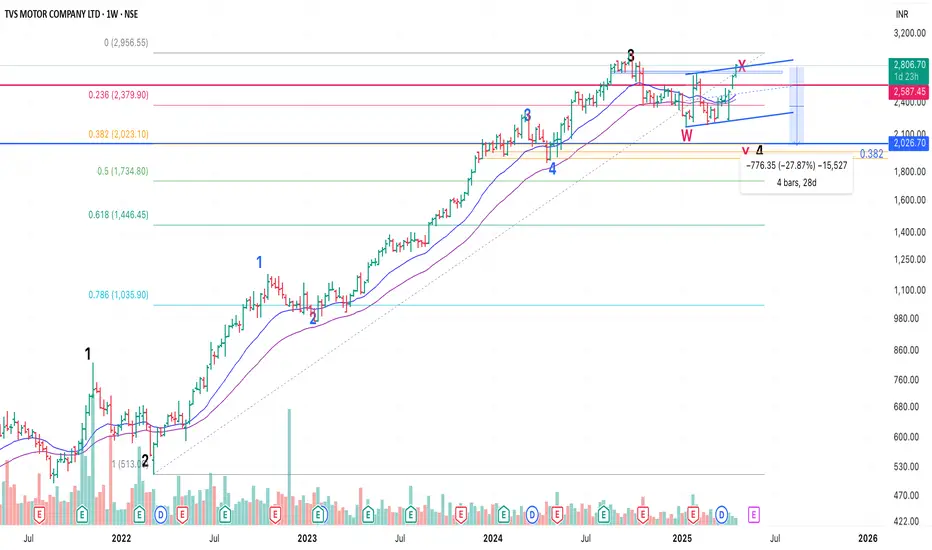
TVS Motors - Elliot Wave Counts - Good RR Short!TVS completed 5 Wave rise from March 2022 till Sep 2024, which fromed a major Wave 3.
I would have ideally wanted Wave 4 to correct at least 38.2%, which did not happen.
Now that stock is almost at ATH, it offers a good opportunity to explore a short with previous high as SL.
The entire zig zag move from Jan lows can just be an X and we get a Y down till at least 38.2% which is at 2025, a good 17% correction from today's price.
All the best!
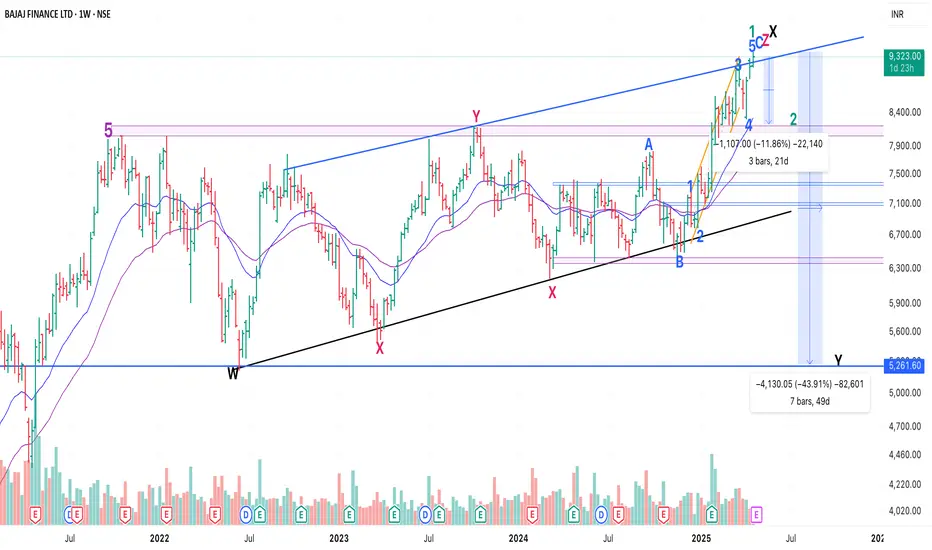
Bajaj Finance - Elliot Wave Counts - Major top done?Bajaj Finance has been in a sideways consolidation since Sep 2021, where it had completed a Major top from March 2009 lows (as per my counts).
So, there are two Possibilities from here:
P1. Major top -> sideways action -> Finall blow-out correction/ capitulation and then a start of next leg up.
P2. Major top -> sideways consolidation for 4 years (till Jan 2025) -> Next leg up started
P1: Reason could be re-rating of P/BV (which stands at 6.6), to industry avearge of around 4. Bajaj has been growing fast on account of unsercured lending. There could be bad assets building and the bubble can burst anytime, leading to the de-rating (P.S.: It has already de-rated from P/BV of 12.3 in Sep 2021 to 6.6 currently)
Elliot Counts: The correction from Sep 21 to June 22 was a W. the entire upmove from June 22 till date has been an overlapping corrective move in an X. What is to follow is Y, which should ideally re-test W at 5300 (that's a 43% fall)
P2: In this case we have completed the correction from Sep 21 till Jan 25 and started a new move up.
The five wave completion is just the Wave 1, and what is to follow is Wave 2, which can correct 38% to 50% of Wave 1 (i.e. from Jan 25 lows till the highs). Expect min 8300 to come, which again is a more than 10% correction.
Good thing is in both cases, we get a good enough correction to trade. All the best!
Gold Elliot Wave Counts - Possibility 2 (Weekly 3rd done)There are two possibilities in Gold. Possibility 1 shared in another post (Targets of Possibility 1: 0.236: $2056, 0.382: $2781)
As per Possibility 2 the spike move up was 5th of 3 and hence we have just completed a 3rd Wave in weekly time frame - ending the move from Oct 2023 lows.
In this case also, we can expect 0.382: 2850, 0.5: 2650.
Gold went up on account of multiple reasons, key of which being de-dollarization and buying by non US countries.
However, my sense is that the spike in price was on account of trades from institutions, which will get unwound when price starts correcting and fuel the correction on the way down.
The move in last 2 weeks was a typical parabolic move, which should mark the capitulation.
Probable Risk: The last move from April lows was just 1 of 5. Hence keeping SL of current high is important.
Breaking 3150 (0.618 of the move from April) should give us more confident that 5 is done.

Gold Elliot Wave Counts - Possibility 1 (Weekly 5th done)There are two possibilities in Gold. Sharing my favored possibility here. Will share possibility 2 in another post.
Gold went up on account of multiple reasons, key of which being de-dollarization and buying by Non US countries.
However, my sense is that the spike in price was on account of trades from institutions, which will get unwound when price starts correcting and fuel the correction on the way down.
The move in last 2 weeks was a typical parabolic move, which should mark the capitulation.
Hence, look for correction of entire leg up from Oct 22 bottom.
Targets: 0.236: $2056, 0.382: $2781
Probable Risk: The last move from April lows was just 1 of 5. Hence keeping SL of current high is important.
Breaking 3150 (0.618 of the move from April) should give us more confident that 5 is done.

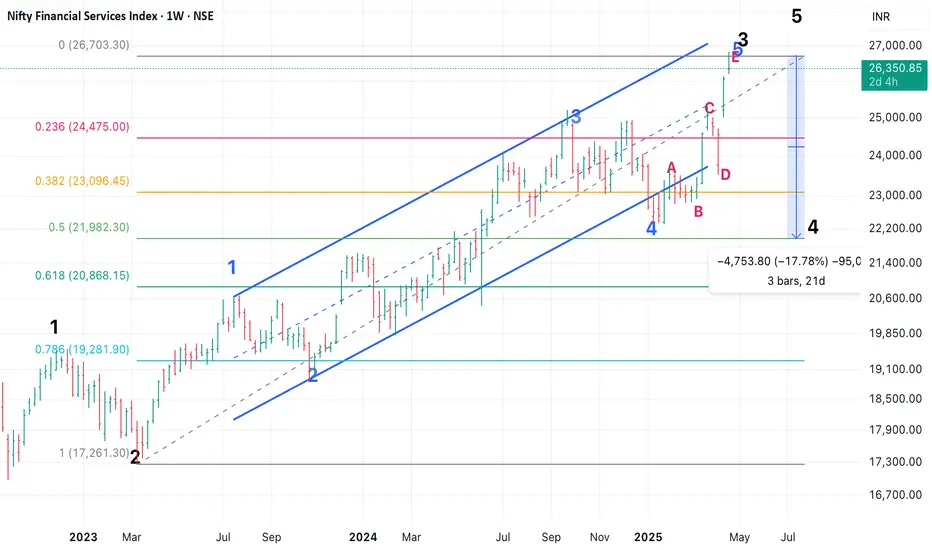
Nifty Financial Services - EW Analysis - Good RR ShortNifty Financial Services showed resilience in the entire fall and led the way up in recovery as it had a 5 of 3 up (from March 23 lows) pending, which got done in Nifty and most other indices in Dec 2023.
Now it has completed that 4 and should lead on the way down. Expecting at least a 14% correction in index till 23150 (38.2% retracement). Next target will be 22020 (50% retracement).
My bet is on 50% retracement, as Bajaj Twins and HDFC Bank and ICICI Bank have completed a corrective bounce and should test/ break recent lows.
Bajaj Twins have much larger correction possibility. Will share in other posts.
TSLA completing its complex correction ? keep a watchTSLA may be completing its complex correction before it starts its next impulse.,
This view is invalidated if it closes on weekly basis below : 138

EURJPY: Short Setup with Target Zones in FocusEURJPY outlines a clear W-X-Y corrective pattern. Wave (W) ended at 161.297 , followed by an upward corrective move in Wave (X), which topped at 162.665 with a classic ABC formation.
Currently, the price is hovering around 162.084, likely forming Wave B of the final Y leg. A brief move higher could complete this B wave before the pair resumes its decline toward the 160.922–160.680 area, which marks the projected end of Wave C of (Y).
The broader correction is framed by two descending blue trendlines, providing dynamic resistance and support, while a short-term red ascending trendline is currently holding the price action but may soon give way. If the price stalls or rejects around the 162.3–162.5 zone, it could signal the start of the next leg down, making it a potential setup for short positions. After the reversal from Wave Y, potential upside targets are 161.600, 162.500 , and 163.100 .
We will update it soon!

Biocon long term countMy view on Biocon long term count. In log scale.
View invalid if it breaks below wave 2 low.
Not any buy or sell recommendation.

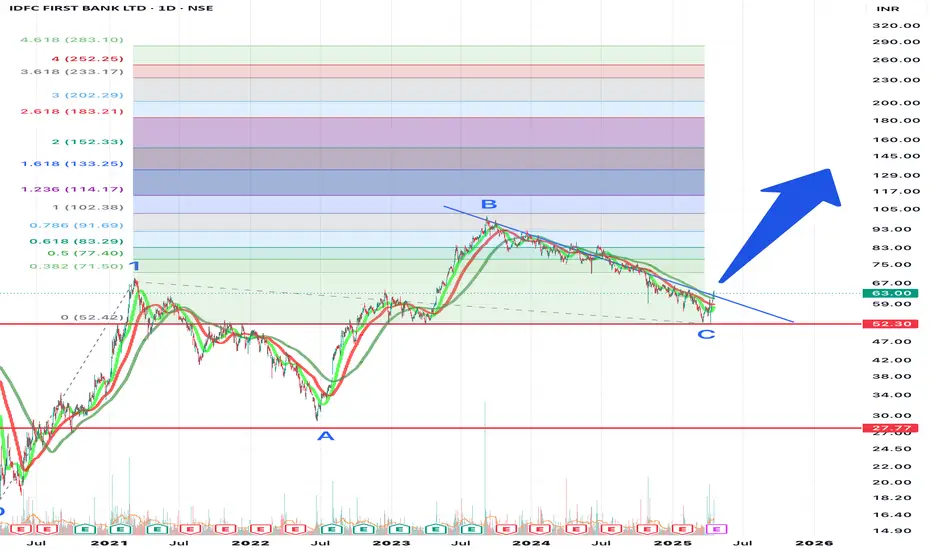
IDFC Elliot wave count (updated)IDFC First bank has a peculiar wave count. A wave was 61.2% of wave 1. Wave B was 161.6% of wave A. Wave C is 61.8% of wave B. I did not mark B as another sub wave 1 as it clearly looked three waves. Wave C low aligns with Wave 1 low and wave A low.
The target for Wave 3 using the channel extension is shown (as minimum) by this year. Looks like If time gets extended to complete wave 3 then wave 3 targets also gets extended.
Is this setup possible? Not sure of the counts. I am using logarithmic scale.

IDFC bank strange Elliot wave count IDFC First bank seem to have a peculiar wave count. A wave was 61.2% of wave 1. Wave B was 161.6% of wave A. Wave C is 61.8% of wave B. I did not mark B as another sub wave 1 as it clearly looked three waves. Is this setup possible?
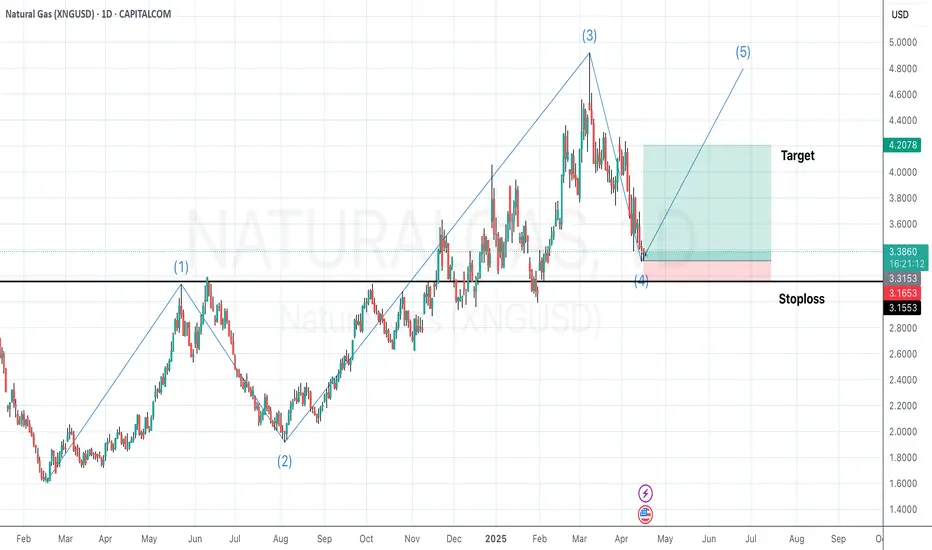
Elliott Wave Analysis on Natural Gas (XNGUSD) – Potential Wave 5We are observing a classic Elliott Wave structure unfolding on the Daily timeframe of Natural Gas (XNGUSD). Here's a breakdown of the current wave count:
Wave (1) started the initial impulse move up breaking the previous downtrend.
Wave (2) retraced sharply but respected the Fibonacci support zone.
Wave (3) extended significantly, following typical wave dynamics.
Wave (4) appears to have completed near a key support zone, aligning with previous structure and a possible Fibonacci retracement level.
🔹 We are now potentially entering Wave (5) — a final impulse leg to the upside in this cycle.
🔹 Entry is anticipated at the completion of Wave (4), with targets projected near the previous swing highs.
🔹 A stop-loss is marked just below the Wave (4) support zone to manage risk effectively.
This setup offers a favorable risk-to-reward ratio , especially if price continues to respect the Elliott Wave pattern.
📌 Disclaimer:
This analysis is shared purely for educational and study purposes. It does not constitute financial advice or a trading recommendation. Please do your own research and consult a financial advisor before making any trading decisions.
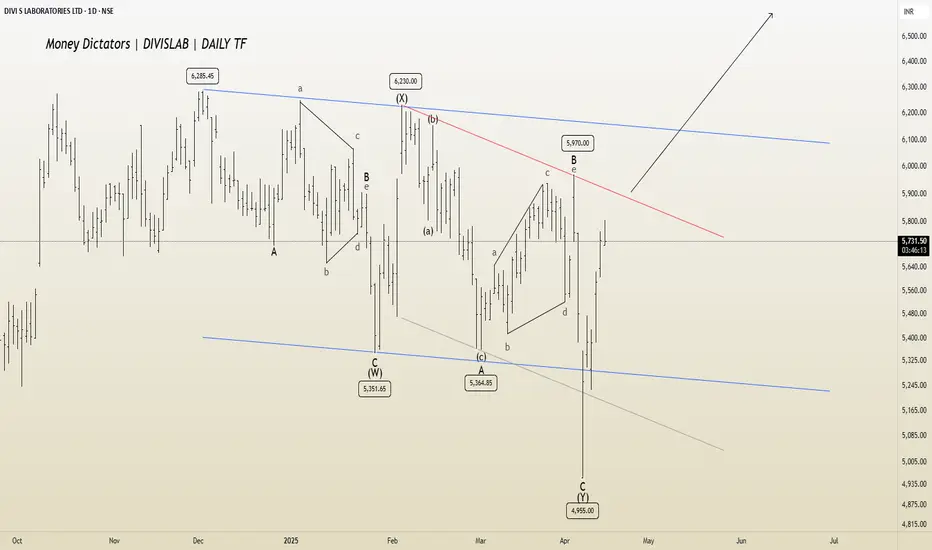
DIVISLAB: Eyeing Breakout from A-B-C Channel Daily TF
DIVISLAB is nearing the completion of a complex W-X-Y corrective pattern. A long position could be considered after a breakout from the A-B-C channel, with potential targets in the 6100–6400 range.
I will update more information soon.
XAU/USD Enters Fourth Wave ConsolidationCurrently, XAU/USD appears to have completed the third wave, and the beginning of the fourth wave seems to be underway, indicating the start of a corrective phase. This correction can potentially extend down to the 3118.486 level. In terms of targets, the key levels to watch are 3166.464 and 3117.451 . Following this correction, there is a possibility that the fifth wave may commence.

XAG/USD Eyes Upside Targets as Wave C MaturesXAG/USD is currently trading in a corrective phase where wave B appears to have completed, and wave C is currently forming. Based on the current price action, it doesn’t seem likely that this entire move will result in a full bullish recovery. The structure suggests that this could be sub-wave C of wave 4, potentially completing around the 26.79944 level. Going forward, if the 5th wave begins to unfold, potential targets could be in the range of 29.74182 to 30.57528.

Gold Long Term Neowave ForecastHello Everyone
FX:XAUUSD In this we are going to talk about gold in detail
## As long as we are above 2771, gold will bullish till May-June. But to confirm this we will need to wait for 2 or 3 more weeks, so buy in parts.
## Inner stucture is in correction of traditional ABC structure and still in developing phase. But i have remove them so that who dont understand neowave wont be confused.
## Apart from this i am adding Live link for fast updates. so if you have any query. Kindly leave a comment. I will be happy to guide you further more.
Live Link- in.tradingview.com

Comprehensive Research - McDonald’s Stock Set to SoarQuick read:
McDonald's stock is poised for a bullish move, with Wave 3 likely starting and strong support near 290.50–295.00. Traders should long on dips within this range, for next resistance levels, 326.00 and 348.00 with a invalidation below 276.00. This setup offers a solid risk-to-reward in a long-term uptrend. Alternative safe entry is possible after the break of corrective channel breakout of wave (2).
Elliott Wave Forecast:
TF - Daily
The chart suggests that McDonald’s stock is in the middle of a larger upward move known as Wave C, which comes after completing a complex correction. Wave C is expected to unfold in five smaller waves, a pattern that usually points to a strong uptrend. It appears the correction is behind us, and a fresh bullish phase is underway.
Starting from the low at 276.53 , marked as Wave B, the price climbed to 326.32 , forming Wave one. After that, the stock pulled back to 290.50 , forming Wave two. This pullback followed a typical ABC pattern within a corrective channel, which often signals the end of a downturn and the beginning of an upward move.
Now, Wave three seems to be starting, and this is usually the strongest part of Wave C. The price is expected to move above 335 , take a small pause for Wave four, and then rise again to complete Wave five somewhere around 345 to 350 dollars. This positive outlook remains intact as long as the price stays above 290.50 . With the breakout from the corrective channel, the setup looks strong and clear for buyers.
Fibonacci levels:
Fibonacci Extension Targets:
1.000 extension: 326
1.618 extension: 348
Correction Retracement Levels:
Wave 2 retracement: 78.6%
A = C in A-B-C correction: 289.21
Price Action & shifting of value:
TF: Weekly
McDonald’s stock has been steadily climbing inside a rising channel since late 2020, showing a clear long term uptrend. The price has respected both the top and bottom edges of this channel very well, and interestingly, the middle line has acted like a pivot, providing support or resistance multiple times over the years.
Recently, the stock made a higher low at 276.53 and bounced back strongly, keeping the bullish structure intact. It then pulled back to 290.50 , right around the middle line of the channel, and held above an upward sloping trendline. This kind of price action shows strength and suggests buyers are stepping in.
The sharp move from 276.53 up to current levels looks like a strong bullish leg, possibly driven by accumulation. If the stock can break above its recent high of 326.32 , it could head toward the upper end of the channel. As long as the price stays above 290.50 and especially above 276.53 dollars, the bulls remain in control. Even if the price dips a bit, the long term trend stays positive unless the lower boundary of the channel breaks down.
I will update more Information here.

GBPCAD - Is Bullish Breakout Ahead?TF: 4h
GBPCAD is initiating along opportunity by completing 4th intermediate wave at 1.83464 . We can expect a retracement then reversal with near the lower trendline of the parallel channel.
Once price comes down, we will have the opportunity to go long with minimum stop level at low of the wave 4 at 1.83640 . The bullish scenario is capable GBPCAD to provide 1.8654 - 1.8748 targets to the buyers.
If the breakdown occurs, wave (4) will go deep. We update this chart time to time. Traders should only buy after a clear reversal.
