Escorts – Downtrend resumes?I had posted an idea earlier about Escorts NSE:ESCORTS on May 8 when it was trading at 989 wherein the target of 911 was mentioned.
(Well, as we can see that target was achieved long back !)
Now looks like the stock has completed a countertrend move on the upside and is ready to fall again.
I can see that it faced a strong rejection at 50% retracement of the previous downfall and formed a Bearish Engulfing candle today.
We may witness further fall if the stock goes and sustains below ~ 870 levels.
Good shorting opportunity here with a stop loss of around 910 for a target around 800 levels.
Disclaimer: Views expressed here are my own, and should not be interpreted as an Investment Advice. Please consult your Financial Advisor for investments.
Engulfing Candle

Titan - Downtrend resumes ?Titan NSE:TITAN seems to have topped out around 1000 levels and had a swift fall thereafter to make a low of 909.
After a small retracement for 4 days, looks like the downtrend has resumed today.
Today’s candle is a large bearish engulfing candle which wiped off all the gains it had in the past 4 days, indicating a strong selling pressure.
To me it looks like the stock is moving towards 872 levels.
Took short positions today with stop loss around 950 levels for a first target around 872 levels.
Disclaimer: Views expressed here are my own, and should not be interpreted as an Investment Advice. Please consult your Financial Advisor for investments.

A second chance to buy in BTSBTC , Don't miss it.BitShares/Bitcoin
New trading suggestion:
*The price is in an up trend and we forecast the uptrend would continue.
* There is still possibility of temporary retracement to suggested support line(0.0000275), if so, traders can set orders based on Price Action and expect to reach short-term targets.
*If the support line at (0.0000275) is broken, the forecast (Continuation of uptrend) will be invalid.
Entry signal:
Signal to enter the market occurs when the price comes to "Buy zone" then forms one of the reversal patterns, whether "Bullish Engulfing" , "Hammer" or "Valley" , in other words,
NO entry signal when the price comes to the zone BUT after any of reversal patterns is formed in the zone.
To learn more about "Entry signal" and special version of our "Price Action" strategy FOLLOW our lessons:
Trade Setup:
We opened 7 BUY trade(s) @ 0.00001790(day close price) based on the reversal candle (Bullish Engulfing) at 03.29.2018.
Total Profit: 9900
Closed trade(s): 1110 Profit
Open trade(s): 8790 Profit
Closed Profit:
TP1 @ 0.000029 touched at 04.19.2018 with 1110 Profit.
Open Profit:
Profit for one trade is 0.00003255(current price) - 0.00001790(open price) = 1465
6 trade(s) still open, therefore total profit for open trade(s) is 1465 x 6 = 8790
All SLs moved to Break-even point.
Take Profits:
TP2= @ 0.000047
TP3= @ 0.000059
TP4= @ 0.000071
TP5= @ 0.000102
TP6= @ 0.000176
TP7= Free
Technical analysis:
BitShares/Bitcoin is in an up trend and continuation of up trend is expected.
The price is above the 21-Day WEMA which acts as a dynamic support.
The RSI is at 51.

A good opportunity to buy in KNCBTC , Don't miss it.KyberNetwork/Bitcoin
New trading suggestion:
The price is in an up trend and we forecast the uptrend would continue.
But there is possibility of temporary retracement to suggested support zone (0.000235 to 0.000187), if so, traders can set orders based on Daily-Trading-Opportunities and expect to reach short-term targets.
Beginning of entry zone (0.000235)
Ending of entry zone (0.000187)
Entry signal:
Signal to enter the market occurs when the price comes to "Buy zone" then forms one of the reversal patterns, whether "Hammer" or "Valley" , in other words,
NO entry signal when the price comes to the zone BUT after any of reversal patterns is formed in the zone.
To learn more about "Entry signal" and special version of our "Price Action" strategy FOLLOW our lessons:
Take Profits:
TP1= @ 0.000274
TP2= @ 0.000313
TP3= @ 0.000369
TP4= @ 0.000440
TP5= Free

BEARISH REVERSAL IN HEROMOTOCORPHEROMOTOCO
Bearish engulfing pattern has been spotted at the top of a rally in heromotoco. Also, there is an immediate resistance at the same level.Both RSI and stochastic have given bearish crossovers. Stochastic lies in the overbought zone.

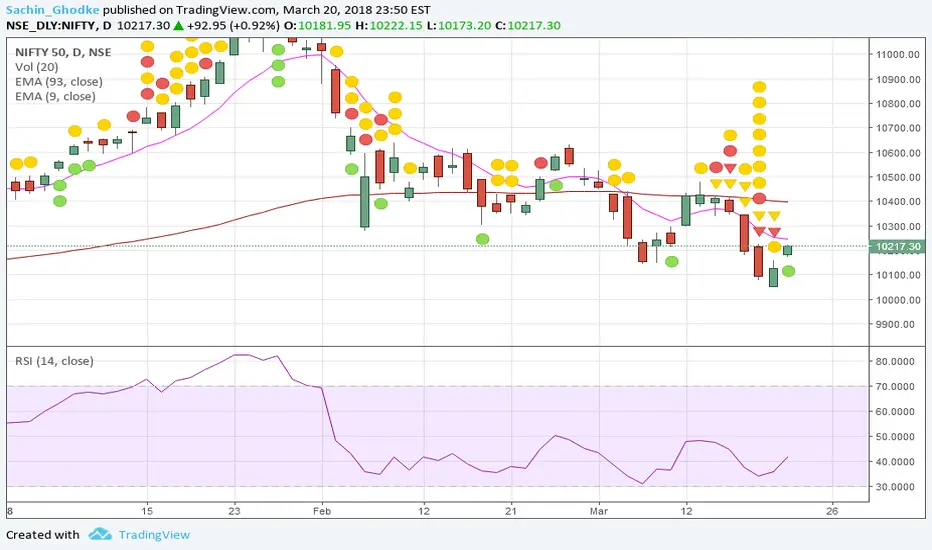
Nifty 50 ( BULLS Vs BEARS ) Daily Chart 'Nifty index opened Gap down breaching previous Lows of 10077 and made new low 10049 in near psychological 10000 support area, sustained buying pressure from lows near about 100 point rally up to 10155 recovers Bulls in Action and tried to stand still against bears positively. Bears Tried to drag down Bulls in last Session but Bulls managed to Hold the Fight settled down. Nifty50 Index on daily chart formed inside Bullish Candle but not surpass the Engulfing pattern near Previous Swing Lows with 200DMA support.
Now if Bulls lift up with its power with yesterday recovery then the hurdles for index are 10168-10198-10222 zones and supports at 10090-10035-9990
Please Like, Share your Views
Thank you God Bless You
Sachin
Crude give breakout of HEAD and SHOULDER patternWTI crude has break the neckline of Head and soulder pattern on daily charts, also it has formed bearish engulfing pattern on weekly charts which is a bearish signal. Next support will be near 58.50.

SREINFRA,Inverse H & S +Bull Engulf + falling wedge->> go go goNSE:SREINFRA It is trading in a falling wedge pattern and about to breakout upwards.
A valid Inverse Head & shoulders pattern has been formed and also the last two candles form Bullish Engulfing pattern.
Confluence of all these factors suggest for long positions .
Longs may be taken at current levels with tight stoploss below 100 or once it breaks the trendline with stoploss around 97.
We can see targets of 112,125 and 140.


Will it bounce back ??? { Bullish Signals }BHEL is currently at 136 levels in downtrend...
Trend reversals signals :
Postitive RSI Divergance, Bullish Hammer and Bullish Engulfing Candlestick Pattern indicates that strong uptrend trend will start..
Targets are 140/147/155/168+
SL : 130
Risk Reward is favourable..
Note: Do your own study before making any positions...

Where it will move?? Let's See!Nifty has made today a Bearish Engulfing Candlestick pattern...
Hope we may see downside...
It may fall upto 9530 regions... And if it brake those levels we may consider it as a channel breakdown..
Targets are 9630/9575/9535
SL : 9705
Note: Do your own study before making any position...
Please Like, Follow and Comment your views below...

Long at Demand Zone with Good RR ratioCurrent price level is clearly a good demand zone where buyers emerge. We can go long here with small Stop Loss just below the low made recently on closing basis and expect a good profit in short term. RSI 40 for this stock worked as extreme oversold zone and again bouncing from this level thus confirming the idea of going long.

Short Kotakbank small risk TradeThe stock is showing continuous divergence and looks ready to retrace from current level. One can short the stock with small Stop Loss and keep the initial target double the risk involved.

GRASIM SHORT Engulfing & Divergence !Today's big Black candle which engulfed the last 2 candles and closed at lowest level is showing the forthcoming weakness. It is also showing bearish divergence in the overbought Zone. One can short the stock at the level where Stop Loss of 1102 on closing basis is affordable to them.

MRF BUY MPL/Action-Reaction MRF stock after a strong vertical bull run paused and it looks like ready to resume the journey again. One can go long now or on dips wherever one is comfortable with the stop loss of 49600 for target of price range 55650 - 57500. It offers good risk to reward ratio.

TVSMotor PF, Channel, Trendline Engulfing confluence SHORTChannel, Pitchfork and Trend line all are meeting beautifully at a single point. Bearish Engulfing today offers a potential short trade at this juncture. I expect it to move easily for the first target of 360 and even further till 340. Stop Loss 393. Similar Setup in Reliance worked well recently.

Bearish Engulfing at Death Zone !The stock is forming bearish Engulfing at .786 Fibonacci level. I would trade it at this level for a short term gain hoping the retracement : risking 10 points and looking for a reward of 12 only as there is nearby support. Risk to reward is not lucrative but mostly such setup reward the small profit.

Engulfing at Demand Zone : Good RR ratioOne can buy the stock for a target of 990. It is coming out of oversold zone made engulfing and the earlier engulfing made on 16.11.16 clearly holding the price. It seems good entry at current with affordable stop loss.

Classical trade using Trendline, Channel & EngulfingThe stock is getting support at up sloping trend line. Probably we can use this pull back for entering a long at this level. My idea has following justification
1. closed out of downtrend regression channel
2.Made an engulfing covering the previous candle completely.
3. Trend line support.
4. Mostly at this level of RSI it changes the trend.
5. Trend reversal entry on 1st bar offers a good Risk to reward ratio.
I would take entry on Tuesday and see how it works.

Classical Chart patterns in play ArvindThe chart has made a Cup with handle pattern but getting overhead resistance before reached the target. It has also formed beautiful triple drive on the top pattern and bearish engulfing in the last bar, therefore I would recommend to short it at current level with stop loss just at the high made a bar ago(on closing basis). With little bearish strength it could easily reach up to 320 level giving a good risk reward ratio.
Alternatively it may retest the 344 level and bounce from there to reach the target for the cup with handle pattern.
Let's see and watch!
