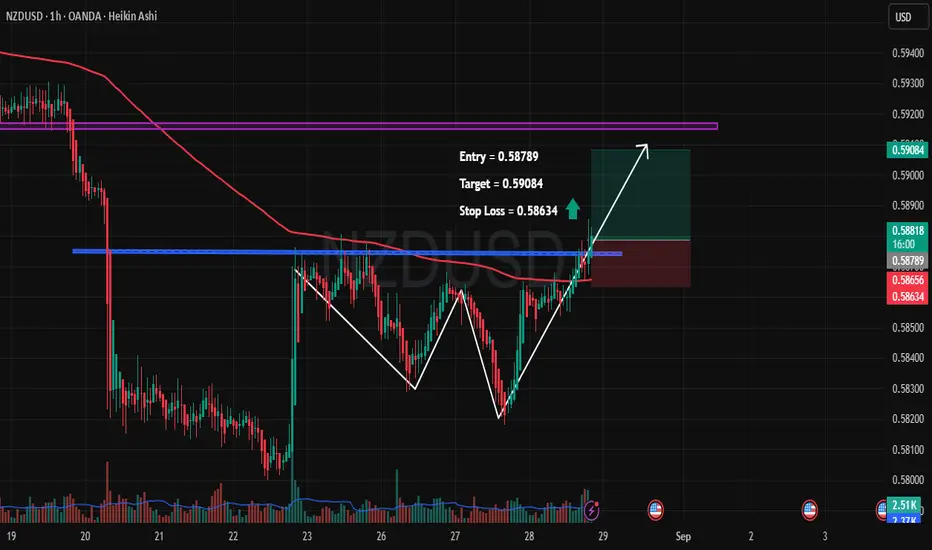
NZDUSD – Breakout Confirmation with Upside Potential🔹 Pair: NZDUSD (1H, Heikin Ashi)
🔹 Entry: 0.58789
🔹 Target: 0.59084 🎯
🔹 Stop Loss: 0.58634 🛑
🔑 Trade Rationale:
✅ Double Bottom Formation – Price respected key support twice, signaling potential reversal.
✅ Breakout Above Resistance – Clean breakout above horizontal resistance (blue line).
✅ 200 EMA Retest – Price is now pushing above the EMA, adding strength to the bullish case.
✅ Volume Spike – Recent surge in buying volume supports the upside move.
📊 Trade Plan:
I’m going long from 0.58789, looking for a quick move toward 0.59084. Risk is limited with a tight SL at 0.58634.
This setup offers a favorable R:R with a technical confluence of breakout + pattern confirmation.
⚠️ Disclaimer: This is not financial advice. Trade at your own risk. Always use proper risk management.
Fundamental Analysis
Part 3 Trading Master ClassIntroduction
Options trading is one of the most fascinating and versatile aspects of the financial markets. Unlike stocks, which give ownership in a company, or bonds, which provide fixed income, options are derivative instruments whose value is derived from an underlying asset such as stocks, indices, commodities, or currencies. They give traders the right, but not the obligation, to buy or sell the underlying asset at a predetermined price before a specific expiration date.
Because of this unique characteristic, options allow traders and investors to design strategies that suit a wide range of market conditions—whether bullish, bearish, or neutral. Through careful strategy selection, one can aim for limited risk with unlimited upside, hedge existing positions, or even profit from sideways markets where prices don’t move much.
This article explores options trading strategies in detail. We’ll cover the building blocks of options, common strategies, advanced combinations, and risk management. By the end, you’ll have a strong foundation to understand how professional traders use options to manage portfolios and generate returns.
Risk Management in Options Trading
Options carry significant risks if misused. Successful traders emphasize:
Position Sizing: Never risk too much on one trade.
Diversification: Spread across multiple strategies/assets.
Stop-Loss & Adjustments: Exit losing trades early.
Implied Volatility (IV) Awareness: High IV increases premiums; selling strategies may be better.

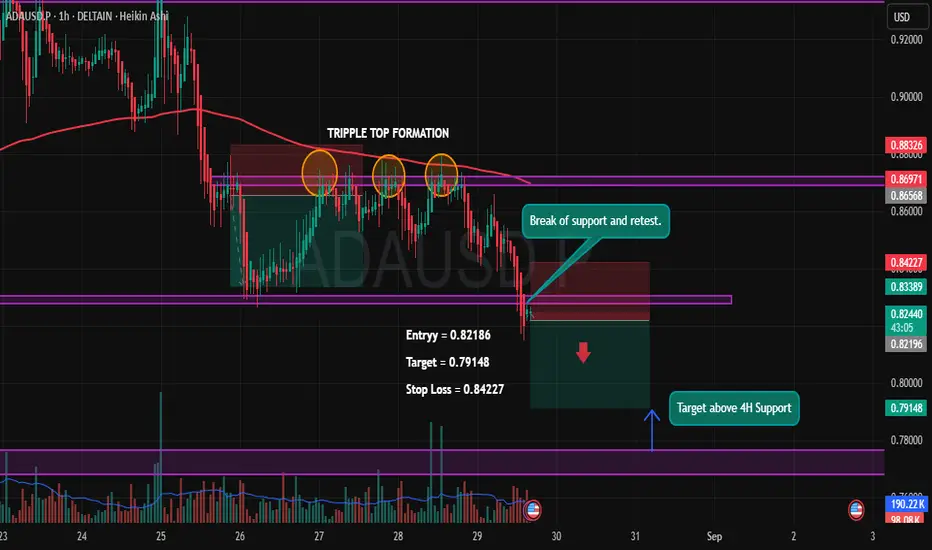
ADA/USDT – Triple Top Breakdown Play🔎 Setup Insight:
ADA has formed a Triple Top pattern near the 0.869 zone, confirming strong rejection from resistance. After multiple failed attempts to break higher, price finally broke down key support and is now retesting it, giving a clean short opportunity.
✨ Trade Plan:
Entry: 0.82186
Target: 0.79148 (Above 4H support zone)
Stop Loss: 0.84227
✅ Reasons for Short Bias:
Triple Top Formation ➝ Strong bearish reversal signal.
Break & Retest of Support ➝ Previous demand now acting as supply.
Confluence with 200 EMA rejection ➝ Trend remains bearish.
Volume Confirmation ➝ Selling volume stronger than buying.
🎯 Targeting the next major support on the 4H timeframe, with a favorable Risk-Reward setup.
⚠️ Disclaimer: This analysis is for educational purposes only and not financial advice. Always manage your risk before entering any trade.
ABDL Price ActionAs of August 29, 2025, Allied Blenders & Distillers Limited (ABDL) is trading around ₹501, showing short-term volatility with some decline from its recent high near ₹540. The stock has delivered impressive returns over the last twelve months, nearly doubling from its 52-week low of ₹279, and rising about 56% over six months and 28% in the last three months. The price-to-earnings ratio stands elevated at 59.4, and the price-to-book ratio is above 9, indicating that growth expectations are currently priced in.
Financially, ABDL maintains a market capitalization of over ₹14,200 crore, reflecting strong investor interest. The company’s quarterly earnings have been stable, but a relatively modest earnings per share means any further rally may require stronger profit growth. Technical indicators suggest the stock is trading in a neutral to slightly oversold territory, with momentum fluctuating but long-term moving averages still supporting the uptrend. Dividend yield is low, showing focus on growth over payouts. The outlook remains cautiously optimistic, with growth-oriented investors watching profitability closely for the next leg up.

Futures & Options (F&O) TradingIntroduction
Futures and Options (commonly known as F&O) are among the most exciting segments of financial markets. They fall under the category of derivatives trading, meaning their value is derived from an underlying asset such as stocks, commodities, currencies, or indices.
Unlike simple buying and selling of shares, F&O trading allows investors to hedge risks, speculate on price movements, and even leverage small capital into big trades. However, it also carries high risk and requires deep understanding.
This guide will cover:
What F&O trading is
How futures work
How options work
Key terms
Strategies used
Advantages & risks
Practical examples
Psychology of F&O trading
Regulations in India
Final thoughts for beginners
By the end, you’ll have a solid foundation in F&O trading.
Part 1: Understanding Derivatives
What are Derivatives?
A derivative is a financial contract whose value depends on the price of an underlying asset. For example, if you buy a derivative linked to Reliance Industries stock, its value will move as Reliance’s stock price moves.
Derivatives can be of many types:
Futures
Options
Forwards
Swaps
In India, the most popular are Futures and Options (F&O).
Part 2: Futures Trading
What are Futures?
A futures contract is an agreement between two parties to buy or sell an asset at a predetermined price on a future date.
Buyer of futures: Agrees to buy the asset in future.
Seller of futures: Agrees to sell the asset in future.
Both are obligated to honor the contract on expiry.
Key Features of Futures:
Standardized contracts – traded on exchanges (like NSE, BSE).
Leverage – You pay only a margin (a fraction of total value).
Settlement – Can be cash-settled or delivery-based.
Expiry dates – Futures have fixed expiry (weekly, monthly, quarterly).
Example of Futures:
Suppose Reliance stock is trading at ₹2,500.
You buy a Reliance Futures contract (lot size 250 shares).
Contract value = ₹2,500 × 250 = ₹6,25,000.
But you don’t pay full amount, only margin (say 15% = ₹93,750).
If Reliance rises to ₹2,600, your profit = (100 × 250) = ₹25,000.
If Reliance falls to ₹2,400, your loss = ₹25,000.
So, futures magnify both profit and loss.
Part 3: Options Trading
What are Options?
Options are more flexible than futures. An option gives the buyer the right, but not the obligation, to buy or sell the underlying asset at a fixed price on or before expiry.
There are two types of options:
Call Option (CE): Right to buy.
Put Option (PE): Right to sell.
Key Terms in Options:
Strike Price: Pre-decided price at which option can be exercised.
Premium: Price paid by buyer to seller of option.
Option Buyer: Has rights, limited risk (loss = premium).
Option Seller (Writer): Has obligation, unlimited risk but limited profit (premium received).
Example of Call Option:
Reliance at ₹2,500.
You buy a Call Option (CE) 2600 strike, expiring in 1 month, paying ₹20 premium.
Lot size = 250. Total premium paid = ₹5,000.
If Reliance goes to ₹2,700 before expiry:
Option value = ₹100 (intrinsic value).
Profit = (100 - 20) × 250 = ₹20,000.
If Reliance stays below ₹2,600, option expires worthless.
Loss = only premium paid (₹5,000).
So, options limit risk for buyers but sellers face higher risk.
Part 4: Comparison – Futures vs Options
Feature Futures Options
Obligation Buyer & seller both obligated Buyer has right, seller has obligation
Risk High (both sides) Limited for buyer, unlimited for seller
Cost Margin required Premium required
Profit Potential Unlimited both ways Unlimited for buyer, limited for seller
Best for Speculation & hedging Hedging, speculation, income strategies
Part 5: Why Trade F&O?
1. Hedging
Investors use F&O to protect portfolios from adverse price movements.
Example: An investor holding Reliance shares can buy a Put Option to protect against downside.
2. Speculation
Traders use leverage to bet on market movements.
3. Arbitrage
Taking advantage of price differences between cash market and F&O.
4. Income Generation
Selling (writing) options to earn premium.
Part 6: Important Concepts in F&O
Leverage & Margin – You control large value with small capital.
Mark-to-Market (MTM) – Futures contracts are settled daily.
Time Decay (Theta) – Options lose value as expiry nears.
Implied Volatility (IV) – Measures expected price swings.
Greeks in Options – Delta, Gamma, Vega, Theta, Rho – help manage risk.
Part 7: Common F&O Strategies
Futures Strategies:
Long Futures – Buy if you expect rise.
Short Futures – Sell if you expect fall.
Options Strategies:
Covered Call – Hold stock + sell call.
Protective Put – Hold stock + buy put (insurance).
Straddle – Buy call + buy put (expect big move).
Strangle – Buy out-of-money call & put.
Iron Condor – Combination to earn premium in sideways market.
Part 8: Risks in F&O Trading
High Leverage Risk – Small moves can wipe out capital.
Time Decay in Options – Value erodes with time.
Volatility Risk – Sudden moves may cause losses.
Liquidity Risk – Some contracts have low trading volume.
Psychological Pressure – High stress and emotions.
Part 9: F&O in India
Introduced in 2000 (NSE).
Most popular: Index Futures & Options (Nifty, Bank Nifty).
Also available: Stock futures, stock options, currency derivatives, commodity derivatives.
Regulated by SEBI (Securities and Exchange Board of India).
Lot Sizes in India
Each F&O contract has a fixed lot size decided by SEBI (e.g., Nifty lot = 50 units).
Expiry Cycle
Index Options: Weekly & monthly expiry.
Stock Options: Monthly expiry.
Part 10: Psychology of F&O Trading
Success in F&O is not just about knowledge, but also about mindset:
Discipline – Stick to stop-loss and plan.
Patience – Wait for right setup.
Emotional Control – Don’t let greed/fear drive decisions.
Risk Management – Never risk more than 1–2% of capital in one trade.
Conclusion
Futures & Options (F&O) trading is a double-edged sword. It offers leverage, hedging, and high profit potential, but also comes with complexity and high risk.
For beginners:
Start with options buying (limited risk).
Learn basic strategies like covered call, protective put.
Always use stop-loss.
Treat F&O as a tool for hedging first, speculation second.
With proper knowledge, discipline, and risk management, F&O can become a powerful addition to an investor’s toolkit.
Trading Psychology & DisciplineIntroduction
In the world of financial markets, traders often focus on technical analysis, fundamental research, algorithms, and news-driven events to make decisions. While these tools are essential, there is one element that is frequently underestimated yet plays a much bigger role in success: trading psychology and discipline.
Trading is not just about numbers, charts, or strategies—it is a game of emotions, mindset, and self-control. Even the most sophisticated strategies fail if the trader cannot control fear, greed, and impulsive behavior. On the other hand, an average trading system can become profitable in the hands of a disciplined and emotionally balanced trader.
This discussion will explore the psychological aspects of trading, the emotional challenges, common behavioral biases, and how discipline can transform a trader’s performance. We’ll also look at techniques and practices to build a resilient trading mindset.
1. The Role of Psychology in Trading
Trading psychology refers to the emotions and mental state that influence how traders make decisions in the market. Unlike professions where skills and experience directly translate into results, trading is unique because psychological factors often override logic.
For example:
A trader may have a solid strategy to exit a position at a 10% profit. But when the time comes, greed makes them hold longer, hoping for more, and the market reverses.
Another trader may see a perfect setup but doesn’t enter the trade because of fear after a previous loss.
This illustrates that psychology can either support or sabotage trading success. Research shows that 80–90% of retail traders lose money consistently—not always because of poor strategies, but due to a lack of discipline and emotional control.
2. Key Emotional Challenges in Trading
Let’s examine the major psychological challenges that traders face.
a) Fear
Fear is the most dominant emotion in trading. It manifests in different ways:
Fear of losing money (not taking a trade).
Fear of missing out (FOMO—jumping into a trade too late).
Fear of being wrong (holding on to losing positions).
Fear often leads to hesitation, early exits, or missed opportunities.
b) Greed
Greed drives traders to:
Overstay in profitable trades.
Over-leverage positions.
Overtrade (taking too many trades in a day).
While the market rewards patience, greed often blinds judgment.
c) Hope
Many traders fall into the trap of hope, especially with losing trades. Instead of cutting losses, they keep hoping the market will reverse in their favor. Hope replaces rational decision-making.
d) Revenge Trading
After a loss, traders sometimes feel the need to recover money immediately. This leads to impulsive trades without proper setups—often resulting in bigger losses.
e) Overconfidence
Success can be as dangerous as failure. After a winning streak, traders may become overconfident, take unnecessary risks, or abandon risk management—leading to devastating drawdowns.
3. Behavioral Biases in Trading
Trading psychology overlaps with behavioral finance, where human biases cloud rational thinking. Some common biases include:
Loss Aversion Bias – The pain of loss is psychologically stronger than the pleasure of gain. Traders avoid booking small losses, leading to bigger ones.
Confirmation Bias – Traders look only for information that supports their trade idea, ignoring opposing signals.
Anchoring Bias – Traders anchor to a certain price level (like the price they bought at) and refuse to sell below it.
Herd Mentality – Following the crowd without analysis, often during market bubbles.
Recency Bias – Giving more weight to recent outcomes rather than long-term performance.
These biases affect judgment and lead to poor decision-making.
4. The Importance of Discipline in Trading
If psychology is the foundation, discipline is the structure that holds a trader’s career together. Discipline in trading means sticking to rules, risk management, and strategies regardless of emotions.
A disciplined trader:
Enters trades only when rules align.
Exits trades at predefined stop-loss or target levels.
Maintains position sizing regardless of emotions.
Accepts losses as part of the business.
Avoids impulsive and revenge trading.
Discipline converts trading from gambling into a professional business.
5. The Mindset of a Successful Trader
Professional traders think differently from amateurs. They focus on process over outcome. Their mindset includes:
Probability Thinking
No trade is guaranteed. Each trade is just one outcome in a series of probabilities. Accepting this reduces emotional pressure.
Detachment from Money
Professionals see money as a tool, not an emotional anchor. They measure success in terms of following their plan, not short-term profits.
Adaptability
Markets change constantly. Disciplined traders adapt rather than stubbornly sticking to failing strategies.
Patience
They wait for high-probability setups rather than forcing trades.
Long-term Focus
Success is measured in months and years, not a single trade.
6. Building Trading Discipline
Discipline is not automatic—it requires conscious practice. Here’s how traders can develop it:
a) Create a Trading Plan
A trading plan defines:
Entry and exit rules.
Position sizing.
Risk-reward ratios.
Markets and timeframes to trade.
Maximum daily/weekly losses.
Without a plan, emotions take over.
b) Use Risk Management
Risk per trade should never exceed 1–2% of capital. Stop-loss orders should be predefined. This ensures survival even during losing streaks.
c) Keep a Trading Journal
A journal helps track:
Why you entered a trade.
Emotions felt during the trade.
What went right/wrong.
Over time, patterns emerge, revealing weaknesses in psychology and strategy.
d) Practice Mindfulness
Mindfulness techniques such as meditation, deep breathing, or visualization help traders stay calm during stressful market conditions.
e) Accept Losses as Normal
Even the best traders lose frequently. What matters is keeping losses small and letting winners run. Accepting losses removes emotional baggage.
f) Avoid Overtrading
Set daily/weekly limits on trades. This prevents emotional exhaustion and impulsive decisions.
7. Practical Techniques to Improve Trading Psychology
Here are actionable steps:
Pre-Market Routine – Spend 10–15 minutes visualizing scenarios, checking news, and calming the mind.
Set Daily Goals – Focus on execution (e.g., “Follow my plan”) rather than monetary goals.
Take Breaks – Step away after a loss or win streak to reset emotionally.
Limit Screen Time – Over-monitoring leads to anxiety. Check setups at predefined times.
Simulation/Backtesting – Helps build confidence in a system before using real money.
Accountability Partner – Sharing trades with another trader builds discipline.
8. Case Studies: Trading Psychology in Action
Case 1: The Fearful Trader
A new trader avoids trades after a big loss. Despite seeing good setups, fear paralyzes action. Over time, opportunities are missed, and frustration builds.
Lesson: Risk management and small position sizing reduce fear.
Case 2: The Greedy Trader
Another trader doubles account quickly during a bull run, but refuses to book profits. Overconfidence leads to leverage, and one market crash wipes out everything.
Lesson: Discipline and humility are essential.
Case 3: The Disciplined Trader
A professional trader takes 40% win rate trades but manages risk with 1:3 reward ratios. Despite losing more trades than winning, account grows steadily.
Lesson: Discipline beats emotions.
9. The Role of Technology and Psychology
Modern trading platforms provide tools like:
Automated trading systems – Reduce emotional interference.
Alerts and stop-loss automation – Enforce discipline.
Analytics dashboards – Help track performance.
But even with technology, psychology remains the deciding factor, since traders often override systems when emotions take over.
10. Long-Term Development of Trading Mindset
Trading psychology is not built overnight. It requires years of consistent practice. Key long-term practices include:
Reading trading psychology books (e.g., Trading in the Zone by Mark Douglas).
Engaging in regular self-reflection.
Accepting that markets are uncertain.
Developing resilience to handle both drawdowns and success.
The goal is to become a trader who is calm in chaos, rational under stress, and disciplined under temptation.
Conclusion
Trading psychology and discipline are the invisible forces behind every successful trader. Strategies and indicators provide the “how,” but psychology answers the “why” and “when.”
Fear, greed, and biases sabotage results.
Discipline enforces consistency and professionalism.
A strong trading mindset focuses on probabilities, risk management, and patience.
Ultimately, trading is not a battle with the market—it is a battle with oneself. Mastering psychology and discipline transforms trading from an emotional rollercoaster into a structured, profitable business.
As the saying goes:
“In trading, your mind is your greatest asset—or your biggest enemy. The choice is yours.”

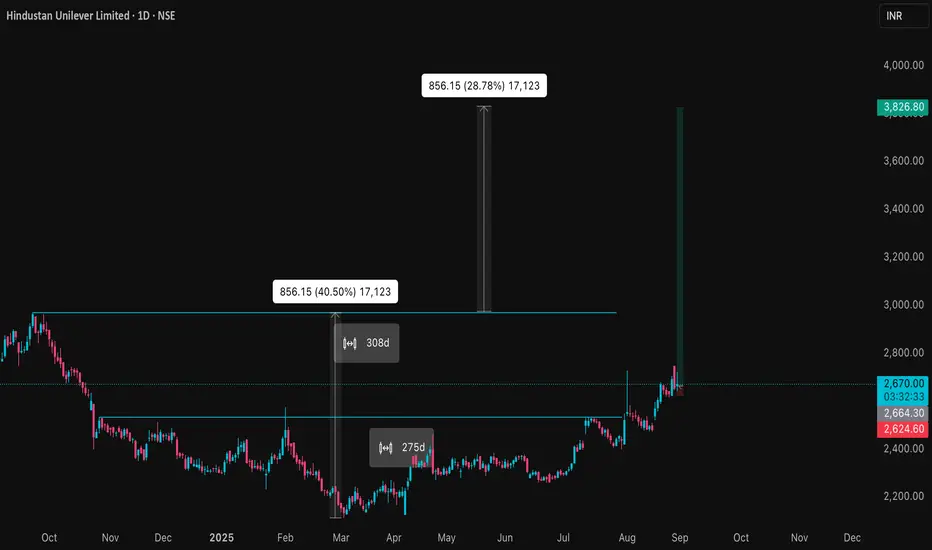
HINDUNILVR Price ActionHindustan Unilever Limited (HINDUNILVR) has exhibited a stable but range-bound price trend in late August 2025, trading near ₹2,557 per share. The stock remains a defensive favorite among institutional investors, reflecting its leadership position in the fast-moving consumer goods (FMCG) sector. Over the past few months, the price has oscillated between ₹2,445 and ₹2,630, indicating consolidation as the market weighs modest volume growth against persistent margin pressures.
Financially, HINDUNILVR continues to report robust revenues and steady profits, although volume growth has faced challenges due to subdued rural demand and inflationary impacts on input costs. The company retains a healthy balance sheet, low debt levels, and a solid dividend payout record, supporting its long-term investment appeal. Its premium valuation is driven by the brand’s market dominance and expectation of renewed growth as consumer demand normalizes.
Technically, the stock has bounced off major support levels, with moving averages indicating a neutral-to-positive bias. Momentum oscillators suggest the potential for mild upward movement if broader market sentiment improves, but significant upside may be capped unless there is a visible catalyst in earnings or sector sentiment. Overall, Hindustan Unilever remains a steady compounder suited for conservative, long-term portfolios, though near-term price appreciation may be limited without fresh growth triggers.
BERKSHIRE HATHAWAY stock updateBERKSHIRE HATHAWAY liquidity grab on 462$. bullish scenario from. take long posistion
premium(resistance)=542$ .
target is 542$

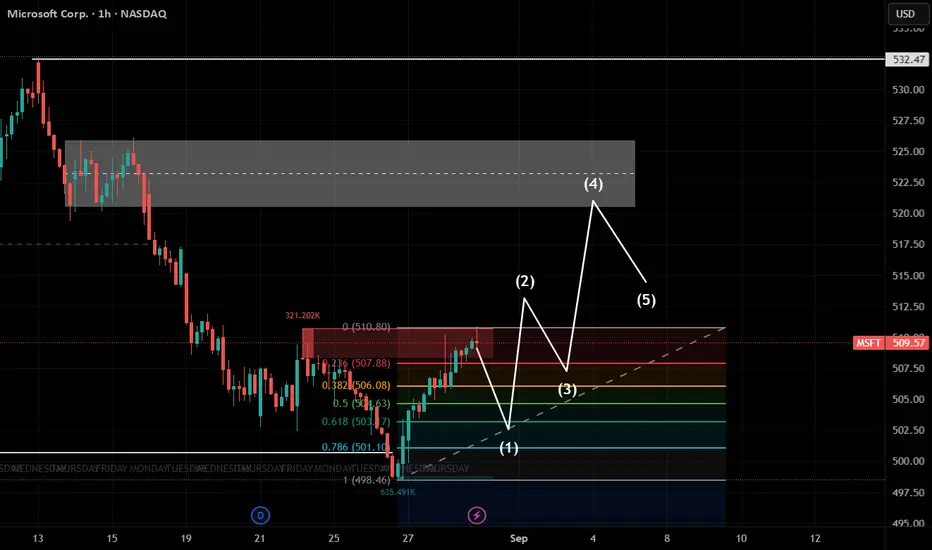
microsoft stock updatemicrosoft stock grab previous liquidity 501$. stock in demand zone aera.to take long position wait for retracement area and take. premium(resistance)area is 520$ to 532$
1st target = 520$
2nd target = 532 $
BTCUSD Long Setup – Trend Continuation Play📌 Trade Details
Entry: 113,256.5
Target: 115,317.7
Stop Loss: 111,874.4
📊 Trade Rationale
✅ Trend Continuation: Price has respected the ascending trendline multiple times, indicating strong buyer interest.
✅ Break of Structure: Recent higher highs and higher lows confirm bullish momentum.
✅ Support Flip: Zone around 113,050 acted as resistance earlier and is now being retested as support.
✅ Volume Confirmation: Rising volume supports the bullish continuation bias.
✅ Clean Risk–Reward: With SL below structure and TP near major resistance, this setup offers a favorable RRR.
🎯 Target Zone
The target aligns with the next strong supply zone at 115,300+, where sellers may re-enter.
⚠️ Risk Management
Always size positions wisely, as crypto remains highly volatile. Protect your capital first.
Disclaimer:
This idea is for educational purposes only and not financial advice. Do your own research before entering any trade.

SBI Price Action & Option Opportunity State Bank of India (SBI) is once again respecting its well-defined range on the daily chart, with price consolidating between the ₹780 and ₹840 support-resistance zone. Today, SBI closed at ₹807.85, down -1.05%, continuing its oscillation within this horizontal channel.
The chart shows potential for a bounce from the lower boundary near ₹800, with a dotted path illustrating a possible move back toward resistance. Traders may look for confirmation of reversal before initiating new long trades as the range continues to hold.
On the options side, the 30 SEP 2025 PUT 810 contract surged 41.67% today, closing at ₹13.60. This strike has given a move of ₹2.75 (over 20%) recently. This sudden spike suggests rising bearish sentiment or hedging activity, but also hints at possible premium profit-taking if SBI holds above support.
Trading Plan
Monitor SBI near ₹800 for signs of reversal or breakdown.
Long positions can target ₹840 if support holds, with stops below ₹780.
PUT options holders should watch for profit booking if a bounce appears.

Part 2 Master Candlestick PatternAdvanced Strategies for Experienced Traders
If you’ve mastered the basics, here are some advanced setups:
Bull Call Spread → Buy 1 Call, Sell higher strike Call.
Bear Put Spread → Buy 1 Put, Sell lower strike Put.
Butterfly Spread → Profit from low volatility (range-bound market).
Calendar Spread → Buy long-term option, sell short-term option.
These strategies help balance risk vs reward.
SEBI Regulations & Margins
In India, SEBI ensures options trading is safe:
Option sellers must keep high margins.
Brokers must collect upfront premiums.
Intraday exposure limits are monitored.
This protects retail traders from excessive risks.

Part 6 Institutional Trading The Greeks: The Math Behind Options
Advanced traders use Greeks to understand risks.
Delta → Sensitivity of option price to stock price movement.
Gamma → Rate of change of Delta.
Theta → Time decay (how much option loses daily).
Vega → Sensitivity to volatility.
Rho → Sensitivity to interest rates.
Example:
A Call with Delta = 0.6 → If stock rises ₹10, option rises ₹6.
Theta = –5 → Option loses ₹5 daily as time passes.
Options vs Futures
Both are derivatives, but with a key difference:
Futures → Obligation to buy/sell at a price.
Options → Right, not obligation.
Example:
Futures are like booking a hotel room—you must pay whether you stay or not.
Options are like paying for a movie ticket—if you don’t watch, you lose only ticket price.

Part 3 Institutional Trading Types of Option Traders
There are mainly four types of participants:
Option Buyers (Long Call / Long Put)
Pay premium.
Limited loss (premium), unlimited profit.
Usually retail traders.
Option Sellers (Short Call / Short Put)
Receive premium.
Limited profit (premium), unlimited loss.
Usually big institutions (because margin required is high).
This is why buyers dream, sellers earn is often said in option markets.
Why Trade Options?
Options are powerful because they allow:
Leverage → Small premium controls large value.
Hedging → Protect portfolio from crashes (insurance).
Speculation → Bet on direction, volatility, or time decay.
Income → Selling options to earn steady premium (if managed wisely).

Waaree Energies Limited - Near BreakoutIncorporated in December 1990, Waaree Energies Limited is an Indian manufacturer of solar PV modules with an aggregate installed capacity of 12 GW. WEL has five solar module manufacturing facilities in India, with international presence.
Fundamentals:
Market Cap: ₹ 97,343 Cr.
Promoter holding: 64.3 %
FII holding: 2.68 %
DII holding: 2.86 %
Public holding: 30.2 %
Debt: ₹ 1,199 Cr.
Debt 3Years back: ₹ 363 Cr.
Stock looks good on long term holding. Above 3740, All time high breakout and can give more upside movement. Targets are in the chart.

BNB/USDT – Bullish Breakout Trade Idea✅ Entry: 871.564
🎯 Target: 890.455
⛔ Stop Loss: 862.304
🔎 Trade Rationale:
Ascending Triangle Breakout – Price has respected the rising trendline and finally broken above the neckline resistance, signaling bullish continuation.
Volume Confirmation – A notable increase in buying volume supports the breakout strength.
Resistance Flip – The previous supply zone around 870 has turned into support, adding confluence.
📊 With a strong bullish structure and favorable RRR, this setup aims to capture the next push towards 890 zone.
⚠️ Disclaimer: This is not financial advice. Always do your own research and manage risk before trading.

Usha Martin LtdDate 28.08.2025
Usha Martin
Timeframe : Weekly Chart
About
(1) Usha Martin Ltd is primarily engaged in manufacture and sale of steel wires, strands, wire ropes, cords, related accessories
(2) It ranks among the top five manufacturers in the sector
Revenue Mix
Product-Wise
(1) Wire Rope: 73% in H1FY25 vs 67% in FY23
(2) LRPC: 10% in H1FY25 vs 15% in FY23
(3) Wire & Strand: 9% in H1FY25 vs 10% in FY23
(4) Others: 8%
End-User Segment:
(1) Engineering: 20%
(2) Oil & Offshore: 20%
(3) Crane: 16%
(4) Construction & Infrastructure: 12%
(5) Elevator: 9%
(6) Others: 23%
Geography-Wise:
(1) India: 45%
(2) Europe: 25%
(3) Asia Pacific: 13%
(4) Middle East & Africa: 9%
(5) America: 8%
Valuations
(1) Market Cap ₹ 11,629 Cr
(2) Stock P/E 28.8
(3) ROCE 18.8 %
(4) ROE 15.8 %
(5) OPM 17%
(6) Sales Growth 9.20%
(7) Promoter 42.45%
(8) DII 11.06%
(9) FII 14.29%
Regards,
Ankur

GIFT Nifty & Global Market LinkageIntroduction
The Indian stock market has undergone a remarkable transformation in the past two decades. From being a largely domestic-focused equity market, India has steadily moved into the global financial arena. A very important step in this journey was the creation of GIFT City (Gujarat International Finance Tec-City) and the launch of GIFT Nifty, which has become India’s bridge to global markets.
GIFT Nifty is not just a derivative product; it is a symbolic step that integrates India’s financial markets more closely with global capital flows. At the same time, it creates a transparent and efficient platform for international investors to participate in India’s growth story.
But to fully understand its importance, one needs to see how GIFT Nifty is linked to global markets. Markets today are interconnected like never before—movements in Wall Street, European bourses, or Asian markets ripple across Indian indices. GIFT Nifty acts as a mirror and predictor of India’s domestic market sentiment while being shaped by international factors such as U.S. Fed policy, global interest rates, oil prices, and geopolitical risks.
This detailed explanation will cover:
What is GIFT Nifty?
The journey from SGX Nifty to GIFT Nifty.
The significance of GIFT City as India’s international financial hub.
GIFT Nifty’s role in India’s global financial integration.
Global market linkages – how global events influence GIFT Nifty.
Correlations with U.S., Europe, and Asia-Pacific markets.
Opportunities and challenges ahead.
The future of GIFT Nifty in shaping India’s financial markets.
1. What is GIFT Nifty?
GIFT Nifty is a derivative contract (futures and options) based on the Nifty 50 index, but traded on the NSE International Exchange (NSE IX) located in GIFT City, Gujarat.
It allows foreign investors to participate in India’s benchmark index without going through complex registration processes like FPI (Foreign Portfolio Investor) rules in the domestic market.
The contracts are USD-denominated, meaning global traders can easily buy and sell without worrying about INR conversion.
GIFT Nifty runs for almost 21 hours a day, covering Asian, European, and U.S. trading hours—making it one of the most globally accessible contracts linked to India.
In short, GIFT Nifty provides a real-time pulse of how global investors view India, almost around the clock.
2. From SGX Nifty to GIFT Nifty
Earlier, India’s Nifty futures were traded heavily on the Singapore Exchange (SGX), called SGX Nifty.
For nearly two decades, SGX Nifty was the main offshore gateway for international investors to take exposure to Indian equities.
Traders around the world would look at SGX Nifty quotes to predict the opening direction of the Indian stock market.
In fact, SGX Nifty became so popular that even Indian retail traders tracked it overnight to guess how the domestic Nifty would open.
However, in 2018, NSE and SGX had a legal tussle over licensing rights. Finally, in 2022, both parties agreed to shift all SGX Nifty contracts to GIFT City under a “Connect” model.
Now, SGX Nifty is history, and GIFT Nifty is the only official offshore Nifty derivative product. This transition brought trading volumes back under Indian jurisdiction, strengthening India’s position as a global financial hub.
3. GIFT City: India’s International Financial Hub
GIFT City is a special economic zone (SEZ) located in Gandhinagar, Gujarat. Its vision is to create a global financial and IT services hub on par with Singapore, Dubai, and London.
GIFT City offers tax incentives, world-class infrastructure, and a favorable regulatory environment.
The NSE International Exchange (NSE IX) operates here, hosting products like GIFT Nifty.
Banks, insurers, brokers, and global funds are setting up units in GIFT City to tap both Indian and global opportunities.
For India, GIFT City represents a strategic move: instead of foreign investors trading Indian products overseas, they now trade in India itself. This not only boosts financial flows but also gives regulators more oversight.
4. GIFT Nifty’s Role in Global Financial Integration
GIFT Nifty is more than just a futures contract—it symbolizes India’s growing integration with global markets.
Here’s how:
International Accessibility: Investors in New York, London, Hong Kong, or Dubai can trade GIFT Nifty almost anytime, making India’s equity market more globally visible.
Price Discovery: Since trading happens across time zones, GIFT Nifty reflects both global and domestic investor sentiment in near real time.
Hedging Tool: Foreign portfolio investors (FPIs) can hedge their India equity exposure more efficiently.
Liquidity & Volumes: Global participation in GIFT Nifty brings higher liquidity, tighter spreads, and deeper markets.
5. Global Market Linkages – How World Events Affect GIFT Nifty
The beauty (and complexity) of GIFT Nifty lies in its sensitivity to global developments. Because it trades almost continuously, it reacts instantly to global news.
Some of the most important global factors influencing GIFT Nifty are:
U.S. Federal Reserve Policy
Interest rate hikes or cuts in the U.S. directly impact global equity flows.
A hawkish Fed (raising rates) usually hurts risk assets like Indian equities.
GIFT Nifty futures often fall sharply after Fed announcements.
Global Economic Data
U.S. inflation, jobs data, GDP growth, and corporate earnings set the tone for global risk appetite.
Similarly, China’s growth numbers and Europe’s economic indicators affect global sentiment.
Oil Prices
India imports more than 80% of its crude oil needs. A rise in global oil prices usually weakens Indian equities.
GIFT Nifty reacts immediately to Brent crude movements.
Currency Fluctuations
A strong U.S. dollar and weak rupee reduce foreign investor returns.
GIFT Nifty often mirrors INR-USD volatility.
Geopolitical Risks
Wars, conflicts, sanctions, or supply-chain disruptions cause risk-off sentiment globally.
GIFT Nifty, like other emerging market indices, tends to fall under such conditions.
Global Equity Trends
If Wall Street has a strong rally, GIFT Nifty usually trades higher in the U.S. session.
If Asian markets crash early morning, GIFT Nifty shows weakness in the Asian session.
6. Correlation with Global Markets
Let us break down the interconnectedness between GIFT Nifty and major global markets.
a. Link with U.S. Markets (Wall Street)
The U.S. markets (Dow Jones, S&P 500, Nasdaq) are the most influential for GIFT Nifty.
After U.S. closing, GIFT Nifty in the U.S. time zone reacts sharply to tech earnings, Fed speeches, or macro data.
Example: If Nasdaq falls 2% overnight, GIFT Nifty usually opens lower in the Asian session.
b. Link with European Markets
During European hours, GIFT Nifty trades alongside FTSE (UK), DAX (Germany), and CAC (France).
Eurozone recession fears or ECB rate moves affect GIFT Nifty sentiment.
c. Link with Asian Markets
In the morning, GIFT Nifty trades in sync with Nikkei (Japan), Hang Seng (Hong Kong), and Shanghai Composite (China).
A sell-off in China often triggers weakness in GIFT Nifty.
Conversely, optimism in Asian markets boosts Indian sentiment.
7. Opportunities Created by GIFT Nifty
Better Price Discovery for India’s Market
Instead of relying on SGX Nifty, Indian markets now have their own offshore derivative hub.
Boost to GIFT City Ecosystem
Trading volumes, jobs, and financial services activity in GIFT City have surged.
Global Participation in India’s Growth
India is one of the fastest-growing economies. GIFT Nifty allows global funds to participate directly.
Hedging Benefits for FPIs
Foreign investors can protect themselves against Indian market volatility.
Strengthening Rupee’s Global Role
Even though contracts are in USD, India gains visibility as a financial center.
8. Challenges Ahead
Despite its success, GIFT Nifty faces challenges:
Liquidity Migration: Ensuring that volumes remain strong compared to global exchanges.
Awareness: Many global traders still see SGX Nifty as their reference, though it no longer exists.
Competition: Other financial hubs like Singapore and Dubai remain strong competitors.
Volatility Risk: High global interconnectedness means sudden shocks (like COVID-19 or geopolitical events) affect GIFT Nifty instantly.
9. The Future of GIFT Nifty
Looking forward, GIFT Nifty is set to become a cornerstone of India’s financial globalization.
Volumes are rising every month as more global institutions migrate to GIFT City.
New products (like GIFT Bank Nifty, sectoral derivatives, ETFs) may be introduced.
India’s inclusion in global bond and equity indices will further increase offshore demand.
Over the next decade, GIFT City could evolve into a mini-Singapore for Asia.
Conclusion
GIFT Nifty is more than just a trading contract—it is a symbol of India’s financial maturity. By shifting from SGX to GIFT City, India ensured that its financial products are traded on its own soil, strengthening sovereignty and transparency.
At the same time, GIFT Nifty remains deeply connected with global markets. Whether it’s the U.S. Fed, crude oil prices, China’s slowdown, or geopolitical tensions, GIFT Nifty reflects the pulse of global investor sentiment toward India in real time.
In a world where capital moves at the speed of light, GIFT Nifty serves as India’s window to the world and the world’s window to India. Its success will not only strengthen India’s equity markets but also position GIFT City as a major international financial hub in the decades to come.

Stock Analysis: Buying Opportiunity in Gravita India Ltd.?.Introduction:
Gravita India Ltd is one of the largest lead producer in India. The company's business is organized across four specialized verticals: Lead Recycling (flagship), Aluminum recycling, Plastic recycling and Turnkey projects.
The company also has expertise in the recycling of used batteries, cable scrap/other Lead scrap, Aluminum scrap, Plastic scrap, etc.
Fundamentals:
Market Cap: ₹ 12,200 Cr.;
Stock P/E: 36.0 (Ind. P/E: 16.55) 👎;
ROCE: 21.5% 👍; ROE: 21.2% 👍;
3 Years Sales Growth: 20% 👍
3 Years Compounded Profit Growth: 30% 👍
3 Years Stock Price CAGR: 74% 👍
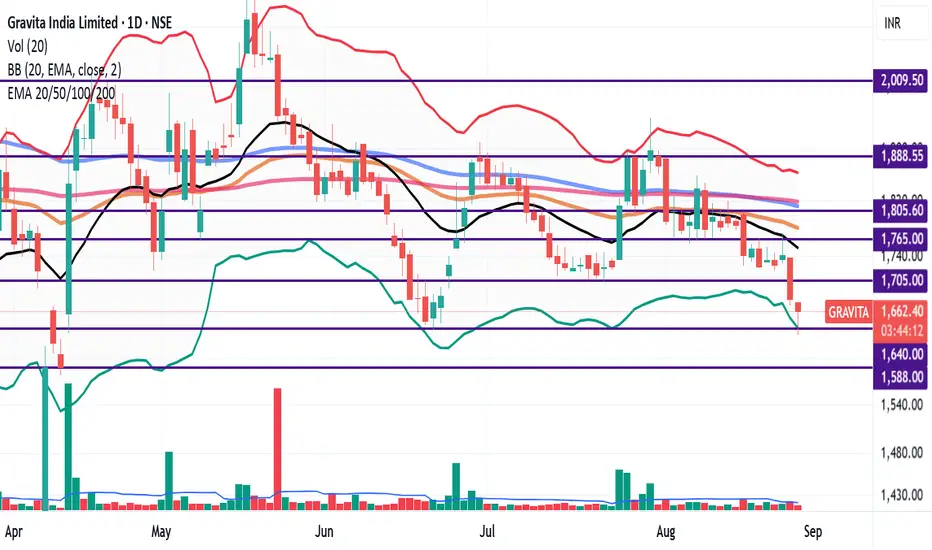
Technicals:
Gravita trading below all key EMAs like 20 EMA(Black Line), 50 EMA (Orange Line), 100 EMAs (Blue Line) and 200 EMA (Pink line).
The stock exhibits a strong Bearish Momentum - Below Short, Medium and Long Term Moving Averages.
The stock has Superior Financial Strength, High Growth Trend Stock Priced at High Valuations.
Resistance levels: 1705, 1765, 1808
Support levels: 1640, 1588
Note: As per technical analysis, downside risk is minimum, and upside potential is huge.
Research Recommendations: Axis Securities sees 40% upside potential 🔥
Key Factors that could guide the growth story:
Capacity Rampup on track - Current capacity to see an addition of 1L MTPA by year end and 7L MTPA by FY28.
Volume growth in Lead and Aluminium - Strong performance in Q1 was majorly due to 96% YoY jump in volumes of aluminium and 10% YoY increase in lead.
Growth to kick from H2FY26 - Company is targeting 25% volume CAGR and 35% profitability CAGR in long term. The majority of volume growth (15-16%) would be from existing capacity while 8-10% from new capacity addition.
just wait bank niftydont enter bank nifty still bearish wait for demand zone still price going to their

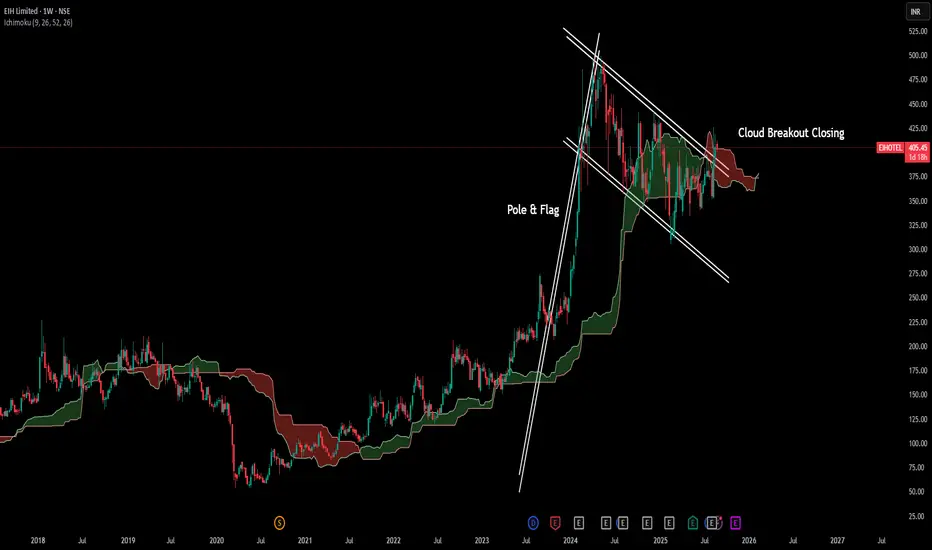
EIH LtdDate 27.08.2025
EIH
Timeframe : Weekly Chart
Technical Remark :
(1) Buy Above 412
(2) Sell Below 401
(3) Weekly Candle spinning Top
(4) Breakout Closing Pole & Flag + Ichimoku Cloud
Fundamental Remarks :
Pioneer of Luxury Hotels in India
(1) Oberoi
(2) Trident
(3) Maidens
Hotels
(1) Domestic Keys : 3,772 keys across Oberoi, Trident, and Maidens brands.
(2) International Keys : 497 under The Oberoi Brand
Pipeline Project
(1) Expansion plans include 20 properties
(2) Aiming 1,350 keys by 2029 (11 domestic and 9 international)
Additional Businesses
(1) Air Charter Services
(2) Car Rental through a joint venture (AVIS India Mobility Solutions)
(3) Mixed-use developments, including retail and F&B spaces
Key Data Points
Owned Hotels
(1) ARR ₹16,940
(2) Occupancy % 73%
(3) RevPAR ₹12,364
Managed Hotels
(1) Average Daily Rate ₹16,398
(2) Occupancy 72%
(3) RevPAR ₹11,807
Zero Debt and Higher Asset Base
(1) Has total assets of 5267 Crs
(2) Zero debt
(3) The company was cash-positive with ~Rs. 711 Crs
Key Valuations
(1) Stock PE 32
(2) ROCE 23.4%
(3) ROE 18%
(4) OPM 37.4%
(5) Sales Growth 9.86%
(6) Profit Growth 23.55%
Regards,
Ankur
KNR heat exchanger Financial --->
Business-
Makes heat exchangers & coils for AC, refrigeration, cold storage, data centers + new products for railways & industrial cooling.
Exports-
Growing fast (Canada, EU, UAE); target 30–35% of sales by FY26.
Growth Drivers-
New Railway business: Got approval, delivered first 10 radiators.
Capacity expansion: New subsidiary plant (Neemrana), 6× bigger, to start in Q2 FY26.
PLI Incentive: ₹141 Cr approved under government scheme (extra income support).
Exports: Targeting US/EU/Canada with AHRI-certified lab tie-up.
ERP & Solar: SAP Cloud system live; solar power to cut costs
High-growth niche player, but stock is expensive. Big upside if exports + Railways + PLI click, downside if margins or execution slip.
----Technical ----
Entry - 907( current level)
Sl - 833( 9% around risk)
Target - just trailing with avg sma/ema

Part 2 Support ans ResistanceAdvantages of Options
High leverage (small money → big exposure).
Flexibility (profit in up, down, or sideways markets).
Risk defined for buyers (can lose only premium).
Useful for hedging portfolios.
Risks of Options
Time decay: Value decreases as expiry approaches.
High leverage can cause big losses (especially for sellers).
Complexity: Needs knowledge of Greeks, volatility, etc.
Emotions: Options move fast → fear & greed affect traders.
Options Greeks (Advanced but Important)
The “Greeks” help measure how option prices move with market factors:
Delta → Change in option price vs stock price.
Gamma → Rate of change of Delta.
Theta → Time decay (how much premium falls daily).
Vega → Impact of volatility on premium.
Rho → Impact of interest rates.
👉 Example: If an option has Theta = -10, it means the premium will lose ₹10 per day (if all else same).
