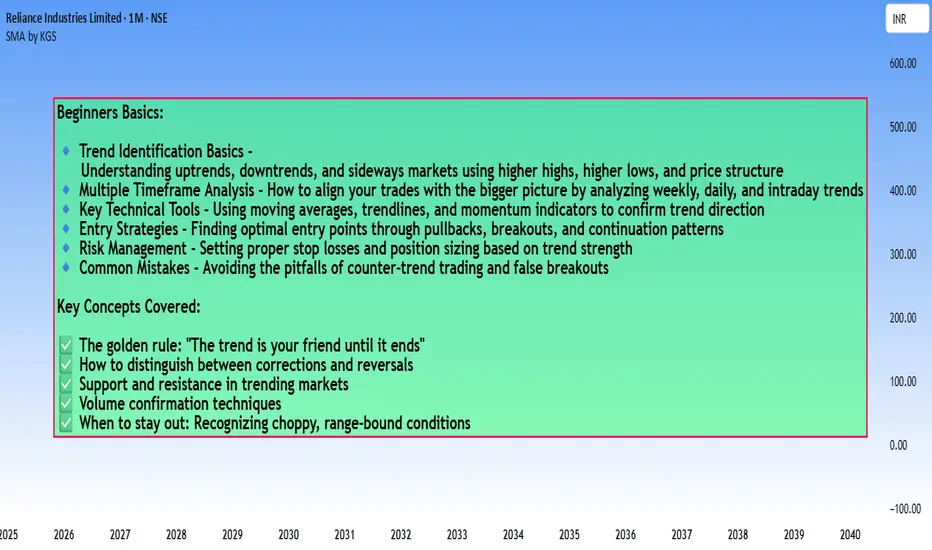
How to trade in the Right Trend - Beginners guide
How to Identify a Trend in a Chart?
Here's a practical breakdown of trend identification methods:
1. Price Structure Method (Most Fundamental)
Uptrend:
- Series of Higher Highs (HH) and Higher Lows (HL)
- Each peak is higher than the previous peak
- Each trough is higher than the previous trough
Downtrend:
- Series of Lower Highs (LH) and Lower Lows (LL)
- Each peak is lower than the previous peak
- Each trough is lower than the previous trough
Sideways/Range:
- Price oscillates between horizontal support and resistance
- No clear higher highs/lows or lower highs/lows
2. Moving Averages
Simple Rules:
- Price consistently above MA = Uptrend
- Price consistently below MA = Downtrend
- Price crossing back and forth = No clear trend
Popular MAs:
- 20 EMA (short-term)
- 50 SMA (medium-term)
- 200 SMA (long-term)
Golden Cross/Death Cross:
- 50 MA crosses above 200 MA = Bullish trend signal
- 50 MA crosses below 200 MA = Bearish trend signal
3. Trendline Method
Drawing Trendlines:
- Uptrend: Connect at least 2 higher lows with a straight line
- Downtrend: Connect at least 2 lower highs with a straight line
- The more touches, the stronger the trendline
- Price respecting the trendline confirms trend strength
4. Multi-Timeframe Analysis
The Complete Picture:
- Weekly chart: Overall market direction
- Daily chart: Intermediate trend
- 4H/1H chart: Entry timing
Rule: Always trade in the direction of the higher timeframe trend
#5. Indicators for Confirmation
ADX (Average Directional Index):
- Above 25 = Strong trend
- Below 20 = Weak/no trend
- Doesn't show direction, only strength
MACD:
- Histogram above zero = Uptrend
- Histogram below zero = Downtrend
- Crossovers signal potential trend changes
RSI:
- Consistently above 50 = Uptrend
- Consistently below 50 = Downtrend
6. Volume Confirmation
Healthy Trends Show:
- Rising volume on moves in trend direction
- Declining volume on corrections/pullbacks
- Volume spikes at breakout points
Quick Checklist for Trend Identification:
✅ Strong Uptrend:
- Higher highs and higher lows
- Price above rising moving averages
- Valid upward trendline intact
- ADX above 25
- Increasing volume on rallies
✅ Strong Downtrend:
- Lower highs and lower lows
- Price below falling moving averages
- Valid downward trendline intact
- ADX above 25
- Increasing volume on declines
⚠️ No Clear Trend (Stay Out):
- Choppy price action
- MAs flat or intertwined
- ADX below 20
- Price between support/resistance
Common Beginner Mistakes:
❌ Looking at only one timeframe
❌ Ignoring the bigger picture
❌ Trading every small wiggle as a "trend"
❌ Not waiting for confirmation
❌ Confusing corrections with reversals
Pro Tips:
💡 **The 3-Touch Rule:** A trend becomes more reliable after price respects a trendline at least 3 times
💡 **Trend is Your Timeframe:** What's an uptrend on daily might be a pullback on weekly
💡 **When in Doubt, Zoom Out:** Higher timeframes show the true direction
💡 **Trade WITH the trend, not against it:** Counter-trend trades have lower probability
**Remember:** Trend identification isn't about being perfect - it's about being on the right side of the market more often than not. Start with the basics (higher highs/lows), then add confirmation tools as you gain experience.
More updates with examples and Explanation on individual topics in a easy way to understand.
Moving Averages
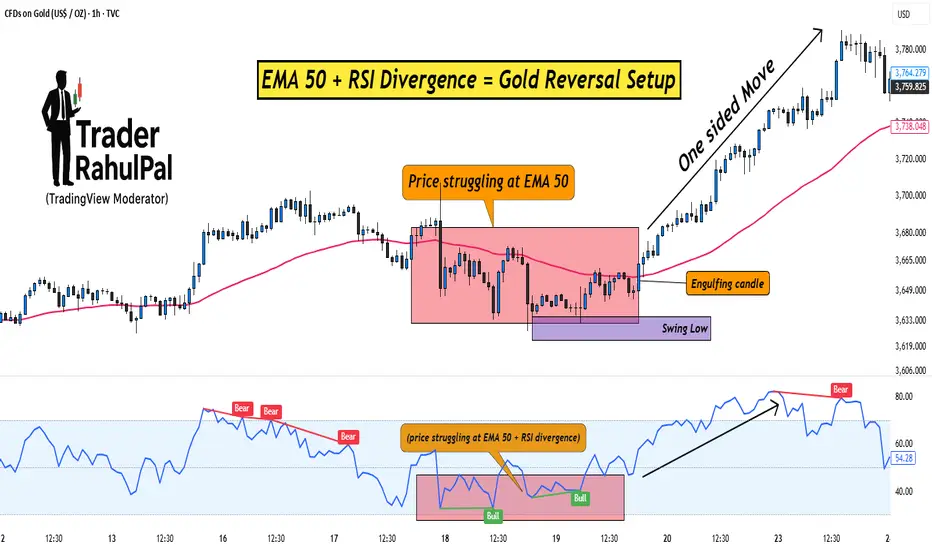
EMA 50 + RSI Divergence = Gold Reversal Setup!Hello Traders!
Gold often makes sharp one-sided moves, trapping traders who enter too late. But if you know how to combine a simple moving average with a momentum indicator, you can spot high-probability reversal setups.
One such method is using the EMA 50 together with RSI Divergence . Let’s break down how it works.
1. Why EMA 50?
The 50-period EMA acts as a dynamic trend filter.
When gold trades above it, the short-term trend is bullish; below it, bearish.
Price often retests the EMA 50 during pullbacks, making it a key level to watch for reversals.
2. What is RSI Divergence?
Divergence happens when price makes a new high/low, but RSI doesn’t confirm it.
Example: Price makes a higher high, but RSI makes a lower high → bearish divergence.
This signals that momentum is weakening, even if price is still moving strongly.
3. Combining EMA 50 with RSI Divergence
First, check where price is relative to EMA 50.
Next, look for divergence on RSI near that zone.
If both align (price struggling at EMA 50 + RSI divergence), chances of a reversal increase sharply.
4. Entry & Risk Management
Wait for a confirmation candle near EMA 50 (like engulfing or pin bar).
Place stop loss just above recent swing high/low.
Target the next support/resistance zone for exits.
Rahul’s Tip:
Don’t use divergence alone, combine it with EMA 50 for structure and you’ll filter out most false signals. This setup works best on higher timeframes like 1H or 4H for gold.
Conclusion:
EMA 50 gives you the trend filter, and RSI divergence reveals momentum weakness.
Together, they form a reliable reversal setup that helps you enter gold trades at the right time instead of chasing moves.
This Educational Idea By @TraderRahulPal (TradingView Moderator) | More analysis & educational content on my profile
If this post gave you a new setup idea, like it, share your thoughts in comments, and follow for more practical trading strategies!
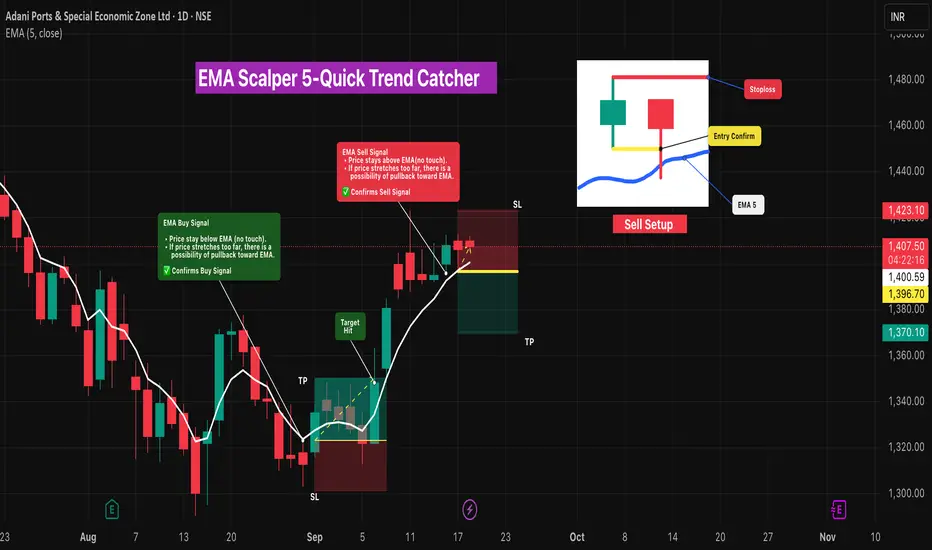
EMA Scalper 5-Quick Trend Catcher🔎 Intro / Overview
This idea uses a single EMA (Length 5) as a trend confirmation tool.
- When price stays below EMA (no touch), it signals bullish continuation.
- When price stays above EMA (no touch), it signals bearish continuation.
If price stretches too far from EMA, expect a possible pullback toward the line.
This EMA Scalping Strategy focuses on quick entries and exits 🎯.
- Best suited for intraday scalping where small, quick moves are captured. ⚡
___________________________________________________________
📌 How to Use
- In a downtrend , when price stays far below EMA(5) with no touch, then the next candle breaks the previous high → immediate Buy entry .
- In an uptrend , when price stays far above EMA(5) with no touch, then the next candle breaks the previous low → immediate Sell entry .
- EMA acts as a fast trend filter, confirming momentum while defining risk–reward levels.
- Once the signal is confirmed, entry is validated only if the next candle breaks the price level — otherwise, the signal is devalidated.
___________________________________________________________
🎯 Trading Plan
- Entry → When the next candle breaks the previous candle’s high , enter long (for immediate Buy).
- Stoploss → Swing Low for Buy / Swing High for Sell.
- Target → 1R (equal to stop distance).
___________________________________________________________
📊 Chart Explanation
ADANIPORTS
1️⃣ Buy Signal →
- Entry @ 1323.15
- Stoploss @ 1301.40
- Target @ 1345.70 → 🎯 Target Hit
2️⃣ Sell Signal →
- Entry @ 1396.70
- Stoploss @ 1423.10
- Target @ 1470.10
Trade continue in live
___________________________________________________________
👀 Observation
- EMA(5) gives fast and responsive trend signals.
- Works best in strong trending markets.
- False signals may occur in choppy sideways markets — use structure confirmation.
___________________________________________________________
❗ Why It Matters?
- Provides clear Buy/Sell confirmation with less lag.
- Defines structured entry, SL, and TP rules.
- Simple, rule-based system to avoid emotional trading.
___________________________________________________________
🎯 Conclusion
The EMA(5) Signal Strategy is a simple yet effective way to confirm trend and capture moves.
By combining breakout entries with disciplined SL/TP, traders can maintain risk–reward balance and trail winners effectively.
🔥 Patterns don’t predict. Rules protect. 🚀
___________________________________________________________
⚠️ Disclaimer
📘 For educational purposes only.
🙅 Not SEBI registered.
❌ Not a buy/sell recommendation.
🧠 Purely a learning resource.
📊 Not Financial Advice.
How 21 EMA saves you from market correction?Green colour - 21 EMA
Blue colour - 50 EMA
The leaders during this time become choppy

Hammer Candlestick Reversals - Bullish & Bearish Setups🔹 Intro / Overview
In this idea, we focus on the Hammer candlestick pattern — both Bullish and Bearish variations.
The Hammer is a powerful reversal signal formed with a small body, a long shadow, and defined highs/lows.
When combined with EMA High–Low Band Confirmation and swing structure, it creates rule-based trading opportunities with clear validation and devalidation rules.
---
📖 Bullish & Bearish Hammer Intro
🟢 Bullish Hammer → Appears after a downtrend / at swing low . Buyers step in strongly, rejecting lower prices.
- EMA Band should be above the candle.
- Candle High = Validation line.
- Candle Low = Devalidation line.
- Entry → Close above the High.
- Stop-Loss → Candle Low.
- Target → 1x risk, with remaining lots trailed (ATR, Fibonacci, Box Trailing).
🔴 Bearish Hammer → Appears after a uptrend / at swing high . Sellers take control after rejecting higher prices.
- EMA Band should be below the candle.
- Candle Low = Validation line.
- Candle High = Devalidation line.
- Entry → Close below the Low.
- Stop-Loss → Candle High.
- Target → 1x risk, with remaining lots trailed.
---
📌 How to Use
🟢 Bullish Hammer Spotted
- Validation → Close above the Hammer’s high.
- Devalidation → Close below the Hammer’s low. (before validation)
- SL → Hammer Low.
- Target → 1x risk, remaining lots trail with ATR/Fibonacci.
🔴 Bearish Hammer Spotted
- Validation → Close below the Hammer’s low.
- Devalidation → Close above the Hammer’s high. (before validation)
- SL → Hammer High.
- Target → 1x risk, remaining lots trail with ATR/Fibonacci.
---
🎯 Trading Plan
- Entry → On validation close (Bullish above High, Bearish below Low).
- Stop Loss → Defined by Hammer candle (Low for Bullish, High for Bearish).
- Target → First TP = 1R, Remaining lots trailed for extended moves.
---
📊 Chart Explanation
1️⃣ 🟢 Bullish Hammer Spotted
- Candle validated as price closed above the high.
- 🎯 Target 1 achieved, remaining lots managed with trailing methods. Trailing Exit could be at swing top with best trailing
2️⃣ 🛑 Bearish Hammer →
- Candle validated as price closed below the low.
- 🎯 Target 1 achieved, remaining lots managed with trailing methods. Trailing Exit could be at swing bottom with best trailing
3️⃣ 🛑 Bearish Hammer →
- ❌ Devalidated
- Candle devalidated as price closed above the high.
4️⃣ 🛑 Bearish Hammer →
-Candle validated as price closed below the low.
⛔ Stop-Loss hit
- stop loss ensures risk management and discipline in trading.
5️⃣ 🛑Bearish Hammer →
-Candle validated as price closed above the low.
- 🎯 Target 1 achieved, remaining lots managed with trailing methods. Trailing Exit could be at swing bottom with best trailing
---
👀 Observation
- Bullish Hammer → Works best after prolonged downtrend at support zones.
- Bearish Hammer → Stronger after extended uptrends or near resistance zones.
- EMA Band → Confirms market bias and filters false signals.
- Risk Management → Defined SL + structured TP protect capital and maximize reward.
---
❗ Why It Matters?
- Clear rules: Validation, Devalidation, Entry, SL, and TP.
- Combines price action (Hammer) with EMA Band confirmation.
- Ensures disciplined trading instead of emotional decisions.
- Allows both conservative and aggressive management via trailing.
---
🎯 Conclusion
The Bullish & Bearish Hammer patterns, when combined with EMA High–Low Band confirmation, provide a structured reversal trading strategy.
By following strict entry, SL, and TP rules, traders can filter false setups and capture strong reversals at swing highs and lows.
🔥 Patterns don’t predict. Rules protect. 🚀
---
⚠️ Disclaimer
For educational purposes only · Not SEBI registered · Not a buy/sell recommendation · Not financial advice — purely a learning resource.

Bearish Hammer with EMA High-Low Band - Rule Based Entry 🔹 Intro / Overview
The Bearish Hammer candlestick is a signal of potential downside reversal.
It forms when buyers push price higher, but sellers regain control and close the candle near its low.
When combined with EMA High–Low Band confirmation, it creates a disciplined setup to identify short trade opportunities with clear rules.
---
📖 How to Use
✅ Validation → A valid signal occurs when the close price is below the low of the Bearish Hammer.
❌ Invalidation → If the close price crosses above the high of the Bearish Hammer, the signal is invalid. (Before validation )
EMA Band Confirmation:
- The Bearish Hammer must be above the EMA High–Low Band.
- The EMA High-Low band should not touch the Bearish Hammer.
- This ensures the setup aligns with bearish conditions.
✅ Bearish Hammar High must be swing high
---
🎯 Trading Plan
Entry → Enter short when the close price is below the Hammer’s low (validation line).
Stop-Loss (SL) → The high of the Bearish Hammer candle(Swing High)
Target (TP):
- First Target → 1R (equal to the risk defined by Entry–SL distance).
- Remaining Lots → Trail using ATR, Fibonacci levels, Box Trailing, or structure-based stops.
---
📊 Chart Explanation
- The Bearish Hammer shows rejection of higher prices, with a small body near the low and a long upper shadow.
- The EMA High–Low Band sits below the candle, and the Hammer forms above the band (no touch), confirming the setup.
- Validation occurs when the next close is below the Hammer’s low.
- Invalidation occurs if price closes above the Hammer’s high(before Validation)
---
👀 Observation
Bearish Hammer Behavior → Most effective after an uptrend or at resistance zones.
EMA Role → Ensures trade alignment with broader market bias.
Risk Management → SL above Hammer high, TP at least 1:1, with trailing options for extended downside moves.
---
❗ Why It Matters?
- Shows buyers losing strength.
- Sellers step back in and dominate.
- EMA Band ensures cleaner filtering of weak signals.
- Provides a strict framework for entry, SL, and targets.
---
🎯 Conclusion
The Bearish Hammer, combined with EMA High–Low Band confirmation, creates a structured short setup.
Using strict validation, devalidation, and risk management, traders can filter false signals and ride potential bearish moves with confidence.
🔥 Patterns don’t predict. Rules protect.
---
⚠️ Disclaimer
For educational purposes only · Not SEBI registered · Not a buy/sell recommendation · Not financial advice — purely a learning resource.

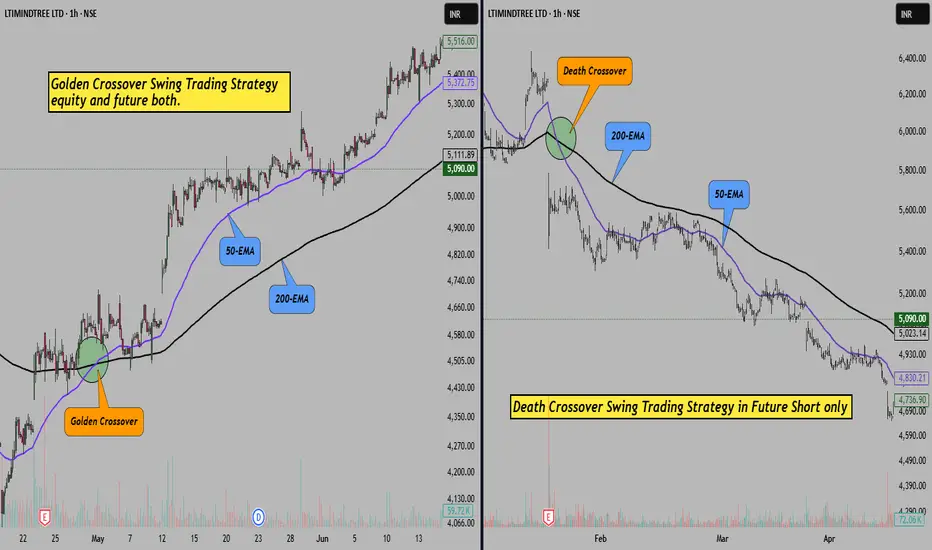
Golden EMA Setup – Catch Medium-Term Trends with 50 & 200 EMA!Hello Traders!
One of the simplest yet most powerful ways to identify long-lasting trends is by using moving averages. And among all combinations, there’s one that stands out for swing and positional trades, the Golden EMA Setup .
It uses just two tools: the 50 EMA and the 200 EMA. When used correctly, this setup helps you ride big trends and avoid choppy zones.
Let’s understand how this works and how you can apply it.
What is the Golden EMA Setup?
It’s a trend-following strategy based on the crossover of two EMAs:
50 EMA (Fast Average): Reacts quicker to price changes
200 EMA (Slow Average): Represents the long-term trend
When 50 EMA crosses above 200 EMA, it’s considered a Golden Crossover , a bullish signal.
When 50 EMA crosses below 200 EMA, it’s a Death Crossover , a bearish signal.
How to Trade This Setup:
Entry:
Buy when 50 EMA crosses above 200 EMA and price is above both.
Stop Loss:
Just below the 200 EMA or recent swing low.
Target:
Trail the stop loss and ride the trend till the crossover reverses or price weakens.
Timeframe:
Works best on daily or 1-hour chart for positional/swing trades.
Rahul Tip:
Golden EMA setup works great during trending phases, but avoid using it in sideways markets — you may get trapped in whipsaws. Always confirm with volume or RSI divergence before entering.
Did you ever used this strategy before, let me know in comment box.
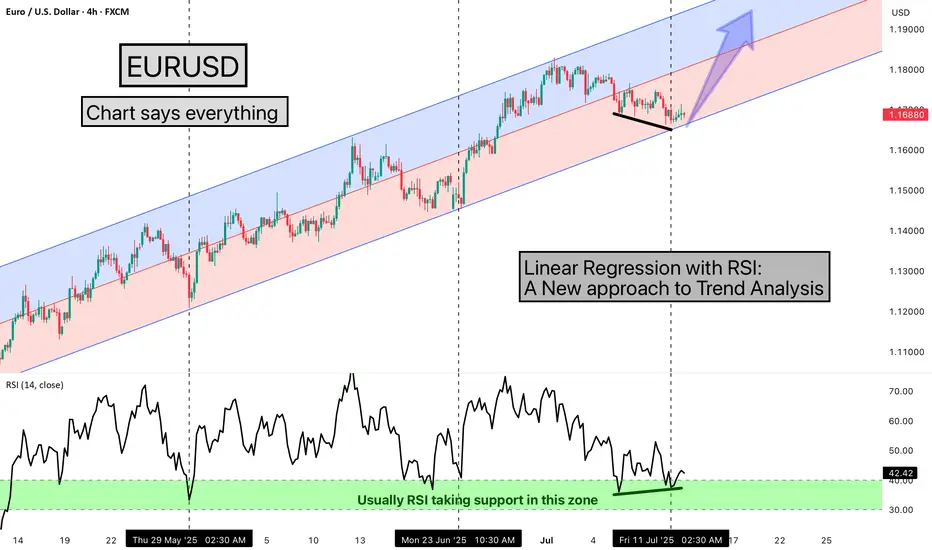
Linear Regression with RSI: A New approach to Trend AnalysisHello Friends,
Welcome to RK_Chaarts,
Today we are going to learn one Method of analysing the chart, here we are using EURUSD chart, and the method we're using is very simple & interesting, We are using the Linear Regression Trend Channel & Relative Strength Index (RSI), What happens in this method, is that we identify a particular zone where the price is making a one-sided move, like if the price is trending upwards, making higher highs and higher lows. We then apply a regression channel to it, and within that channel, we set internal deviation for the upper and lower sides, like 2 or 2.5 or 3 etc., whatever setting it takes.
In this chart, we can clearly see that the 2.5 setting is forming a complete channel, which we've applied for the last two months, from 12th May 2025, when the uptrend started. We've used the 4-hour time frame chart and the RSI. Every time the price hits the bottom of the channel, we can see that the RSI also enters the same zone, between 30-40, and from there, it bounces back.
Currently, the price has again hit the bottom of the regression channel, and the RSI has also gone below 40, between 30-40. And the good thing is that we're seeing a positive divergence in the RSI. So, there's a high possibility that the price might bounce back from here.
It's worth watching what happens next in the market. Nothing is guaranteed here; everything is a game of probabilities. This is one method that we often use, and its results have given us a very good experience. So, let's see what happens next in this chart. This observation is also a good learning experience, which we often encounter, 7-8 times out of 10, in favor of the market, but sometimes it doesn't work, maybe 2-3 times, when the trend changes. So, let's see what happens next.
This post is shared purely for educational purpose & it’s Not a trading advice.
I am not Sebi registered analyst.
My studies are for educational purpose only.
Please Consult your financial advisor before trading or investing.
I am not responsible for any kinds of your profits and your losses.
Most investors treat trading as a hobby because they have a full-time job doing something else.
However, If you treat trading like a business, it will pay you like a business.
If you treat like a hobby, hobbies don't pay, they cost you...!
Hope this post is helpful to community
Thanks
RK💕
Disclaimer and Risk Warning.
The analysis and discussion provided on in.tradingview.com is intended for educational purposes only and should not be relied upon for trading decisions. RK_Chaarts is not an investment adviser and the information provided here should not be taken as professional investment advice. Before buying or selling any investments, securities, or precious metals, it is recommended that you conduct your own due diligence. RK_Chaarts does not share in your profits and will not take responsibility for any losses you may incur. So Please Consult your financial advisor before trading or investing.
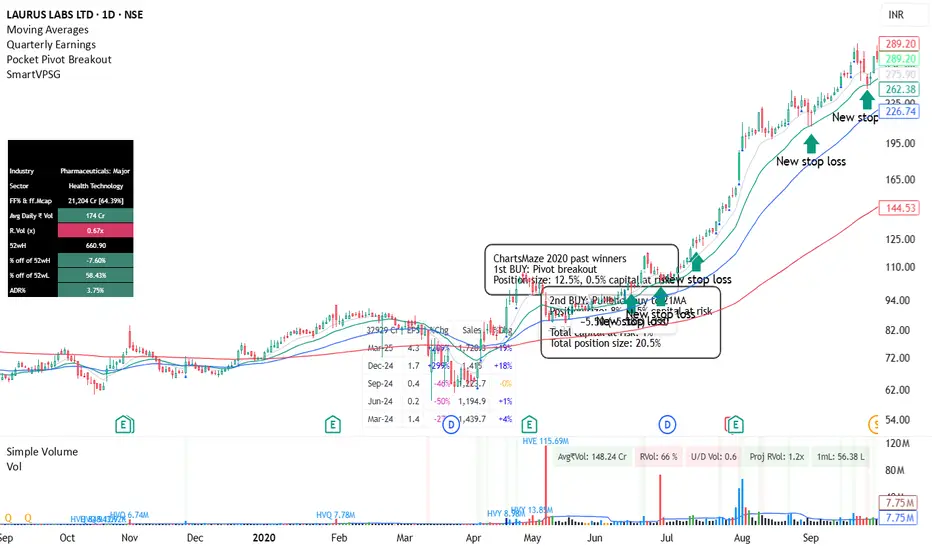
LAURAS LABS 2020 PAST WINNERThis is just for educational purposes, as I believe studying past winners helps you prepare for the next bull run and understand how winning stocks behave. I have marked the entry points so that you can see how many entries multibagger stocks typically provide.
Death Crossover Strategy Explained with 50-EMA & 200-EMA line.Hello Traders! In today's post, we’ll explore the Death Crossover Strategy , a highly effective technique used by traders to identify potential trend reversals. This strategy involves the 50-EMA (Exponential Moving Average) crossing below the 200-EMA , which is considered a bearish signal.
In this chart of IndusInd Bank Ltd., we can clearly see the Death Crossover in action. The 50-EMA (green line) has crossed below the 200-EMA (red line), signaling a potential downtrend.
Key Insights:
Death Crossover : Occurs when the short-term moving average ( 50-EMA ) crosses below the long-term moving average ( 200-EMA ), suggesting the beginning of a downtrend.
Volume Confirmation : A sudden increase in volume after the crossover confirms the strength of the signal. In this case, the volume spike at the crossover indicates a strong bearish momentum.
Target Areas : After a Death Crossover , look for potential support levels to target as the price moves lower. In the chart, we can see how the price retraced and then continued its downward journey.
Price Action Post-Crossover:
In this example, the stock dropped by approximately -38.12% after the Death Crossover , highlighting how powerful this signal can be in catching major trend reversals.
Risk Management :
Stop Loss : To protect your capital, always use a stop-loss order just above the 50-EMA (green line) when entering a short trade after the crossover.
Position Sizing : Keep your position sizes small in trending markets to manage risk and ensure a favorable risk-to-reward ratio.
Note: We have used this chart just for teaching the strategy and its potential impact.
This is a great strategy to catch long-term downtrends, but as always, remember to use it alongside other technical indicators and fundamental analysis to increase your chances of success.
Happy Trading!

Price Action vs. Indicators: Which Strategy is Better?Price Action vs. Indicators: Which One Works Better?
Hello everyone! I hope you're all doing great in life and in your trading journey. Today, I bring an educational post on a widely debated topic in the trading community— Price Action vs. Indicators . Some traders swear by naked charts , while others rely on technical indicators for trade decisions. But which one is better? Let’s break it down!
Price Action vs. Indicators: Key Differences
Trading Approach:
Price Action Traders analyze candlestick patterns, trendlines, support & resistance without using indicators.
Indicator Traders use tools like RSI, MACD, Moving Averages to identify trade setups.
Speed & Responsiveness:
Price Action provides real-time signals based on raw market movements.
Indicators are often lagging , meaning they react after the move has started.
Simplicity vs. Confirmation:
Price Action is clean and simple , but requires deep understanding.
Indicators offer confirmation but can clutter charts if overused.
Market Adaptability:
Price Action adapts well to all market conditions .
Indicators can be less effective in ranging or choppy markets .
Who Uses It?
Scalpers & Intraday Traders prefer price action for quick decisions .
Swing & Position Traders often combine indicators with price action for confirmation.
Which One Should You Choose?
✔ Use Price Action if: You prefer a clean chart and want to react directly to price movement.
✔ Use Indicators if: You like structured trading signals and need extra confirmation.
✔ Hybrid Approach: Many traders combine both methods for better accuracy—price action for direction, indicators for entry signals.
Outcome:
Both Price Action and Indicators have their strengths. The key is to find what suits your style, test strategies, and stay consistent.
What’s your favorite trading method? Price Action, Indicators, or Both? Share your thoughts in the comments!

HOW LIQUIDITY WORKS!In trading, liquidity refers to how quickly and easily an asset can be bought or sold in the market without significantly affecting its price. It reflects the availability of buyers and sellers and the volume of trading activity for a particular asset.
Key Aspects of Liquidity:
1. High Liquidity:
The asset can be traded easily with minimal price changes.
Common in popular markets like major stocks (e.g., Apple, Tesla), forex pairs (e.g., EUR/USD), and widely traded cryptocurrencies (e.g., Bitcoin).
2. Low Liquidity:
It’s harder to find buyers or sellers, leading to potential delays or price changes during transactions.
Common in niche markets, lesser-known stocks, or illiquid crypto tokens
Importance in Trading:
Efficient Price Discovery: High liquidity ensures prices reflect market demand and supply.
Lower Risk: Traders face less risk of slippage (unintended price changes during execution) in liquid markets.
Flexibility: Allows traders to enter or exit positions quickly, especially important for day traders and scalpers.
In summary, liquidity is crucial for smooth and cost-effective trading.
#Stockmarketeducation

Falling Knife stocks-How to identify them?I have discussed in previous post about what exactly falling knife stock is with a case study.
The next question would be how would an investor know that stock is a part of falling knife category?
To identify such stocks, I feel you should know about 2 concepts/indicators which are Moving averages and Fibonacci retracement. I will try to make you understand these concepts and also the levels where averaging/investing can be started.
1. Fibonacci(Fib) is a mathematical concept which governs the entire universe, even our stock markets. I can't explain the entire scientific concept here so just sticking to stock market.
Fib retracements help investors identify support and resistance for stock. There are 2 golden ratios which every investor must know, 38.2%(0.382) and 61.8%(0.618).
When a stock is in uptrend, 38.2% is the level where most stocks retrace upto. 61.8% is considered as last ray of hope for bounce in retracement. Any stock which has fallen below 61.8% is considered weak.
2. Moving averages(MA) are indicators which are continuously changing with moving stock market. These are an average of prices over a time period, hence Time frame is important.
There are many types of moving average, we use mostly simple and exponential.
When I say 20 Day EMA, it is Exponential average of 20 days of closing price of stock or when I say 200 week SMA, it is simple average of 200 weeks closing price.
Exponential is more used than Simple moving average which has scientific reason behind it so if you are curious, you can search for it.
200 Week moving average is considered as last ray of hope for investment. A fall below 200 Week moving average or 50 Month EMA indicates strong bearishness.
3. I have seen stocks reach from top to bottom and top again. Tata motors, HDFCAMC being few famous examples. Even, Most of real estate, PSU banks stocks are reversing. So, equity is beautiful, wild and highly unpredictable. However, A stuck investor should wait for monthly closing above 61.8% to start averaging in such stocks. Also, a closing above 200 Week EMA will slightly indicate return of bullishness and that's where reversal traders should think of investing
I feel this much knowledge is enough for now. If you have got some enlightenment from above information, lets apply this knowledge on one stock where I know many many investors are stuck, Rajesh Exports.
How do I know? I saw the shareholding pattern and that's where I was shocked to see the number of shareholders increase from 45000 odd to over 2 lakhs in the past 9 months!
Starting with fundamentals, Rajesh Exports Ltd is 4 decade old manufacturer of Gold and Gold Products available at a PE of around 9 and sales growth of 20% in last 3 years. All the ratios feel nice to me except the operating margin which is below 2% consistently which has led to drop in EPS which is major concern in the stock.
Technically, stock had a 52 week high of 1030 in Feb 2023 and it is now available at 360 odd which is more than 60% wealth destroyed. And as I said, the number of shareholders have grown 5x in the same time. (Note that FII, DII holding has reduced in same period).
If i see now from a non-investors perspective(psychology explains that investor can never see the bearishness), the stock has formed a beautiful double top and broken its neckline which was 61.8% of fib retracement all ready for a further fall and I see no support till 270-300 zone(sorry investors). It is also below 200 week moving average-red wavy line(if you check monthly chart, it is below 200 month moving average as well). A perfect example of Falling knife.
What next? If I were an investor, My last SL would have been 525 which is 50% retracement. Since, the stock is below 61.8% retracement , there is no chance of averaging at this moment. Hence, I feel investors should wait & watch until stock moves above 440 before averaging/entering. Don't jump in it. Wait for a big bullish monthly candle before averaging.
Also....
As promised,, I am sharing you names of stock which i have identified to be part of this unloved category. As an homework, do check fundamentals and reversal levels based on what we have discussed above.
The stocks are GRINFRA, TCNSClothing, Metropolis, Luxindustries, Polyplex, HLEGlasscoat, Deltacorp, Barbequenation.
If you are a curious investor, even you can find such stocks and do let me know in the comments below.
I would like to discuss any doubts regarding the concepts, idea or anything related to stock market so feel free to comment.
Keep investing, keep minting. India has a very big future ahead so these are the best few years to invest in India.Be a smart investor because it is important that you choose the right stock to meet your financial goals.

A 50-day moving average (50 DMA/SMA/EMA)A 50-day moving average (50 DMA) is a technical indicator that shows the average closing price of a security over the last 50 days. It's a popular indicator because it's realistic and effective at showing historical price movement trends.
Concept of 50 Moving Average
1. Entry
- Candle crossover 50 MA: This refers to a situation where the closing price of a candle crosses above the
50-period moving average line. When the candle's closing price moves from below the 50 MA to above it,
it indicates potential upward momentum in the price action. This could signal a bullish trend or a potential
buying opportunity.
2. Exit:
- Distance between 50 MA and Candle: This involves monitoring the distance between the closing price
of the candle and the 50-period moving average. If the distance becomes significantly large, it may indicate
an overextended market and a potential reversal. Traders might consider taking profits or preparing for a reversal
signal.
- Candle crossunder 50 MA: This occurs when the closing price of a candle crosses below the 50-period
moving average line. It suggests potential downward momentum in the price action. This could signal a bearish trend
or a potential selling opportunity.
3. No Trade Zone (Sideways):
- Use Box Breakout Strategy: In a sideways or ranging market where the price moves within a defined range,
a breakout strategy can be employed. A box breakout strategy involves identifying a range-bound market where the
price oscillates between a support and resistance level (forming a box-like pattern). Traders look for breakouts
above the resistance or below the support level to initiate trades. This helps avoid trading during periods of low
volatility and indecision, typical of sideways markets, and instead focuses on capturing potential momentum during
breakout movements.

Call and put strategy on Muhurat TradingMuhurat Trading is auspicious for trader, at this time people rushes to buy stocks and market creates a huge bullish candle, and next day most people sells that stocks and market goes bearish...
You should buy on Muhurat and sell next day

The Ultimate Beginners Guide to Day TradingHello everyone My name is d3ffyduck
I am today gonna post some cool and new tips For the beginners in Daytrading.
I am gonna divide things in Chapters so you'll learn it with ease
Read it till the end Hope You learn something
Chapter-1 Timeframe selection
The choice of the best timeframe for chart analysis in day trading can vary depending on a trader's strategy, preferences, and the market being traded. Different timeframes offer varying levels of detail and may suit different trading styles.For Example
1-Minute Chart: This timeframe provides very detailed information, showing price movements within one-minute intervals. I prefer Using it for precise entry and exit points In day trading
5-Minute Chart: Slightly less detailed than the 1-minute chart, the 5-minute chart still offers relatively short-term insights into price movements. I use to determine my momentum for the trade i want to hold for like 1-2hrs only
15-Minute Chart: This timeframe offers a broader view of the market compared to shorter intervals. I prefer it to determine my next day momentum of the market
Chapter-2 Support and resistance Using RSI
I know you all knows the basics for support and resistance but today i will show you the best way. Just open your chart and use RSI Indicator and we are going to mark the overbought areas high candle and oversold area lowest candle using it for different time frames.
Just a note from my side do not mark those areas again if there have already a support or resistance line in different time frame and also you can remove those level of S&R which did not hold well in different time frames
1-day time frame=I have marked the regions where the RSI turned in the overbought or oversold areas. As you can see, I have not marked the support and resistance levels since they were already established from previous market overbought and oversold.
4-hour Time frame=In this timeframe, we will only identify the levels that are above 70 and below 30 in the RSI. We'll skip the R&S that are already marked on the daily timeframe. To reiterate, please refrain from marking those levels again if we can observe that our resistance and support levels have already been established on the daily chart.
1-Hour Time Frame = I've set my preferred timeframe to a maximum of 4 to 5 months. I don't want to go below this timeframe as it will create more noise. Additionally, I'll remove the support and resistance levels that didn't react well for buyers and sellers at this point to make the chart look cleaner
Chapter-3 Determining the Trend
Here in this chapter we are going to use only 2 Things to keep everything simple:-
SMA+EMA 200= We are going to use simple indicator or just create yourself one indicator which plots both sma and ema with same 200 timeperiod.
Rules are simple
if below both ma look for short
if above both ma look for long
You can use it for 1hr and 15 min for day trading purpose
Trendlines- Trendlines are your best friend.They are the building block for your Chart pattern look for trendlines in 15 min tf for day trading purpose
Chapter-4 Significance of market opening closing,high,low
This is one of the important chapter for day traders and i am going to tell you how an opening closing high and low effect the whole day trade.
For Example
1-Open your Chart
2-Mark the opening ,closing highs and lows for previous 3-4 days
3-Those area are going to be area of interest
Tip for the beginners. Do not take any trades for the first hour From the opening of the day For example if your market opens in 9:15 am dont take trades until 10:00-10:15 cause of high volatilty
Another Tip for the beginners.If you prefer to take 2 trades a day close your previous 10:00 am trade At around 11:45am -12:15 pm and start looking for another one after that. the reason because i have seen this is the time for the most probable reversal or continuation of trend for the next leg of the day
Chapter-5 Significance of Gaps in the market
Gaps are one of the best way to decide what will be the market trend for the rest of the day
There are two type of gaps in the market 1-Gap up 2- Gap down
Tip for the beginners Only trade in the strong gap up or down and as i said before do not trade in the first hour of the opening
Ill show you some scenarios of gap Trading with respect to opening of the day
Scenario 1st strong gap up+ Stayed above above the gap and opening for the 1 hour(9 am-10am)
We can see we had a strong opening stayed above the gap up and open for atleast 1 hour so after this the trend is decided
Tip for the beginners Always follow strict Risk and Reward ratio like i use 1:1.5
Scenario 2nd strong gap up+ stayed below the gap and opening for the 1 hour(9 am-10am)
We can see we had a strong gap up and opening but price stayed below the opening for 1 hour so we took the short as dropped below previous closing/high
Similarly we can use this for gap down scenarios
Final tip from my side are:-
Do meditation for 15 min before trading hours
Always use stoploss
Use your preferred Risk Reward ratio like 1:1.5
Do not trade in opening Hour
Gaps are like your friend
Trends are like a path to success
Do not overtrade
Dont only rely on indicators there isnt any indicator which can make you rich
Use only basic indicators such as Ema,Macd,Rsi and ATR
PLEASE UPVOTE AND FOLLOW FOR MORE EDUCATIONAL CHARTS AND STRATEGIES

Weakness in Nifty Oil and Gas SectorChart type - Heikin Ashi
Time frame - Daily
Indicator - Guppy Multiple Moving Average
Today we have a Red HA candle with a strong body which shows a countable decline in the momentum. Also a day before we have a doji candle at the top of the uptrend which is a sign of trend reversal. But I wait for the bearish crossover or a strong breakdown of the moving averages.

Moving Averages are really powerful. . . !Can you believe they are...
Moving average(MA) is one of the oldest indicator. Lot of people (including me) would reject the idea that such a simple indicator can be of any use in modern day considering availability of advance computer tools.
I came across free training videos of Oliver Velez who explained on how to use it. When I back tested his logic I was really surprised..
Since then I have kept 20SMA and 200SMA as default on my chart. Best part of this concept is, it works on any time frame.!
MA can answer following key questions which helps anyone become good trader/investor..
Q1. Is the stock trending? and What is the direction of trend.?
A1. If 20MA is flat stock is not trending. Direction of 20MA is direction of trend.
Q2. How old is the trend. (if trend has just started I can board it and if it is too old I will not)
A2. If 20MA is not too far from 200MA trend has just started. If 20MA is too far from 200MA be alert trend might be matured.
Q3. Am I buying in value zone so that my SL is small.?
A3. Buy when stock retraces near 20MA.
Q4. Am I exiting at a value where I have got good amount of move. So that my profits are much higher than losses.
A4. Exit when stock is far away from 20MA.
I have marked all above on these chart for easy understanding.
As we can see FAR and NEAR are relative terms. Hence it takes good amount of practice to grasp and trade this concept.
Considering volatility lot of whipsaws can happen in intraday and daily time frame. So I started using it on weekly time frame and started getting good results with holding time of 3~10 weeks.
However once you are confident in your stock selection criteria this is good way to ride a trend.
We can compare trading using MA to flying kite. It is simple but not easy. One need to practice to master the skill.
One need to get feel direction and gust of wind,
Understand behavior of kite and
finally time the action to fly kite.
Hope this post will help you appreciate this oldest indicator...

How to set an alert for BankNifty Intraday Strategy [5min TF] ? Set Alert on 77% Profitable Bank-Nifty Back-tested Intraday Strategy with FREE TRIALS
Trend Follower Intraday for 5 minute Time-Frame (Adjustable) , that has the time condition for INDIAN | CRYPTO | FOREX Markets
// ══════════════════════════════════════════════════════════════════════════════════════ //
Unlike the Free Scripts - Risk Management , Position Sizing , Partial Exit etc. are also included .
Send us a Message to know more about the strategy.
// ══════════════════════════════════════════════════════════════════════════════════════ //
The Timing can be changed to fit other markets, scroll down to "SQUARE-OFF TIME" to know more.
The commission is also included in the strategy .
The basic idea is when ,
1) EMA1 crosses above EMA2 , is a Long condition.
2) EMA1 crosses below EMA2 , is a Short condition.
3) Green Section indicates Long position.
4) Red Section indicates Short position.
5) Allowed hours specifies the trade entry timing .
6) ATR STOP is the stop-loss value on chart , can be adjusted in INPUTS.
7) Target 1 is the 1st target value on chart , can be adjusted in INPUTS.
8) RISK is Maximum Risk per trade for the intraday trade can be changed .
9) Total Capital used can be adjusted under INPUTS.
10) ATR TRAIL is used for trailing after entry , as mentioned in the inputs below.
11) Check trades under the list of trades .
12) Trade only in liquid stocks .
13) Risk only 1-5% of total capital.
14) Inputs can be changed for better back-test results, but also manually check the trades before setting alerts
15) SQUARE OFF TIME - As you change the time frame , also change the square-off time to the candle's closing time.
Eg: For 3min Time-frame , Hour = 2Hrs | Minute = 57min
16) Strategy stops for the day if you have a loss .
17) COMMISSION value is set to 10Rs and SLIPPAGE value is set to 1 . Go to properties to change it .
Apply it to your charts Now !
Send us a message for FREE TRIALS | Instant Access
Thank You ☺

Bearish Engulfing Pattern...For the bearish engulfing pattern, there are 3 criteria:
1. Market has to be an in an uptrend. The VRL price was in an uptrend until it reached its high and then the bearish engulfing pattern formed.
2. The second body of the pattern must engulf the prior real body. Here, both the engulfing patterns marked in the chart, display these characteristics.
3. The second body of the pattern must be the opposite color of the first body.

What is moving average?If you have been in the market for some time, you may have heard of an indicator called the “moving average”. Today we are going to take a deeper look at the indicator, along with a few examples of how pros use it. This post will also lay the groundwork for future posts about more advanced moving average topics.
Please remember this is an educational post to help all of our members better understand concepts used in trading or investing. This in no way promotes a particular style of trading!
The post will shed some light on the following topics:
- What is a moving average?
- How does moving average work?
- Correct usage along with exhibits
Introduction
A moving average (MA) is a technical indicator that is commonly used to determine the direction of the trend. By continuously recalculating the average based on the most recent price data, a moving average assists in smoothing out the price data. This helps in reducing the impacts of random short-term variations of the price over a given period of time.
Working with moving averages
- Moving averages are typically calculated to determine the direction of the trend and are sometimes used as dynamic support and resistance levels for a given time period.
Exhibit: Moving averages acting as a dynamic support
Exhibit: Moving averages acting as a dynamic resistance
- Since a moving average is derived using historical prices, it is a lagging indicator.
- The lag increases with the length of the moving average. As a result, a 200-period moving average (which includes prices for the previous 200 periods), will lag significantly behind a 100-period MA.
- Likewise, a moving average with a shorter period (faster MA) will be more sensitive to price changes as compared to a slower one.
Usage
- Faster moving averages are typically employed for short-term trading, while slower moving averages are more often utilized for understanding longer-term market dynamics.
- Moving averages are applicable to all time frames. Therefore, experimenting and testing several settings over a range of time frames is the best approach to determine which one works for you.
- A rising moving average indicates strength, while a falling moving average indicates weakness. Hence, in general, a stock is said to be in an uptrend if its moving average is increasing, whereas in a downtrend if MA is decreasing.
- In general, a stock may show bullish momentum if there is a bullish crossover, i.e. when a faster moving average crosses above a slower moving average.
- Conversely, bearish momentum may be expected on a bearish crossover, which occurs when a slower-moving average crosses below a faster-moving average.
Thanks for reading! As we mentioned before, this isn't trading advice, but rather information about a tool that many traders use. Hope this was helpful!
See you all next week. 🙂
– Team TradingView
Feel free to check us out on Twitter , Instagram , and YouTube for more awesome content! 💘

Using the Moving Averages and RSI to optimize buying processIn this chart I have explained my rationale using Moving averages, relative strength and RSI to initiate a buy on this scrip.
I always use a weekly chart to check for overall trend and analysis and based on it will initiate a buy on a Daily chart.
Explanations are given on the chart. The idea is get the maximum conditions in our favour for a profitable trade. Hope it will be helpful.
Another important thing is to always define a stop loss if the trade does not go according to plan.

All About 200MA |How to use it to take trade with example.Part-1NSE:HINDPETRO
All About 200 DMA. How to use it to take Mid/Long term trade.
1)What is 200DMA?
It is simple technical analysis tool that is an average of daily close price of last 200days/candles. It is used to smooth out the price and it will remove the intraday fluctuation noise.
200DMA == 200 Daily Moving Average
2)200DMA is the one of the main critical support/resistance that it will work in downtrend or in uptrend.
---------------------------------------------------------------------------
How to use it and how to take trade?
200DMA as support:
If price is above 200DMA then it will work as Support and it is time to buy trade opportunity.
Please refer below chart: 1Day Time Frame
200DMA as resistance:
If price is below 200DMA then it will work as resistance and it is time to short/sell trade opportunity.
Please refer below chart: 1Day Time Frame
-------------------------------------------------------------------
Steps to follow to find and take Trade.
Step: 1
Need to find Chart pattern on Daily Time frame; such as bullish flag, triangle, rounding bottom, cup and handle head and shoulder etc…
Step: 2
If there is no clear pattern then Judge the price action. If it is trading in uptrend/downtrend parallel channel , If it is in accumulation , if it is in distribution etc….
Step : 3
Find Support and Resistance on Chart
Once these 3 steps are clear you have most of all to take mid/long term trade.
-------------------------------------------------------------------
NOW Let’s look at example.
I am taking HINDPETRO for example.
This Part 1 is with buy trade example.
Let’s take Step: 1
So, in below chart we found one pattern which is Cup and Handle Pattern.
So, our entry will be on breakout of it.
Please refer below chart: 1Day Time Frame
Step 2 is not needed as we already found Pattern.
Step 3 : Please refer below chart for Support and resistance level.
We can see that it is having immediate resistance at 190 level and major resistance at 200 Level. Breakout on 190 level will be quick buy till 200
But safe buy will be on breakout of 200 level with SL just below 190 level which will be 185 level for mid/long term trade.
Please refer below chart: 1Day Time Frame
--------------------------------------------------------------------------
Now the main point about Target: What can be the Target. As our SL is decided at 185 level.
To decide our Target, we can go a back in history where earlier it had taken support at 200DMA and gave bullish rally.
So, if we see in month from May to Aug it rallied almost 94.65 points after it took last support in near range from 200DMA.
Please refer below chart: 1Day Time Frame
So, let’s take target of max 90 points from the level of 200DMA.
Level 179 was the level at which it took support from 200DMA and now adding 90points we can see 269/270 as our Target.
Let’s consider our buy trade entry at 205 level. And Our Target will be 270 and SL will be 185.
Hence our Risk Reward will be 65 (up move) / 20 (down move till SL) = 3.25 : 1
Please refer below chart: 1Day Time Frame
Even we can see that stock even move higher than our target. But to get higher target we will need to use FIB Retracement tool.
For this article let’s keep it till this.
Hope I made it easy to understand.
Part 2 for 200DMA short trade with example will be posted separately.
Do comment your doubt or suggestions.
**************this is for educational purpose only**************
