Breakdown or Breakout – Gold Compression Phase🔎 Market Context
• Gold is compressing within the 5000 – 5080 range
• Accumulation phase after the previous sharp sell-off
• Volatility is contracting → expansion is likely soon
• CPI & Non-Farm Payrolls are key catalysts
➡ Do not predict direction. Wait for a confirmed breakout.
📌 Strategic Zones
Resistance: 5078–5080 | 5100 | 5148 | 5200 | 5300 | 5345
Support: 5000 | 4980 | 4850 | 4830 | 4600 | 4400
• 5078–5080: Upper boundary of the range
• 5000: Lower boundary of the range
• 4980: Market structure decision level
⚖ Trading Bias
• Above 5080 → Favor upside continuation (Wave C extension)
• Below 4980 → Bullish structure breaks → favor downside
• Inside 5000–5080 → Compression phase, avoid FOMO
⚠ Key Notes
• Major data releases may cause false breakouts
• Wait for candle close confirmation
• Volatility likely to increase → manage risk carefully
• Avoid trading mid-range without clear edge
Supportandresistancezones

Gold Faces Strong Selling PressureGold came under heavy selling pressure after failing to break above the 5,100 USD level overnight and subsequently falling below 4,900 USD during today’s trading session.
The US dollar climbed to its highest level in two weeks and appears to be extending its recent solid recovery from a four-year low, which is adding notable downside pressure to the precious metal.
In addition, the current corrective move is still struggling, as price remains below the trendline. As long as this trendline—and more importantly the recent high at 5,100 USD—is not convincingly broken, the path of least resistance remains to the downside.
What’s your view? How do you see the next move for OANDA:XAUUSD ?

Chumtrades XAUUSD Has Wave B finished?GOLD – DAILY PLAN
Has Wave B finished?
→ No confirmation yet.
Macro & Market Sentiment
US–Iran negotiations have been cancelled. Geopolitical risks remain, but not strong enough to trigger a new bullish wave.
Gold experienced a relatively calm trading session, failed to break above the key level around 5,100, and saw a moderate pullback during the US session.
The Daily candle formed a Spinning Top, indicating market indecision and consolidation, with a lack of momentum for a breakout.
👉 Macro factors are supporting prices, but not pushing the market into an immediate uptrend.
Technical Structure & Outlook
Price is still moving within a descending price channel.
On the H1 timeframe, price has broken above the 4,888 key level, showing a technical rebound.
However, the higher timeframe structure remains bearish, with no confirmed trend reversal.
→ Therefore, current rebounds are considered pullbacks within a downtrend.
Key Levels
Support: 4,810 | 4,830 | 4,700–4,750 | 4,650–4,624
Resistance: 4,950–5,000 | 5,100
Trading Scenarios
Primary strategy: Sell the rallies within the descending channel.
Look for SELL setups near resistance zones, targeting lower lows.
Momentum SELL may be considered if price clearly breaks below 4,882–4,890, with confirmation on H2 or H4, targeting around 4,810.
No BUY positions while price remains inside the descending channel.
👉 Only if price breaks and holds above 5,100, will we start reassessing a trend-following BUY scenario.
👉 Deeper pullbacks are viewed as potential zones for swing BUY opportunities, not short-term buys at this stage.
Note: The market is in a “confidence-testing” phase. Focus on zone-based trading, trend alignment, reduced position size, and avoid FOMO.

Wave B Has Rebounded 15% Bottom Confirmed at 4,400?Wave B Has Rebounded 15% – Final Bottom or a Trap Before Wave C?
After a strong rally in yesterday’s Asian session, gold moved into consolidation during the European and US sessions, with a failed breakout late in the US session. In today’s Asian session, price broke above the 4,882–4,960 range, confirming it as a new buy-side base.
Gold has rebounded ~15% from the 4,404 area, driven by dip-buying demand and rising US–Iran geopolitical tensions, which remain a key catalyst alongside this week’s economic data.
From an Elliott Wave perspective, 4,400 marks the Wave A bottom. The market is now in a Wave B corrective rebound, with potential upside toward 5,140 – 5,200 – 5,220. Once Wave B completes, Wave C may follow, where signs of weakness and distribution will be watched to identify new swing-buy zones after the correction.
Support: 4,990–4,950 | 4,880–4,890 | 4,780–4,750 | 4,650–4,624
Resistance: 5,140 | 5,200 | 5,220
Note: Volatility remains elevated. Trade cautiously with strict risk and capital management.

If You Want to Catch the Bottom, First Wait for RSI.To Do Nothing.
Right now, staying out is already a win.
The market is moving fast, noisy, and uncomfortable. Both buyers and sellers are getting trapped — not because direction is unclear, but because the market has not finished its process yet.
This is a moment to stay calm and observe, not to force a trade.
Observe how price begins to slow down.
Observe how selling pressure fades.
Note:
Stay focused on RSI behavior. When price decelerates and RSI shows clear convergence / stabilization, that’s when it makes sense to start thinking about potential long ideas — not before.
Until then, observation comes first.
Sometimes, doing nothing is the most disciplined decision you can make.

Gold: Correction or a Pause Before Continuation?Hello everyone, what’s your view on gold at the moment?
Yesterday, gold posted a strong intraday rally followed by a sharp reversal lower, clearly highlighting the intense battle between short-term capital flows. It was a highly volatile session, but from a professional perspective, there is still insufficient evidence to conclude that the medium-term trend has been broken.
From a news and market-context standpoint, the initial upside move was driven by renewed safe-haven demand as cautious sentiment returned. However, as price reached higher levels, large-scale profit-taking, combined with liquidation pressure from risk assets, quickly pushed gcapital reacted faster than.
On the techn, tkey support zone below acting as the equilibrium area between supply and demand. Price behavior around this area will determine whether gold is consolidating for another leg higher or transitioning into a deeper correction.
At this stage, my preferred approach is to monitor price reaction at the support zone rather than act impulsively. If buying interest returns and structure stabilizes, gold still has room to recover. Conversely, if support is decisively broken, staying on the sidelines becomes the most prudent choice.
What’s your take on XAUUSD?

Gold ATH after FOMC: Reaction or New Wave?Before the FOMC meeting, the market shared the same question:
would gold rally ahead of the meeting and then face a sharp sell-off afterward, or continue breaking higher and extend the trend?
After the FOMC, the Fed kept interest rates unchanged — which was not a surprise.
What really mattered was the Fed’s tone, and Powell clearly chose a balanced stance:
neither too dovish nor too hawkish.
More importantly, the Fed has effectively ruled out further rate hikes, while still maintaining a high interest-rate environment.
As a result, gold did not experience a heavy sell-off after the FOMC, and continues to hold its structure near the highs.
At this stage, market focus is shifting toward external risk factors:
The risk of a U.S. government shutdown
U.S.–Iran tensions
Ongoing trade war risks with major partners
Questions surrounding the independence of the Fed
👉 The current macro backdrop is not bearish for gold.
👉 SELL setups are reactionary, not the core narrative of the trend.
⏱️ H1 Observation Range
Lower bound: 5,415
Upper bound: 5,600
Price is consolidating near the highs with a wide range and may gradually push toward higher round-number levels.
🟢 Support / BUY zones
5,505 – 5,410 – 5,310 – 5,250 – 5,100
🔴 Resistance / Key observation zones
5,660–5,665 – 5,700 – 5,800 – 6,000
🧠 Primary scenario
Wide volatility → risk management is key.
SELLs are only short-term reactions at resistance.
BUY pullbacks to support to ride the broader move, not to pick the top.
⚠️ Key notes for the current phase
Reading the chart is a skill.
Reading the Fed is a strategy.
Reading Trump’s statements is survival.
Markets don’t reward being right —
they reward discipline and alignment with the trend.
👉 SELL to react — BUY to stay in the game.
📌 Follow me to track macro scenarios, key price levels, and the ongoing journey of finding opportunities in the market.

Gold at ATH before FOMC shakeout first or straight breakout?🧭 Macro Snapshot
Donald Trump maintains a hardline stance, increasing military presence in the Middle East → geopolitical risk remains elevated.
Tonight’s key focus: Federal Reserve
Political pressure and questions around Fed independence.
DXY continues to weaken, retesting major historical support (2020–2022) → supportive for gold.
👉 Conclusion: Geopolitics + a weaker USD set the bullish bias, while the Fed determines short-term volatility.
📊 Intraday Range to Watch
Upper range: 5,280 – 5,305
Lower range: 5,190 – 5,160
→ High probability of range trading and liquidity absorption ahead of the Fed decision.
🟢 Support
5,220–5,225 | 5,150–5,165 | 5,080–5,085 | 5,050–5,060
🔴 Resistance
5,280–5,294 | 5,300 | 5,315 | 5,380–5,385
⚠️ Strategy Notes
Expect possible fake moves / stop hunts within the range.
Avoid chasing highs or catching tops without confirmation.
Focus on price reaction at key levels and stay disciplined.
Summary: Gold is fundamentally supported, but today the key is how price reacts within 5,160–5,305.
Be patient — wait for confirmation — trade the reaction.

Eternal (Zomato) price action analysis for Feb-Mar 2026Analysis data: 26-Jan-26
Zomato had a good runup from 240 levels to 360 levels from May 2025 to Oct 2025.
Stock is currently at 258. It is likely to take support as buyers are expected in the 240-250 region again. However this time the targets would be 280, 290 & 300 levels.
Keep SL at 230
Happy Trading!

Next week: Will gold listen to the Fed… or the White House?🔎 Context
Next week could be highly volatile as monetary policy and geopolitics converge.
Donald Trump signaled a potential 100% tariff on Canadian goods if Canada moves closer to trade deals with China—raising trade-war risks.
At the same time, military assets are being deployed en masse around Iran, heightening concerns that tensions could escalate.
👉 Safe-haven flows may return, with gold potentially opening the week gap-up and early buying.
🧠 Quick take
Primary trend: Bullish
At elevated prices: a short, sharp shakeout is possible to absorb liquidity
No top/bottom calls—watch price reactions at key zones
📌 Key levels to watch
🟢 Supports: 4920–4900 | 4890–4882 | 4850–4830 | 4660–4640
🔴 Observation resistances: 5006–5030–5090 | 5110–5115 | Current ATH
🎭 Weekly scenarios (reference only)
Early week: Gap-up / early push
Pre-FOMC: Chop & liquidity sweep
Then: Deep shakeout or base-building and continuation
👉 Distribution at the top—or just a pause before the next leg higher?

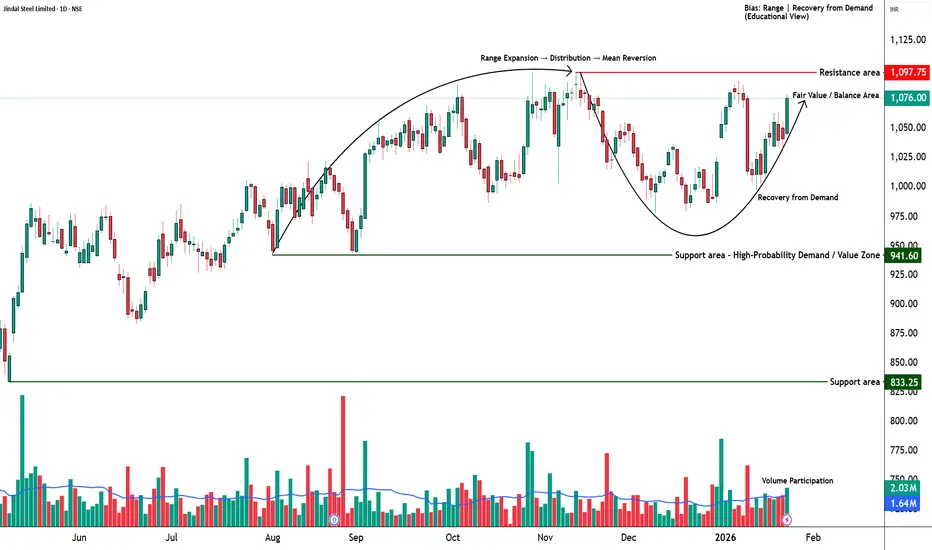
JINDALSTEL - STWP Equity Snapshot📊 STWP Equity Snapshot – Jindal Steel Ltd (JINDALSTEL)
(Educational | Chart-Based Interpretation)
JINDALSTEL is trading within a broader upward structure while navigating a short-term recovery from a recent corrective phase. Price has rebounded strongly from the 1031–1019 demand zone, an area that has historically attracted buyers and acted as structural support. The current price is stabilising near the 1079 balance area, which now serves as a key near-term reference for structure. Holding above this zone keeps the short-term structure constructive and allows price to test higher reaction zones near 1089–1101, where prior supply has emerged. Acceptance above these zones would be required to improve directional confidence. On the downside, any sustained weakness below 1053 initially, and more importantly below 1031, would increase downside risk toward deeper demand and signal a return to range-bound or corrective behaviour. As long as price remains above the primary demand zone, the broader uptrend framework remains intact.
Indicator readings from the green dashboard support a developing bullish structure but with conditions. The presence of a strong bullish candle reflects renewed buyer initiative after consolidation, while Bollinger Band behaviour highlights a prior compression phase now transitioning into early expansion. The BB squeeze context increases the relevance of the current move, suggesting improving volatility conditions rather than a late-stage rally. RSI near 60 indicates strengthening internal momentum without entering stretched or overbought territory, supporting continuation potential while keeping exhaustion risk contained. Price holding above short-term trend measures and VWAP reinforces near-term stability. However, interaction with a wide projected CPR structure suggests that the market environment still favours balance and consolidation, meaning follow-through and acceptance matter more than single-session strength.
Volume behaviour adds an important layer of confirmation. Participation has expanded during bullish candles, indicating active buyer involvement rather than a low-liquidity bounce. Volume intensity remains around healthy levels (Vol X ~1.3), showing interest without signs of climax or emotional excess. Recent pullbacks have not been accompanied by aggressive selling volume, suggesting that supply is being absorbed rather than distributed. Overall, volume dynamics support a controlled recovery and align with accumulation-type behaviour rather than exhaustion.
From a short swing perspective, JINDALSTEL maintains a constructive bias as long as price holds above the 1031–1019 demand zone. If acceptance improves above nearby supply, higher range-expansion reference zones around 1192–1278 come into focus over the coming sessions. Conversely, sustained acceptance below 1019 would elevate downside risk and indicate a shift from recovery into a deeper corrective or range phase. Until such a failure occurs, consolidation above demand should be viewed as structural digestion rather than weakness.
Final Outlook (Condition-Based):
Momentum is strong and improving, the broader trend remains upward, risk stays elevated due to nearby supply and a wide CPR environment, and volume remains supportive but requires continued follow-through.
💡 STWP Learning Note
Strong candles initiate moves; structure and acceptance decide sustainability.
⚠️ Disclaimer
This post is shared strictly for educational and informational purposes. It is not investment advice or a recommendation. Please consult a SEBI-registered financial advisor before making any financial decision.
🚀 Stay Calm. Stay Clean. Trade With Patience.
COLPAL - STWP Equity Snapshot📊 STWP Equity Snapshot – Colgate-Palmolive (India) Ltd (COLPAL)
(Educational | Chart-Based Interpretation)
COLPAL has transitioned from a corrective phase into a demand-led recovery, with price reacting decisively from the 2097–2074 demand zone. This zone has historically attracted buyers, and the recent rebound reflects active absorption of selling pressure rather than a passive bounce. Price is now stabilising around the 2184 balance area, which acts as an important near-term reference. Sustained holding above this zone keeps the short-term structure stable and allows price to test higher reaction zones between 2288 and 2358, where acceptance will determine continuation quality. On the downside, any weakness below 2184 increases risk toward 2138 initially, followed by a deeper retest of the 2097–2074 primary demand zone, where the broader structure would be reassessed. As long as price remains above this demand band, the larger trend framework stays constructive.
Indicator readings from the dashboard support this developing structure. The presence of a strong bullish candle emerging after a period of consolidation indicates renewed buyer initiative. Bollinger Band behaviour shows prior volatility compression, with early signs of expansion now appearing, suggesting a shift from balance toward directional intent rather than a late-stage move. The BB squeeze context increases the relevance of the current expansion attempt, while RSI near the bullish mid-zone (~60) reflects improving internal strength without signs of exhaustion. Price holding above short-term trend measures reinforces near-term stability. At the same time, interaction with a wide CPR structure suggests that the market remains in a balanced environment, where consolidation, pauses, or controlled pullbacks toward value zones are more likely than immediate acceleration. Acceptance and follow-through remain more important than candle size alone.
Volume behaviour adds important confirmation to the price structure. Participation has expanded during bullish candles, indicating genuine buyer involvement rather than a low-liquidity reaction. Volume intensity remains within a healthy range, with no signs of climax or exhaustion typically associated with late-stage moves. Pullbacks have occurred on relatively lighter volume, suggesting that selling pressure is being absorbed rather than aggressively expanding. Overall, volume dynamics align with a controlled recovery and support the view that the move is being built through participation rather than emotion.
From a short swing perspective, COLPAL maintains a positive structural bias as long as price holds above the 2097–2074 demand zone. If acceptance improves and momentum sustains, higher range-expansion reference zones between 2388 and 2541 come into focus over the coming sessions. Conversely, sustained acceptance below 2074 would elevate downside risk and indicate a transition from recovery into a deeper corrective phase. Until such failure occurs, consolidation above demand should be viewed as healthy digestion of gains rather than structural weakness.
Final Outlook (Condition-Based):
Momentum is moderate and improving, the broader trend remains upward, risk stays elevated due to the recovery nature of the move and nearby supply, and volume remains supportive but requires continued follow-through.
💡 STWP Learning Note
Strong recovery candles show intent — confirmation comes only with acceptance above supply.
⚠️ Disclaimer
This post is shared strictly for educational and informational purposes. It is not investment advice or a recommendation. Please consult a SEBI-registered financial advisor before making any financial decision.
🚀 Stay Calm. Stay Clean. Trade With Patience.

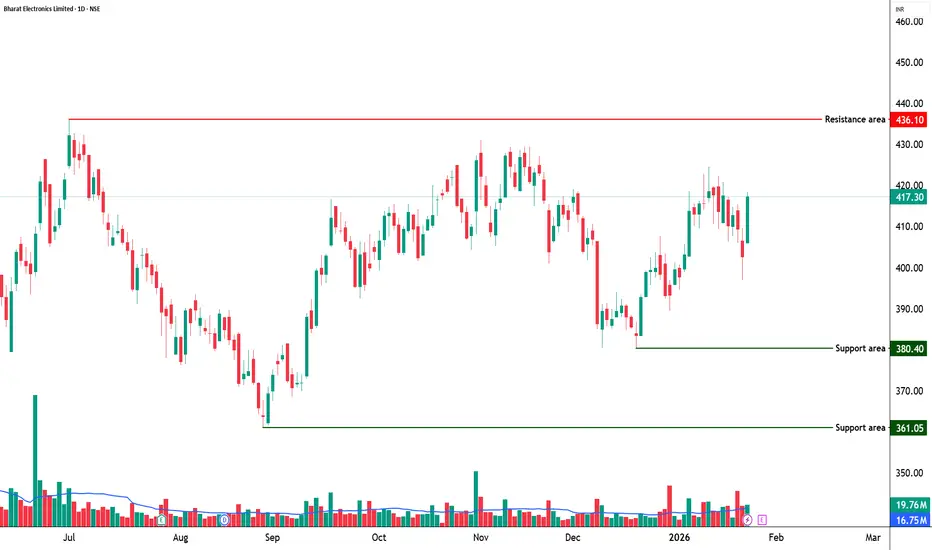
BEL - STWP Equity Snapshot📊 STWP Equity Snapshot – Bharat Electronics Ltd (BEL)
(Educational | Chart-Based Interpretation)
Market Structure
BEL continues to trade in a structurally strong uptrend, characterized by higher highs and higher lows on the daily timeframe. Recent price action reflects consolidation after a sharp upward expansion, suggesting digestion of gains rather than distribution. The broader structure remains constructive, with price holding above key support zones and maintaining bullish alignment.
Demand–Supply Structure
Price has respected a well-defined demand zone in the 402–397 region, where buyers have consistently defended declines. The recent bullish reaction from this area indicates demand absorption and willingness to support price at higher value levels. Overhead supply is visible near recent highs, but selling pressure appears controlled, indicating healthy supply management rather than aggressive profit booking.
Key Levels – Daily Timeframe
Primary demand zones are placed near 409, followed by deeper structural support around 402–397. These zones represent areas where buyers have previously stepped in with conviction. On the upside, resistance and reaction zones are located near 421, 426, and 434, which may act as pause or acceptance areas during further upside attempts.
What the Chart is Saying
Momentum remains supportive, with RSI holding near 57–58, reflecting healthy strength without signs of exhaustion. Price continues to trade above key moving averages, reinforcing trend integrity. Volume participation remains above average during bullish candles, suggesting continuation interest rather than speculative activity.
CPR Impact
BEL is trading above the CPR pivot with a relatively narrow CPR structure, which generally supports directional continuation rather than range-bound behavior. Acceptance above the CPR zone indicates short-term bullish control. However, the projected CPR ahead appears wider, hinting at the possibility of brief consolidation before the next directional phase.
Additional Structure Observations
Recent pullbacks have been shallow and followed by strong recovery attempts, indicating dip-buying behavior. Short-term moving averages remain positively aligned, while the longer-term structure continues to slope upward. The absence of heavy selling volume during declines suggests effective absorption of supply. Overall, the structure supports continuation, subject to normal consolidation and acceptance checks.
Intraday Reference Levels (Structure-Based)
The 418 zone acts as the near-term balance area and remains the key intraday reference. Sustained holding above 418 keeps the structure stable and supports upside testing toward the 436–449 zone, which represents upside reaction areas where price may pause or require acceptance. On the downside, weakness below 418 increases risk toward the 402–397 demand zone, where intraday structure would be reassessed. These levels define intraday risk versus opportunity, not directional certainty.
Swing Reference Levels (Hybrid Model | 2–5 Days)
From a short-term swing perspective, BEL remains within a positive structural framework as long as price holds above the 402–397 primary demand zone. If strength sustains, the 449–473 zone emerges as a higher range-expansion reference area over the coming sessions. Conversely, sustained acceptance below 397 would elevate downside risk and indicate a shift from consolidation toward deeper corrective behavior. Until such failure occurs, consolidation above demand should be viewed as constructive.
Final Outlook (Condition-Based)
Momentum remains strong and supportive of the prevailing structure. The trend is clearly up, with buyers maintaining control above key demand zones. Risk remains elevated due to proximity to resistance and recent price expansion, while volume stays moderate and healthy, supporting continuation rather than exhaustion.
💡 STWP Learning Note
Strong trends often pause through consolidation, not reversal.
Respect structure and let price confirm continuation.
📘 STWP Approach
Observe price. Respect risk.
Trade structure, not prediction.
⚠️ Disclaimer
This post is shared strictly for educational and informational purposes.
It is not investment advice or a recommendation.
Please consult a SEBI-registered financial advisor before making any financial decision.
🚀 Stay Calm. Stay Clean. Trade With Patience.
GOLD - Breakout Continues, Bullish Momentum Remains StrongGold prices have attracted fresh buying interest for a second consecutive session, reaching a new all-time high and currently trading around $4,710.
The key driver behind gold’s strength is the ongoing global geopolitical and trade uncertainty. Hawkish statements regarding U.S. tariffs and foreign policy, along with the risk of escalating tensions among major economies, have significantly boosted safe-haven demand. In this environment, gold continues to reaffirm its role as a store of value, drawing strong attention from investors worldwide.
Beyond political factors, investment flows into precious metals are clearly increasing. Global gold ETF holdings have risen steadily over recent weeks, signaling long-term market confidence. Notably, strong buying demand from Asia—especially China—is viewed as a major pillar supporting gold’s sustained upward momentum.
🔎 Key Economic Events to Watch This Week
Wednesday: U.S. President Donald Trump speaks at the WEF; U.S. Pending Home Sale
Thursday: U.S. Q3 GDP (final reading), PCE Price Index, Weekly Jobless Claims
Friday: U.S. S&P Preliminary Manufacturing and Services PMI

Chumtrades XAUUSD H2 | Is the Liquidity Sweep Over?Chumtrades – XAUUSD H2 | Has the Liquidity Sweep Finished, or Is There More Downside Ahead?
On Friday, the market reacted strongly after Trump’s comments regarding Kevin Hassett, when Trump expressed his preference for Hassett to remain in his current role rather than taking a new position.
👉 As a result, gold printed a long wick liquidity sweep back into the prior ATH zone, around 4530–453X, before closing back above 456X.
This brings us to the key question:
Was this sweep enough for the BUY side, or is the market still looking to test lower levels?
Political developments will be a key driver for gold direction in the coming week.
📰 Key Political Factors to Monitor
1. Trump – Greenland
The US has imposed 10% tariffs, with the possibility of increasing them to 25% on countries that do not support the annexation of Greenland
No fixed deadline, tariffs remain until Greenland becomes part of the US
→ This is a supportive factor for gold, especially amid rising geopolitical uncertainty
→ This news may directly impact the market open
→ If price reacts strongly, avoid SELLs near resistance
2. Iran – Protests
Monitor the risk of Trump returning to direct intervention
→ A potential headline-driven volatility trigger
🟢 Key Support Zones to Watch
4530 – 4535
4515 – 4510
4480 – 4482
4462
4410 – 4407
🔴 Key Resistance Zones to Monitor
4618 – 4628
4648 – 4650
4655 – 4660
4698 – 4699
⚠️ Trading Notes
Price levels are zones for observation, not instant entry points
SELL setups around 462X must be evaluated based on news reaction
If momentum accelerates on headlines → stay flat and avoid trading against strength
💬 Question for the New Week
Is the market finishing its liquidity collection on the BUY side,
or was Friday’s sweep the final test before the next leg higher?
📌 Follow Chumtrades for proactive market analysis, structured trade planning, and risk management insights.

Gold Before CPI: Top or Trap?Catching Gold’s Top Before CPI: A Good Trade or a Psychological Trap?
🧭 1. STRATEGIC CONTEXT
Primary trend: GOLD remains in an uptrend; the higher-timeframe structure is still intact.
Macro backdrop:
CPI tonight may cause short-term volatility.
However, geopolitics is currently a stronger driver than CPI.
Key geopolitical risks:
Greenland tensions → escalating global strategic rivalry.
Protests in Iran, power and internet cuts → rising Middle East risks.
👉 Strategic implication:
Gold continues to be supported as a safe-haven asset → pullbacks are for buying, not for chasing shorts.
📊 2. CURRENT MARKET STRUCTURE
Price is:
Holding the ascending trendline
Consolidating in a box, compressing ahead of CPI
Market condition:
High probability of false breakouts
Top-catching traps are very likely before the news
📍 3. KEY PRICE LEVELS
🔴 RESISTANCE
4,680 – 4,700
→ Previous high / ATH zone
→ Reactive sells only if clear rejection appears
4,655 – 4,660
→ Intermediate resistance, easily swept pre-CPI
🟣 CONSOLIDATION BOX
4,595 – 4,630
→ Sideways range ahead of CPI
→ No FOMO inside the box
🟢 SUPPORT
4,545 – 4,550 → Major confluence support
4,480 → Medium-term support, trendline retest
4,420 → Deep support, last bullish structure zone
📝 4. IMPORTANT NOTES
Higher CPI:
May trigger a technical pullback
❌ Does NOT automatically mean a top
Lower / in-line CPI:
Gold may consolidate above highs and break ATH
Selling before CPI:
→ Reactive scalps only, no holding
Buying:
→ Only when price reaches key zones with clear reaction
🎯 5. STRATEGIC MINDSET
❌ Don’t force top-catching while geopolitics supports gold
✅ Focus on risk management – wait for zones – wait for confirmation
🧠 Before CPI: survival > profit

Political instability can gold rebound to the previous ATH?Political instability: Venezuela’s President Maduro arrested – Can gold rebound to the previous ATH?
1️⃣ Market Context
The overall structure remains bullish.
Price is undergoing a short-term correction after a strong volatile move.
The 4300 area is acting as a key support zone.
RSI shows buy–sell convergence; bulls are gradually absorbing bears, keeping downside pressure well controlled.
2️⃣ News & Fundamental Factors
Geopolitical tension: Venezuela attacked by the U.S., President arrested and transferred to the U.S.
Expectation of a gap and bullish move in gold in the upcoming session.
Current news flow continues to support a positive outlook for gold.
3️⃣ Main Scenario
Priority scenario: Price holds above 4300 and resumes the bullish structure.
Key intraday levels to watch:
Support: 4300–431X, 4270–4275
Resistance: 4370–4375, 4402–4404
Focus on shallow pullbacks in line with the main trend.
4️⃣ Trading Strategy (Intraday / Weekly)
Trend-following remains the core approach, while being prepared for minor pullbacks to avoid missing moves.
Closely monitor price reactions at:
4300: Nearest support, currently holding well.
437X: Potential intraday reaction zone.
Always wait for price action confirmation, avoid entries in the middle of the range.
5️⃣ Extensions & Notes
If 4300 breaks decisively:
Deeper correction toward 427X, 425X
Further extension to 417X, a zone worth watching for swing opportunities.
Volatility remains high → risk management is the top priority.
✨ Wishing everyone a profitable new week.

CAMS Story Repeating?Hello Traders,
CAMS has now formed similar chart pattern what it had form earlier on 1W Timeframe.
Pattern 1:
We saw a good retractment after rally in 2022. 0.38 was the fibo resistance in this time.
It went in consolidation till Aug 2023, when it finally started showing upmove. During this time, we can also see that Money Flow Index had show breakout but didn't sustained. However, the rally was continued.
Pattern 2:
After making All Time High in late 2024, it retraced and went sideways. And had retraced back till 0.50 fibo level, stronger pull back than the earlier(Pattern 1) pull back which was 0.38. Later it went sideways just like Pattern 1.
Now recently we have seen same MFI pattern of breakout and same like Pattern 1, i.e not sustaining, and not sustaining.
We haven't seen the price wise breakout yet in the stock.
However, there are two more common things here, the belt-hold candles formations in both the pattern 1 and 2.
And the rise and decline in volume.
I will be keeping close eye on this stock. Looks like it may show upmove just like pattern 1.
Note: This post is for information purpose only. Don't consider this as trading or investment recommendation or tip.

TATA Elxsi on 1W TFHello Traders,
TATA Elxsi had taken support in April 2025 and bounced back from around 4800 levels.
After that, it has been in Sideways to bearish trend and have agin tested support zone last month.
There was strong pull back seen in the week of 15th Dec 2025. Also this week's closing is with Dragonfly canclestick with less volume.
It seems this is and consolidation phase and it may get trendy after the breakout after closing above 5600 on weekly basis.
Let's see how this stock moves further from current zone.
Note: This post is for information purpose only. Please do not consider this as Trading or investment recommendation.

Sun Pharma Beakout on 1W TFHello Traders,
Sun Pharma had given the breakout, retested the trendline, and had formed the green candle closing this week. Previous resistance zone can act as support. Target are recent high and the all tiem high. RR ratio is about 2.7 which looks pretty good for swing trade.
Note: This post is for information purpose only. This is not any trading or investment advice.

Chumtrades XAUUSD Weekly Key Levels
Bias: Still favor BUY with the primary trend, watching for pullbacks to lower levels.
Support zones
4307 – 4300 (near-term support, key area to watch)
4260 – 4255 – 4250 (intermediate support)
4178 – 4168 (deep support, strong demand)
Resistance zones
4404 – 4413
4445 – 4465
4500 (ATH)
Weekly / Intraday scenario
Market is likely to trade in a range today.
Expected range:
Lower bound: 4300
Upper bound: 4513
👉 Overall strategy: Monitor price reaction at support zones, especially 4300 and below.

Gold Futures | Bullish Reversal Setup from Demand ZoneThis chart shows a bullish setup on Gold Futures (GC1!) based on a pullback into a 2-Hour + 125-Minute Demand Zone confluence due to FII's pending orders.
I’m expecting the price to retrace back into the marked demand area before continuing higher toward the upside targets.
Plan
• Entry: Inside the 2H & 125m Demand Zone
• Stop Loss: Just below the zone
• Target 1: 4,401
• Target 2: 4,438

Chumtrades XAUUSD Any pullback is an opportunity to buy higher.This morning’s move was a corrective sell-off, best understood as profit-taking from BUY-side, not a trend reversal.
The overall structure remains within a rising trend channel, with no sign of a structural break → BUY bias stays intact, looking to buy pullbacks in line with the trend.
🟢 Key Support Zones
447x: near-term support (4476 – 4472 – 4470)
4450 – 4455
4430 – 4435
🔴 Key Resistance Zones
4548 – 4550
4560 – 4565
4599 – 4600 (upper resistance)
📌 Additional Note
453x is a mid-zone to watch closely for price reaction.
📊 Intraday Expectation
Price is expected to range sideways on the H2 timeframe
Range high: 4549
Range low: 4473
→ Possible BUY near the lower boundary and SELL near the upper boundary if the range holds.
⚠️ Risk Management
No major news at the moment; price is mainly driven by technical flows.
Holiday period → thin liquidity, higher risk of stop hunts.
Keep stops reasonable and avoid overtrading.
Wishing everyone a productive trading day.
