Institutional Trading MasterclassCore Structure of Institutional Option Trading
Institutions focus on 4 pillars:
A. Direction
Will market go up, down, sideways?
B. Volatility
Will movement increase or decrease?
C. Time Decay
How much premium melts daily?
D. Risk Exposure
How much capital at risk?
Rules to Become Consistent
Never trade without plan
In-depth trading ideas
SILVER VIEW⚠️Education Purpose only!!!!
Key Support area:-87,100
Key Resistance area:-96,200
Silver has long been considered a 🏦 store of value and a 🛡️ hedge against inflation.
Riskier but suitable for speculation and hedging.
🔧 Industrial Demand – Used in ⚡ tech, ☀️ solar, 🚗 EVs
💰 Monetary Hedge – Safe-haven in 🔥 inflation & 📉 downturns
⛏️ Supply Constraints – Limited mining, rising demand 📊
📊 Growing Investment – ETFs & retail piling in 🚀
⏳ Long-Term View
If industrial demand and inflation persist,
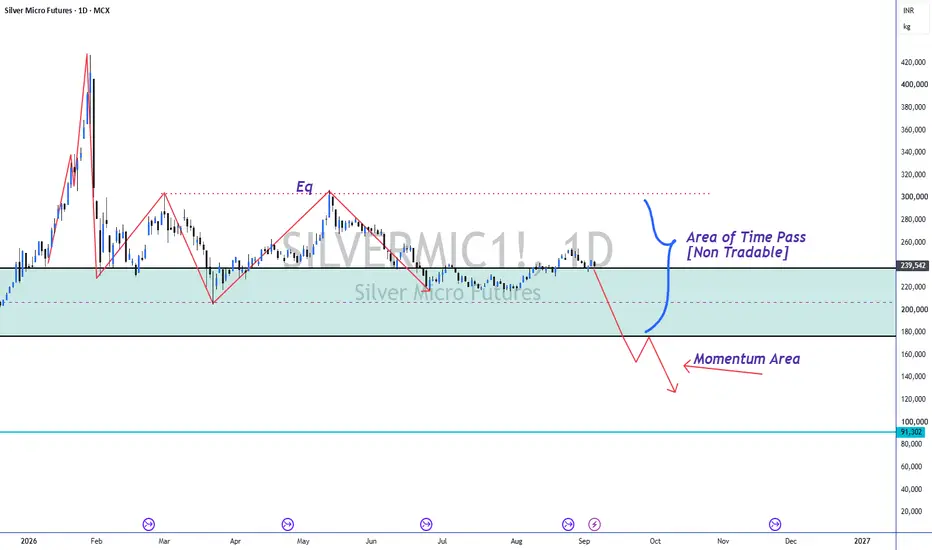
SILVERMIC: Volatility Compression at Major ResistanceCategory: Technical Analysis
Bias: Long
Timeframe: 1D (Daily)
The Macro Sentiment & Setup
Silver is currently sitting at a fascinating crossroads. Driven by shifting global macroeconomic winds and its dual identity as both a precious safe-haven and a critical industrial metal, market sentiment is pivoting from bearish exhaustion to quiet accumulation.
Looking at the SILVERMIC1! daily chart, we are witnessing a textbook volatility squeeze. Following a steep corrective leg, price action has been
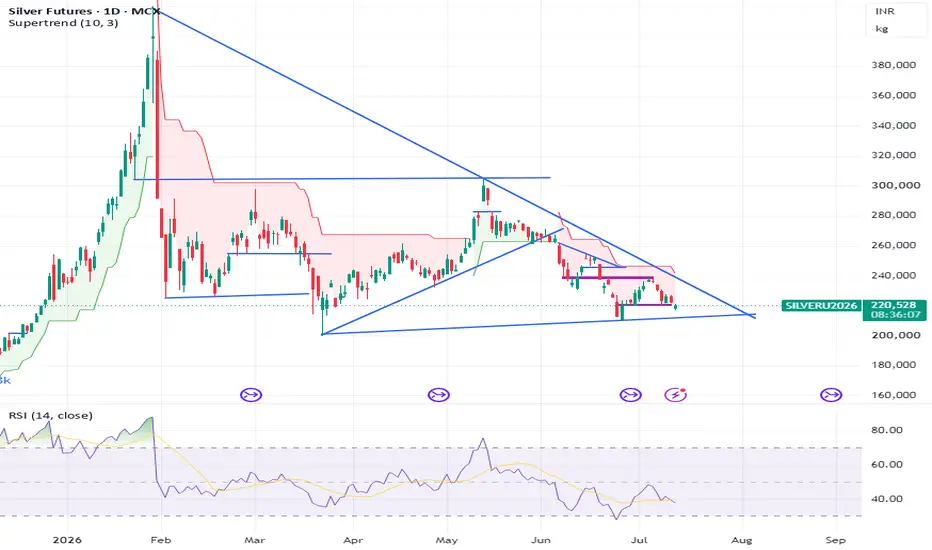
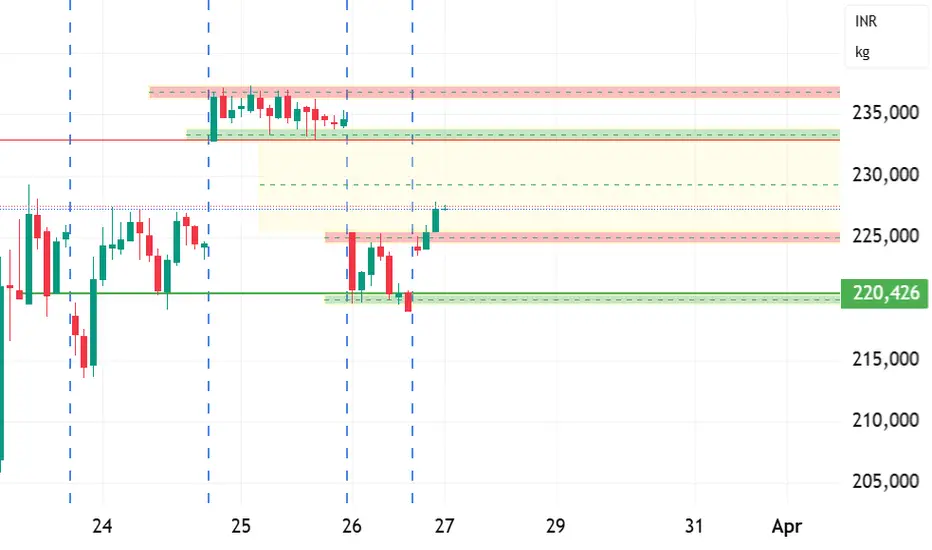
silver short term update as per chart in trend line formation some analysis here may be i wrong but will try to best .
daily chart showing bear mode only yes some bounce back may be happen.
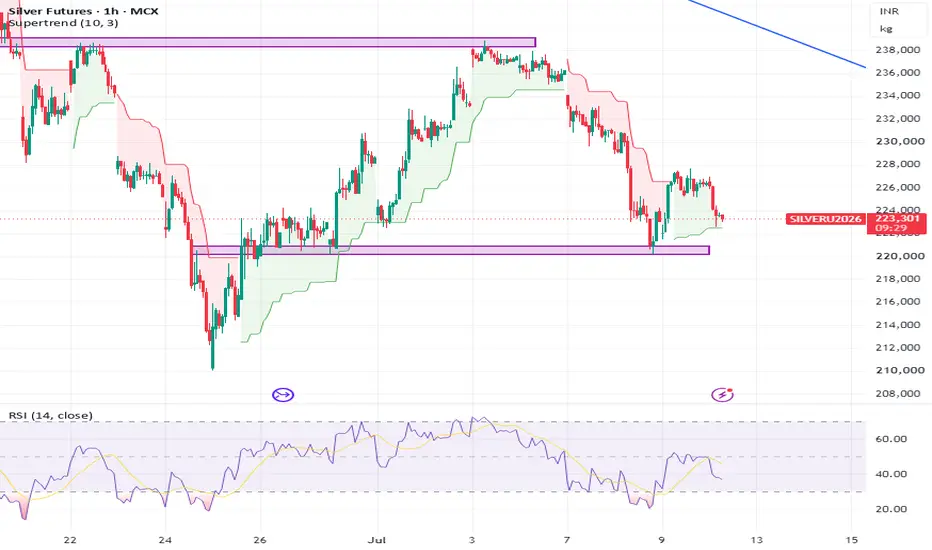
hurdle 225--228300 if sustain above or close above than looks sharp up side 232--238000+++ or above 240000 see fire boom 260000+++ near. where if sustain below 220000 than again down side 218--215000 than after 210700 or may be 202000--197000++++ soon. so close eyes on level
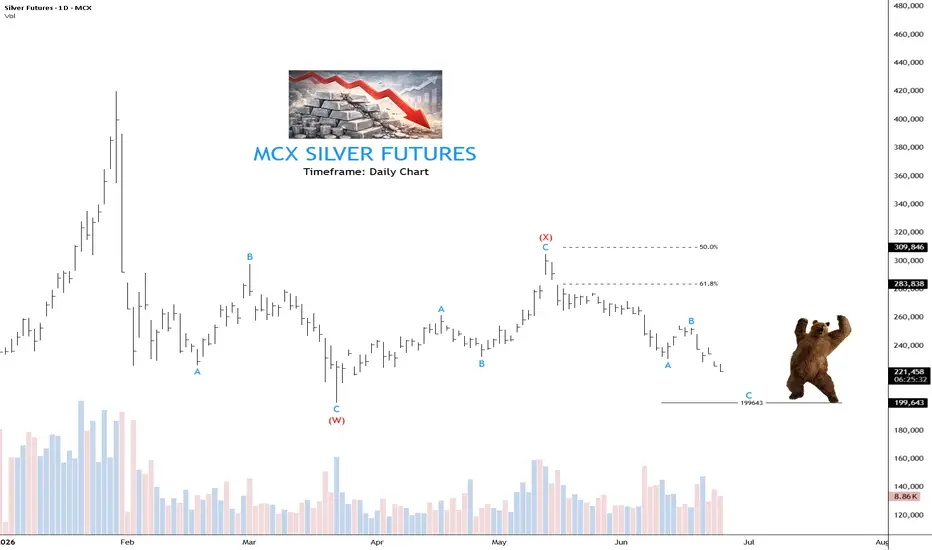
MCX Silver Futures: May Test The 199600–194000 Support AreaTrading Outlook for MCX:SILVER1!
=============================
Silver Futures remain under pressure after a corrective recovery failed near 3,04,900 . The current decline may extend towards the 1,99,600–1,94,000 support zone. The overall short-term outlook remains negative while prices stay below the recent high.
Remember: a sustained move above the recent high would weaken the current bearish outlook.
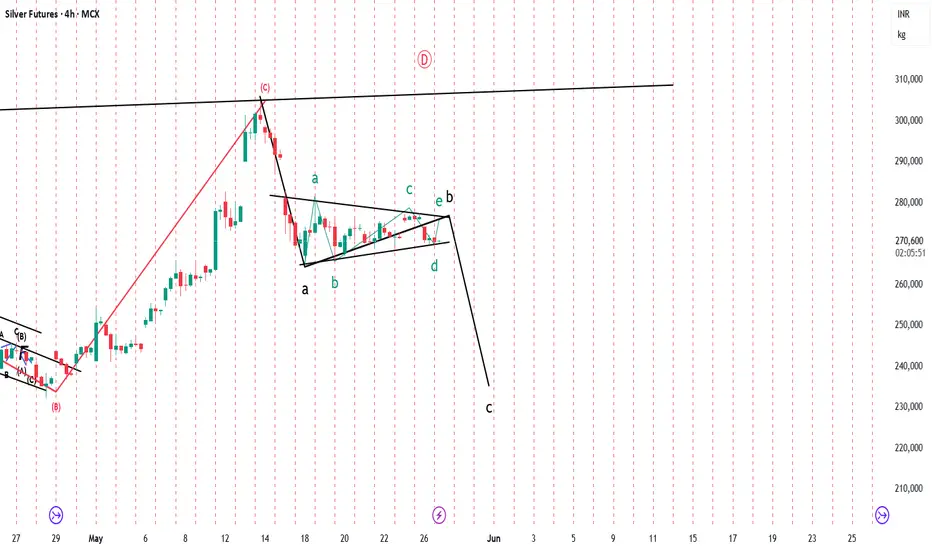
Silver Ready for Big fallWhy Silver Looks Bearish
Several technical factors are now aligning toward a bearish outlook:
1. Completion of Corrective Structure
The triangle consolidation appears mature, with all five internal legs potentially completed.
2. Weak Recovery Momentum
Despite multiple attempts, Silver has failed to reclaim higher resistance levels, showing lack of strong buying participation.
3. Lower High Formation
The structure continues to print lower highs after the major top, indicating seller domina
Institutional Trading Masterclass Part - 2Core Structure of Institutional Option Trading
Institutions focus on 4 pillars:
A. Direction
Will market go up, down, sideways?
B. Volatility
Will movement increase or decrease?
C. Time Decay
How much premium melts daily?
D. Risk Exposure
How much capital at risk?
Rules to Become Consistent
Never trade without plan
Never increase size emotionally
Never revenge trade
Protect capital first
Focus on process daily
Take breaks after losses
Journal every trade
Stay physically healthy
Sleep p
MCX Silver Futures (DTF)Is Silver ready to Shine again?, as Crude Plummets and Investors Looks For Safe Haven.
Silver futures are showing strong upward momentum, breaking past key resistance levels on notable volume.
This price action aligns with broader market weakness in commodities, as seen in Crude, and increasing demand for safe-haven assets.
The chart indicates a potential reversal from a recent consolidation pattern, with key support holding firm.
*For Educational Purpose Only.
Silver (SI!) May Levels
Silver is now trading above equilibrium, which means the market has tilted constructive.
However, price is still close enough to the mean that this remains a build vs fail zone, not a confirmed trend breakout yet.
The key shift:
Equilibrium is now acting as support, not resistance.
...................................................................................
1) Continuation Case — “Above equilibrium → push into upper rail”
Trigger
Hold above 74.6–74.9 (Equilibrium zone)
Targets
81.4–82.
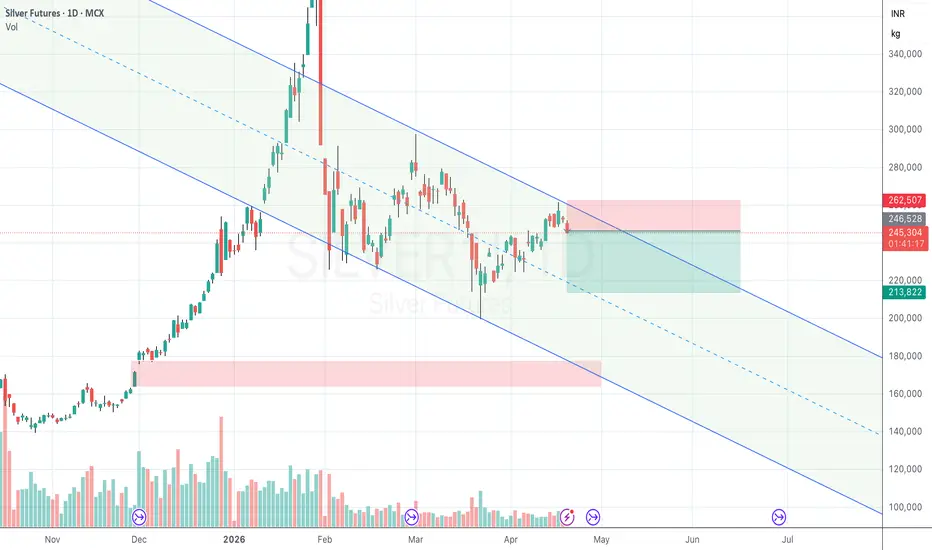
Silver – Sell-on-Rise View Inside Descending ChannelSilver is trading inside a clear descending channel on the daily chart. The current bounce is approaching an important resistance / supply zone, where price may face rejection again. As long as price stays below this resistance and within the channel structure, the bias remains bearish. Lower High is printed, if bearish trend continues, we will see lower low, completing the ABC correction wave.
Invalidation:
A strong breakout and sustained close above 262,600.
Potential downside target:
SILVER (SI!) April ForecastThis is a market-structure map from my NeuralFlow algorithm — educational only. No trade calls, no signals, no recommendations.
Context:
Silver is entering April near the monthly equilibrium zone, which makes this a true decision month rather than a clear premium-trend or deep-repair setup. The market is sitting close enough to balance that April will likely be defined by which side of equilibrium gains acceptance first. If Silver can hold equilibrium and build above it, the structure opens int
Levels of silver This content is for educational and informational purposes only. I am not a SEBI-registered advisor. All analysis shared on Bank Nifty or any financial instrument is based on personal views and market understanding. Trading and investing involve risk, so please do your own research or consult a certified financial advisor before making any decision. I am not responsible for any profit or loss.
During the market commodity
MCX Silver Analysis: Key Resistance and RSI WarningSilver futures on MCX rose more than 5% today and are trading near ₹2,40,892 per kg.
The rise came after news of possible peace talks in the Middle East war. This led to a sharp fall in crude oil and a rally in precious metals like silver.
However, the daily chart shows a different picture:
Price has formed a lower high near ₹2,79,463.
A clear rectangle resistance zone is marked on the chart.
The red 50-day moving average is acting as a ceiling.
The green trendline is providing suppor
SILVER:LIKELY ASCENDING SWING BREAKOUTSILVER:Trading at 74.3USD.
1.Has given 10DEMA Golden Crossover Vs 20DEMA/50DEMA/100DEMA in Hourly chart
2.In 4-Hr Chart the reversal seems to be effective and has formed Ascending Tri-angle breakout
3.Neckline breakout stands at 74-75
4.Holding above 74-75 likely to test 80+USD as per the pattern to give a swing breakout(For educational purpose only)
SLong
levels of silver This content is for educational and informational purposes only. I am not a SEBI-registered advisor. All analysis shared on Bank Nifty or any financial instrument is based on personal views and market understanding. Trading and investing involve risk, so please do your own research or consult a certified financial advisor before making any decision. I am not responsible for any profit or loss.
levels of silverThis content is for educational and informational purposes only. I am not a SEBI-registered advisor. All analysis shared on Bank Nifty or any financial instrument is based on personal views and market understanding. Trading and investing involve risk, so please do your own research or consult a certified financial advisor before making any decision. I am not responsible for any profit or loss.
Silver for A-B-C corrective structureAfter a strong impulsive upmove, Silver appears to have entered a corrective phase.
On the daily chart, price seems to be forming an A-B-C corrective structure within a rising channel.
What the chart suggests:
The sharp fall from the top marks the beginning of the correction.
Price then formed a recovery leg toward (B), but it failed to sustain higher.
The current move looks like the (C) leg, where price is drifting back toward the lower channel support and the highlighted demand zone.