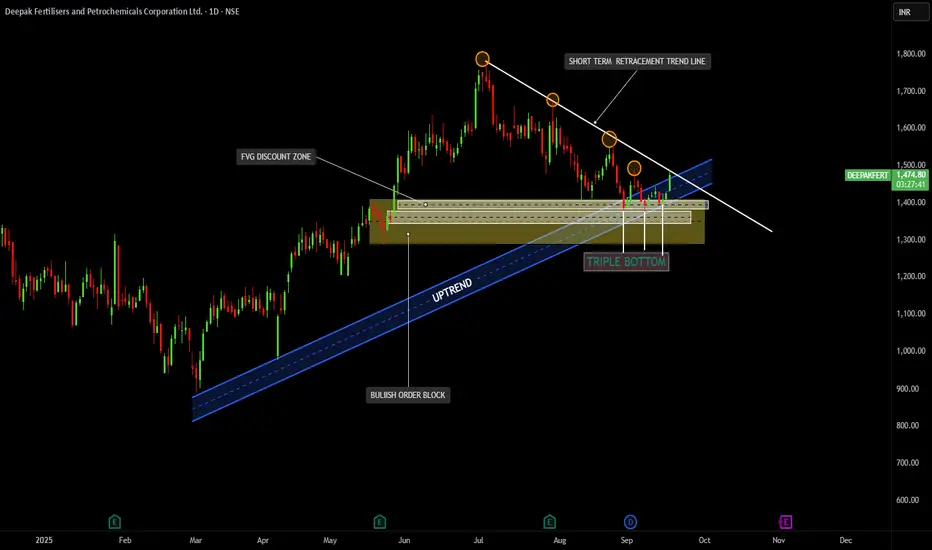
DEEPAK FERTILIZERTrend Structure:
The stock has been in a primary uptrend (marked with the blue ascending channel).
Recently, it went into a short-term retracement with a downward sloping trendline (white).
Support & Demand Zones:
Strong Bullish Order Block and FVG Discount Zone around the ₹1350 – ₹1400 level, w

The best trades require research, then commitment.
Get started for free$0 forever, no credit card needed

Scott "Kidd" PoteetThe unlikely astronaut

Where the world does markets
Join 100 million traders and investors taking the future into their own hands.
Major indices
HFCL BY KRS CHARTS17th September 2025 / 9:21 AM
Why HFCL?
1. First of all, its second time it's in my radar, previously we had more than 40% Return on this one and still long-term Target has been still loading 225 Rs.
2. 1M TF is making Higher High with current price level previously it breaks from flag

Bharat Electronics Ltd. - Stock AnalysisDate : 16-Sep-2025
LTP : Rs. 402.90
Technical View:
• NSE:BEL is in primary uptrend since Apr 2025 and was recently going through it's secondary downtrend within primary uptrend.
• From it's all time high of 436 on 1-Jul-2025, it has retraced 17% to 361.20 on 28-Aug-2025 which is also close to

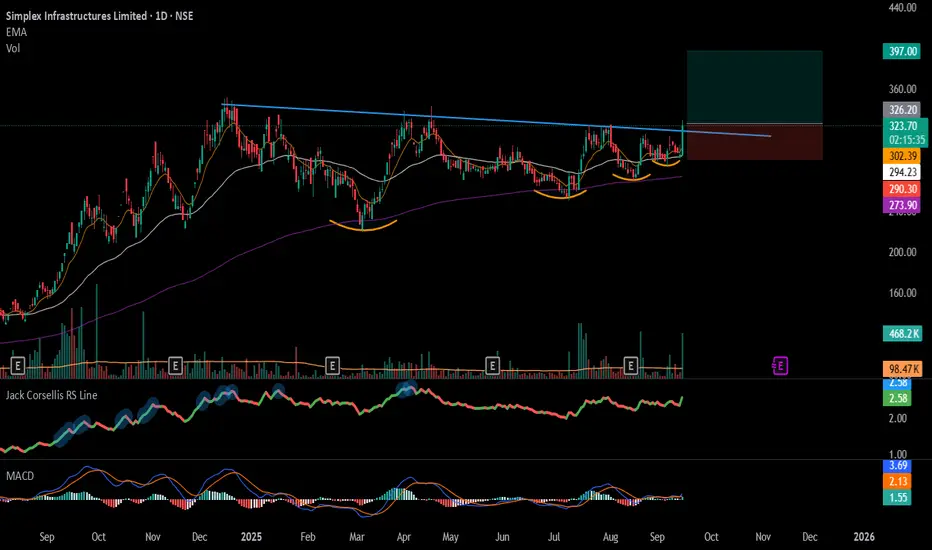
#SIMPLEXINF - TrendLine Breakout in Daily Time FrameScript: SIMPLEXINF
Key highlights: 💡⚡
📈 TrendLine Breakout in Daily Time Frame
📈 Volume spike during Breakout
📈 MACD Bounce
📈 Can go for a swing trade
BUY ONLY ABOVE 325 DCB
⏱️ C.M.P 📑💰- 322.25
🟢 Target 🎯🏆 – 22%
⚠️ Stoploss ☠️🚫 – 11%
⚠️ Important: Market conditions are Okish, Position size 50%
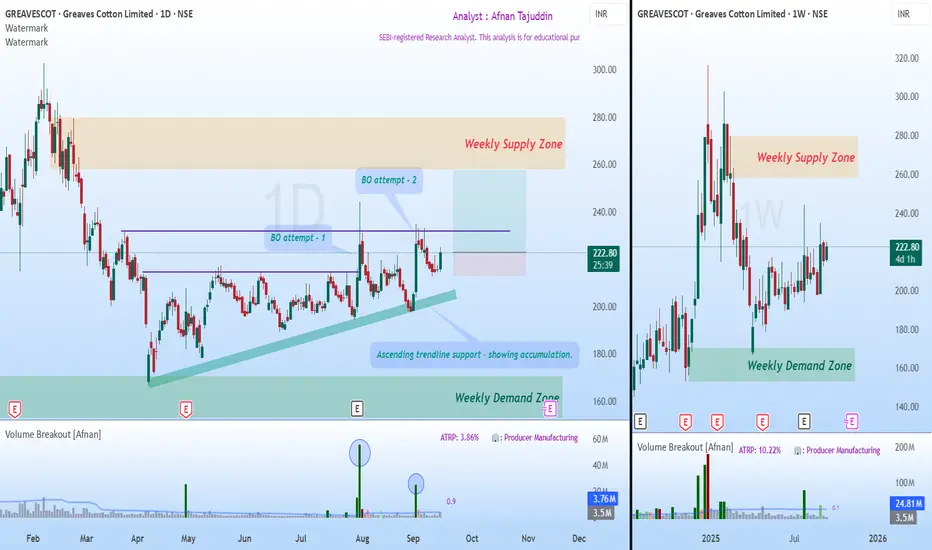
Accumulation and a Possible Breakout Towards Weekly Supply📈 Market Trend and Structure 📈
After forming an all-time high, price began its decline and developed a weekly supply zone . This supply zone now stands as the major target area for buyers.
Following the decline, price touched the weekly demand zone , which acted as a powerful reversal point
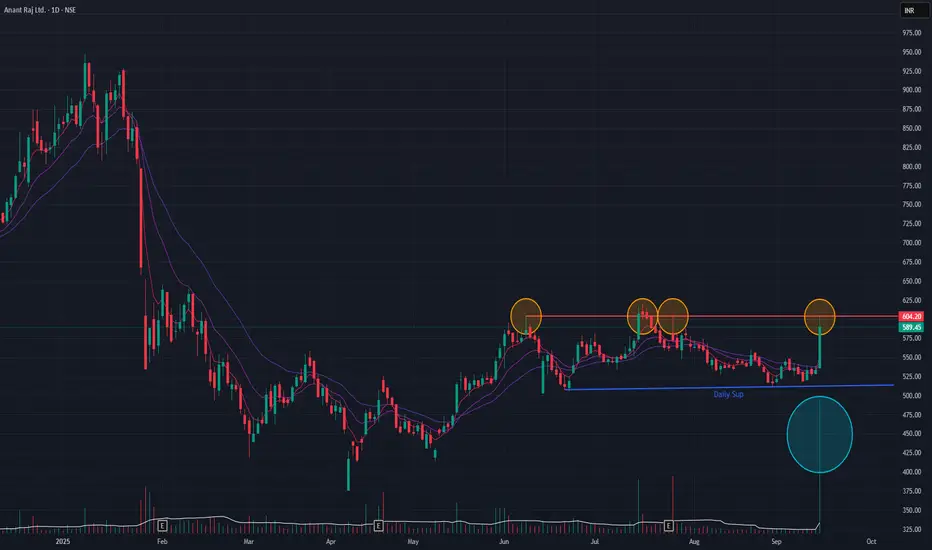
Anant Raj (Daily Timeframe) - Potential BreakOut candidate ??Following a downtrend that began in January 2025, Anant Raj has been in a sideways consolidation phase since May 2025. After several failed breakout attempts from this range, the stock demonstrated significant buying interest today, surging +10.53% on substantial volume.
While this move is positi
bankniftyI feel that bank nifty and axis bank has shown good recovery in the past two weeks. With axis bank closing over 200 dma and with strong gains for last three days, the momemtum should continue. Good time to buy for investors and traders as one can go positionally long here with targets of 1140 and

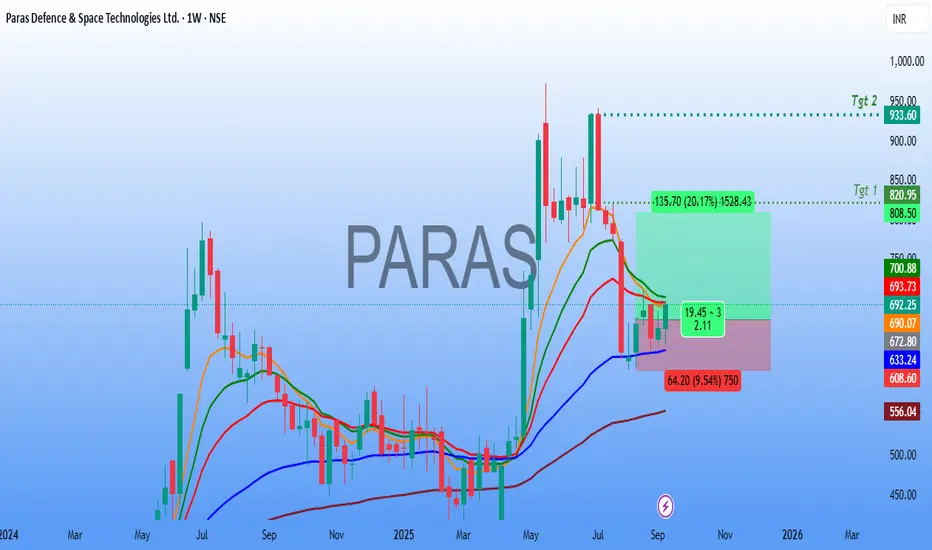
Paras Defence Technical Analysis🚀 Paras Defence & Space Technologies Ltd – Weekly Chart Analysis
The stock is showing signs of a potential reversal after consolidating near key support zones.
🔎 Technical Observations
Price Action:
After a prolonged decline from the highs, the stock has stabilized around the ₹640–660 support regi
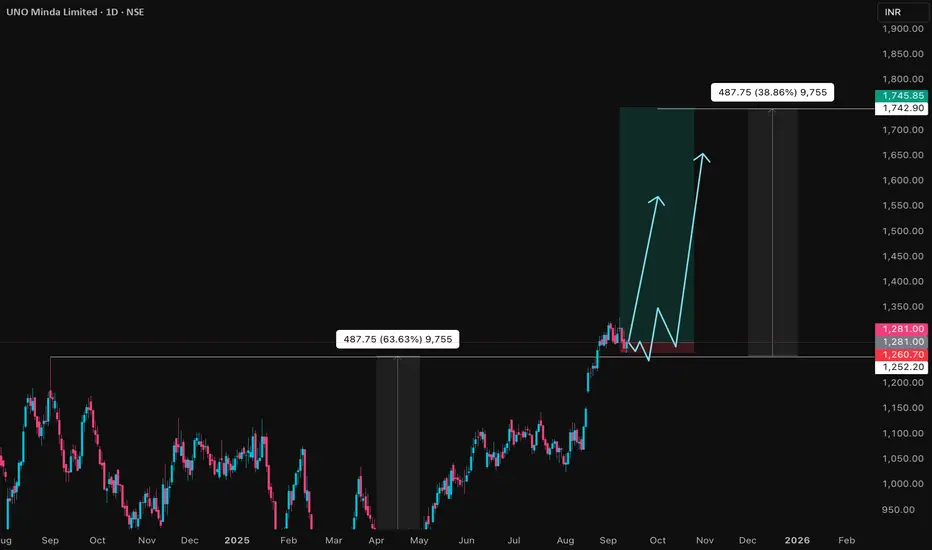
UNOMINDA Price ActionUNO Minda Ltd is trading at ₹1,282 as of September 12, 2025, delivering consistent financial and operational outperformance. For FY25, the company posted consolidated revenue of ₹16,775 crore, up 20% year-on-year, with net profit rising 9% to ₹936 crore. EBITDA grew 18% to ₹1,800 crore, and operatin
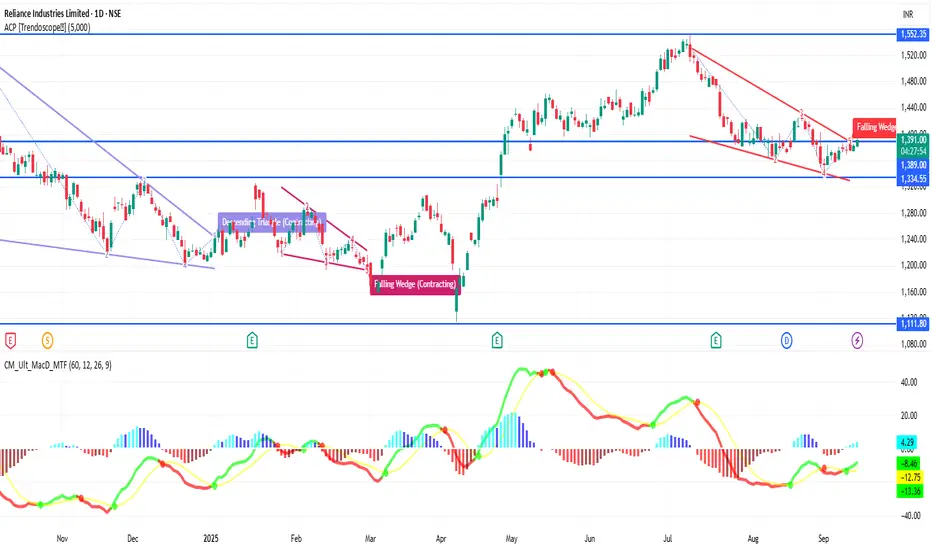
RELIANCE 1D Time frame🔢 Current Level
RELIANCE is trading around ₹1,391 – ₹1,392
🔑 Key Resistance & Support Levels
Resistance Zones:
₹1,392 – ₹1,396 (near-term resistance; breakout above this may lead to further upside)
₹1,400 (psychological resistance)
₹1,427 (stronger resistance above)
Support Zones:
₹1,380 – ₹
See all editors' picks ideas
Volume by Time [LuxAlgo]The Volume by Time indicator collects volume data for every point in time over the day and displays the average volume of the specific dataset collected at each respective bar.
The indicator overlays the current volume and the historical average to allow for better comparisons.
🔶 USAGE
Thr

FlowScope [Hapharmonic]FlowScope: Uncover the Market's True Intent 🔬
Ever wished you could look inside the candles and see where the real action is happening? FlowScope is your microscope for the market's flow, designed to give you a powerful edge by revealing the volume distribution that price action alone can't sh

VWAP Price ChannelVWAP Price Channel cuts the crust off of a traditional price channel (Donchian Channel) by anchoring VWAPs at the highs and lows. By doing this, the flat levels, characteristic of traditional Donchian Channels, are no more!
Author's Note: This indicator is formed with no inherent use, and serves

Fibonacci Sequence Circles [BigBeluga]🔵 Overview
The Fibonacci Sequence Circles is a unique and visually intuitive indicator designed for the TradingView platform. It combines the principles of the Fibonacci sequence with geometric circles to help traders identify potential support and resistance levels, as well as price expansio

ATAI Volume Pressure Analyzer V 1.0 — Pure Up/DownATAI Volume Pressure Analyzer V 1.0 — Pure Up/Down
Overview
Volume is a foundational tool for understanding the supply–demand balance. Classic charts show only total volume and don’t tell us what portion came from buying (Up) versus selling (Down). The ATAI Volume Pressure Analyzer fills that g

Market Cap Landscape 3DHello, traders and creators! 👋
Market Cap Landscape 3D. This project is more than just a typical technical analysis tool; it's an exploration into what's possible when code meets artistry on the financial charts. It's a demonstration of how we can transcend flat, two-dimensional lines and step into

ZigzagLiteLibrary "ZigzagLite"
Lighter version of the Zigzag Library. Without indicators and sub-component divisions
method getPrices(pivots)
Gets the array of prices from array of Pivots
Namespace types: Pivot
Parameters:
pivots (Pivot ) : array array of Pivot objects
Returns: array array

ZigzagLibrary "Zigzag"
Zigzag related user defined types. Depends on DrawingTypes library for basic types
method tostring(this, sortKeys, sortOrder, includeKeys)
Converts ZigzagTypes/Pivot object to string representation
Namespace types: Pivot
Parameters:
this (Pivot) : ZigzagTypes/Pivot

Angled Volume Profile [Trendoscope]Volume profile is useful tool to understand the demand and supply zones on horizontal level. But, what if you want to measure the volume levels over trend line? In trending markets, the feature to measure volume over angled levels can be very useful for traders who use these measures. Here is an att

MathEasingFunctionsLibrary "MathEasingFunctions"
A collection of Easing functions.
Easing functions are commonly used for smoothing actions over time, They are used to smooth out the sharp edges
of a function and make it more pleasing to the eye, like for example the motion of a object through time.
Easing function

See all indicators and strategies
Community trends
DEEPAK FERTILIZERTrend Structure:
The stock has been in a primary uptrend (marked with the blue ascending channel).
Recently, it went into a short-term retracement with a downward sloping trendline (white).
Support & Demand Zones:
Strong Bullish Order Block and FVG Discount Zone around the ₹1350 – ₹1400 level, w
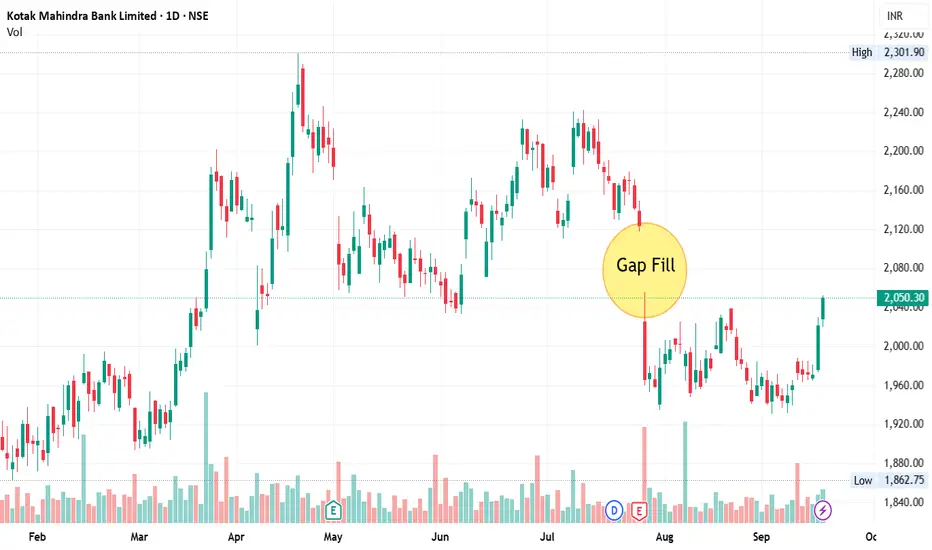
Gap Fill - Kotak Mahindra Bank📊 Script: KOTAKBANK
Key highlights: 💡⚡
📈 Script will fill gap in near future, we may see some good rally.
📈 One can go for Swing Trade.
⏱️ C.M.P 📑💰- 2050
🟢 Target 🎯🏆 - 2176
⚠️ Stoploss ☠️🚫 - 1991
⚠️ Important: Always maintain your Risk & Reward Ratio.
✅Like and follow to never miss a new idea!✅
Accumulation and waiting for breakout #Chalet HotelNSE:CHALET
Earlier price has shown the distribution phase, Now it has accumulated at all time high, can start rally above the levels. Levels are shown on chart

Buy, Sell or Skip? Read Breakouts and VolumesExplore how to judge breakouts using TradingView's bar replay, leveraging 3-month-old charts and price action principles that apply from 5-min to monthly timeframes. Sharpen your technical edge—educational insights only.
Disclaimer: This content is for educational purposes and not financial advice.

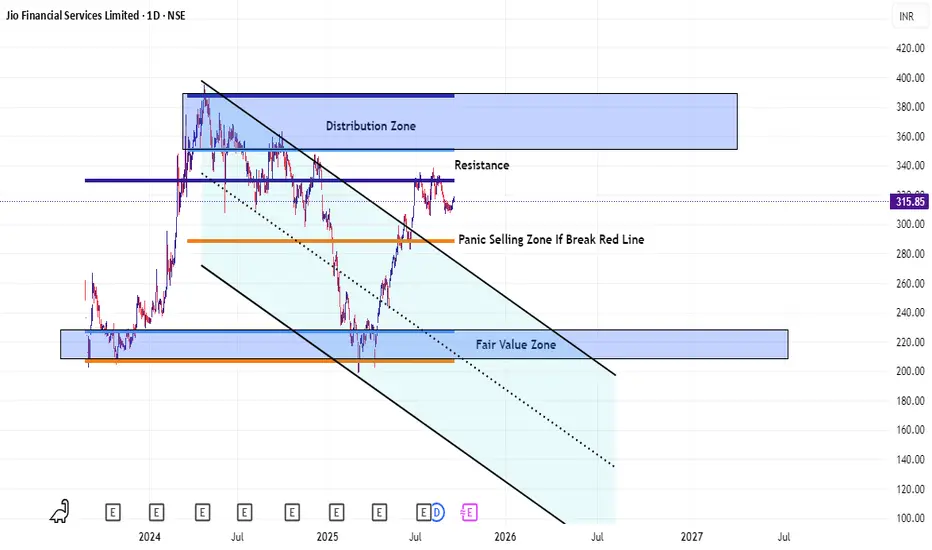
Bearish View On Jio Financial Services
## What is Jio Financial Services
* Part of Reliance Industries. It was demerged in 2023 from RIL’s financial services arm. ( )
* It is registered as an **NBFC-ND-SI** (Non-Deposit Taking, Systemically Important). ( )
* Also got approvals/structure to operate as a **Core Investment Company (CIC)**
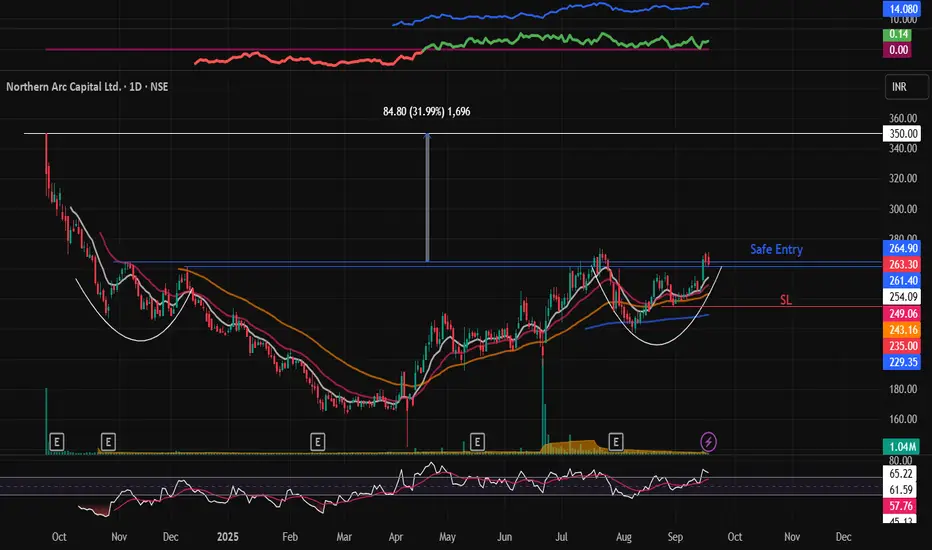
NORTHARC : Swing pick#NORTHARC #patterntrading #chartpattern #inverseheadandshoulder #breakoutstock #swingtrade #trendingstock
NORTHARC :
>> Low PE Stock
>> Chart pattern Trading
>> Inverse Head & Shoulder pattern
>> Volumes Building up
>> Stock showing strength
Swing Traders can lock profit at 10% and keep Trailing
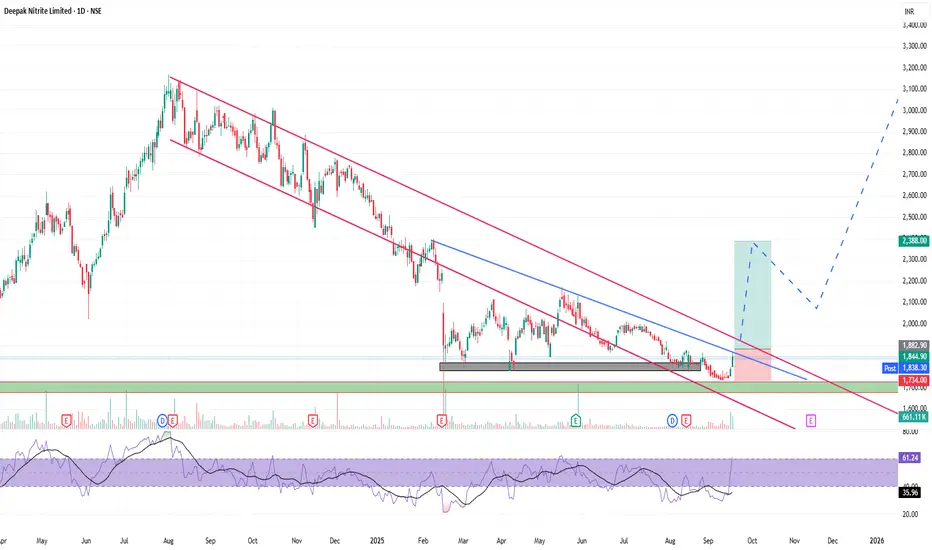
Deepak Nitrite – Breakout Trade Idea🚀Deepak Nitrite – Breakout Trade Idea
Ticker: NSE: DEEPAKNTR
Timeframe: 1D
Bias: Bullish Reversal
📊 Technical Setup
Stock has been in a long-term downtrend but is now forming a base near ₹1730–1760 support zone.
Price has successfully bounced from support and is challenging the downtrend resista
BUY TODAY SELL TOMORROW for 5%DON’T HAVE TIME TO MANAGE YOUR TRADES?
- Take BTST trades at 3:25 pm every day
- Try to exit by taking 4-7% profit of each trade
- SL can also be maintained as closing below the low of the breakout candle
Now, why do I prefer BTST over swing trades? The primary reason is that I have observed that

HFCL BY KRS CHARTS17th September 2025 / 9:21 AM
Why HFCL?
1. First of all, its second time it's in my radar, previously we had more than 40% Return on this one and still long-term Target has been still loading 225 Rs.
2. 1M TF is making Higher High with current price level previously it breaks from flag
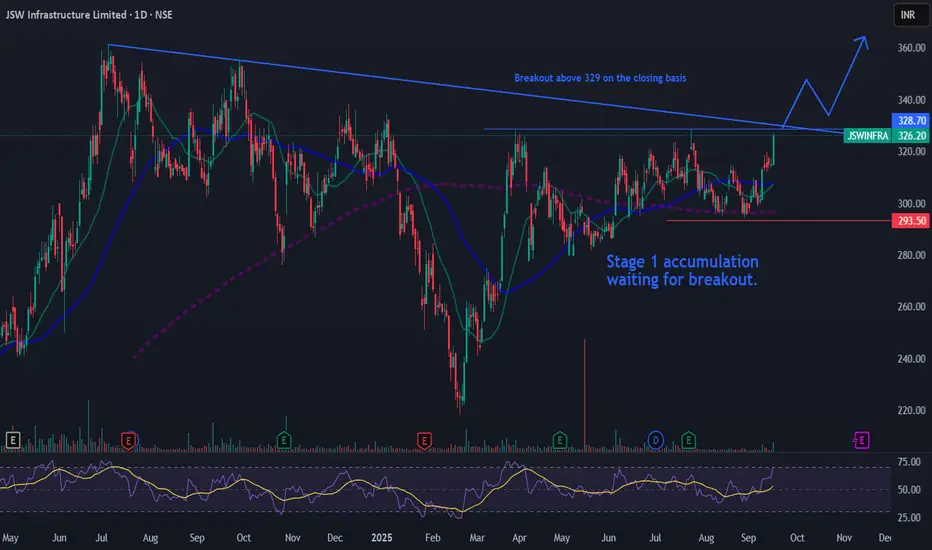
Jswinfra waiting for stage 1 breakoutJswinfra waiting for stage 1 breakout
Entry 329-340
SL 293
Only for journaling, not for a trading/investing.
This post is for my personal use.
Note : only for learning, not a trading recommendation. i am posting as a trading journal before and after breakout.
See all stocks ideas
No scheduled reports
Community trends
ETH/USDT Buy Setup – Rounding Bottom RetestEthereum is setting up a high-probability long entry after completing a 4H rounding bottom pattern with a clean retest. This structure often signals exhaustion of sellers and the start of a sustained bullish leg.
Trade Idea
Buy Entry: 4510
Stop Loss: 4400
Target: 1:1.5 RR (approx. 4810)
Why This Set

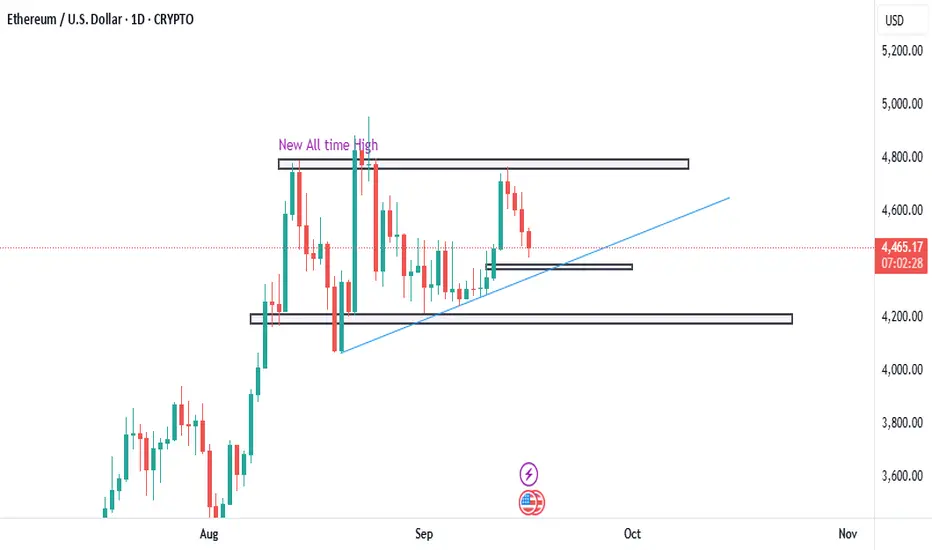
Consolidation and Potential BreakoutResistance: resistance zone is located between $4,700 and $4,800, it is all time high level there are some profit booking whic led to a short reversal,
Support:The primary support is the rising trendline, which has been guiding the price upwards since early September.
There's also a strong horizont
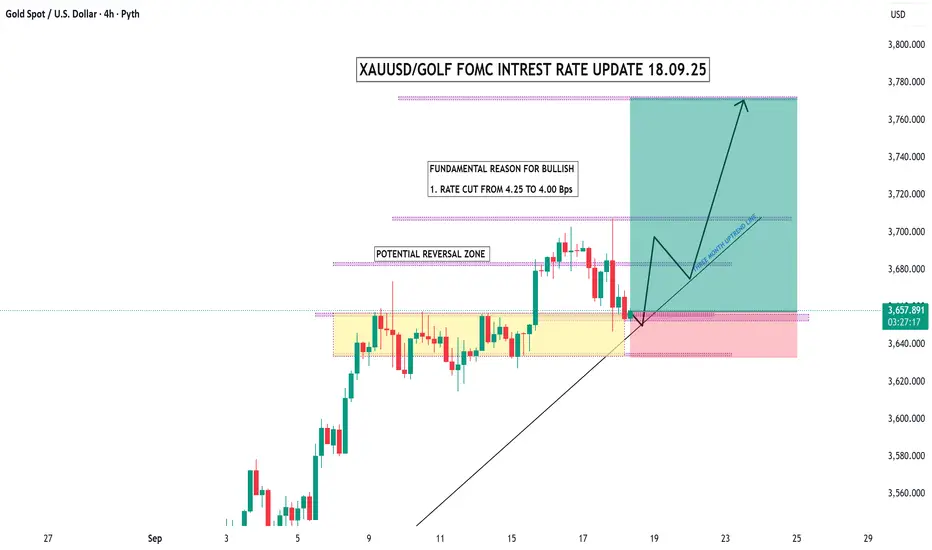
XAUUSD / Gold FOMC Interest Rate Update – 18.09.25Fundamental Reason for Bullish:
The Federal Reserve cut rates from 4.25% → 4.00%.
This supports gold’s bullish momentum since lower rates reduce the opportunity cost of holding gold.
Technical Structure:
Potential Reversal Zone: Highlighted in yellow. Price is currently testing this area around
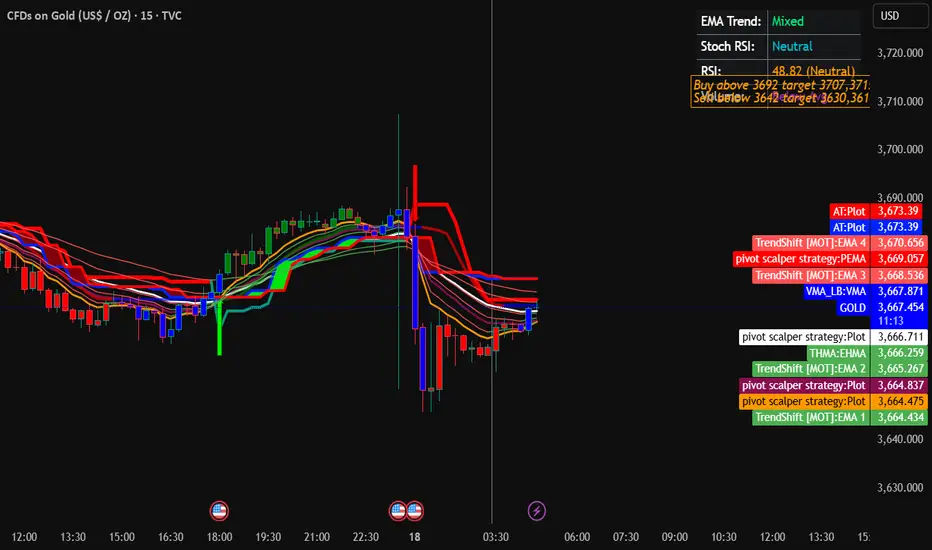
XAUUSD GOLD ANALYSIS ON (17/09/2025)#XAUUSD UPDATEDE
Current price - 3673
If price stay above 3660 then next target 3690,3710 and 3730 and below that 3635
Plan;If price break 3673-3667 area,and stay above 3675,we will place buy order in gold with target of 3690,3710 and 3730 & stop loss should be placed at 3660

ETHUSD SHOWING A GOOD UP MOVE WITH 1:8 RISK REWARD ETHUSD SHOWING A GOOD
UP MOVE WITH 1:8 RISK REWARD
DUE TO THESE REASON
A. its following a rectangle pattern that stocked the market
which preventing the market to move any one direction now it trying to break the strong resistant lable
B. after the break of this rectangle it will boost the market

CRYPTO ALERT: SOLANA SHORT TERM BEARISH TREND IN 4H CHARTSOLANA, one of the most traded crypto after BTC and ETH is in a short term bearish trend on the 4H chart. It has multiple demand zones and unmitigated order blocks pending for execution before any further upward movement.
SOLUSD can be shorted at CMP 236 with Stop Loss at 244 for short term targets

BTC Price Action: Bulls vs BearsBTC Price Action: Bulls vs Bears
Bitcoin has shown a gradual recovery after a prolonged corrective phase, with market structure leaning toward a constructive buildup. Fundamentally, sentiment is influenced by global macro conditions—investors are watching U.S. monetary policy signals, while stable d

Btc long setupEntry Zone
🔵 $114,800 – $115,500
Stop-Loss
🔴 $113,800
Targets
🎯 TP1: $117,700
🎯 TP2: $118,700 – $119,000
Confluence:
Liquidity sweep ✅
Demand OB ✅
Discount entry
Imbalance fill ✅
Setup is asymmetric: Risk ~1% for potential 3–4% reward in 3–7 days.

$BTC short planAs for now CRYPTOCAP:BTC is trading near 116K$, market sentiments are very bullish, so i think if even after tomorrow rates cuts if we get 120K$ that will be a good area to short the market keeping stoploss above the previous highs and targetting lower.

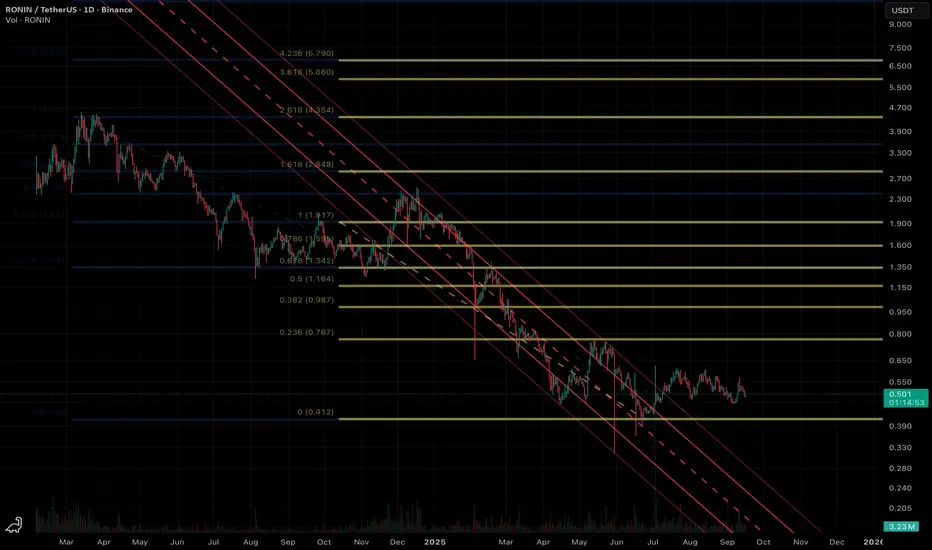
Watching ronin networkAs gaming ecosystem narratives potentially boom, ASX:RON has potentially for multiple x’s as we go into Q4
See all crypto ideas
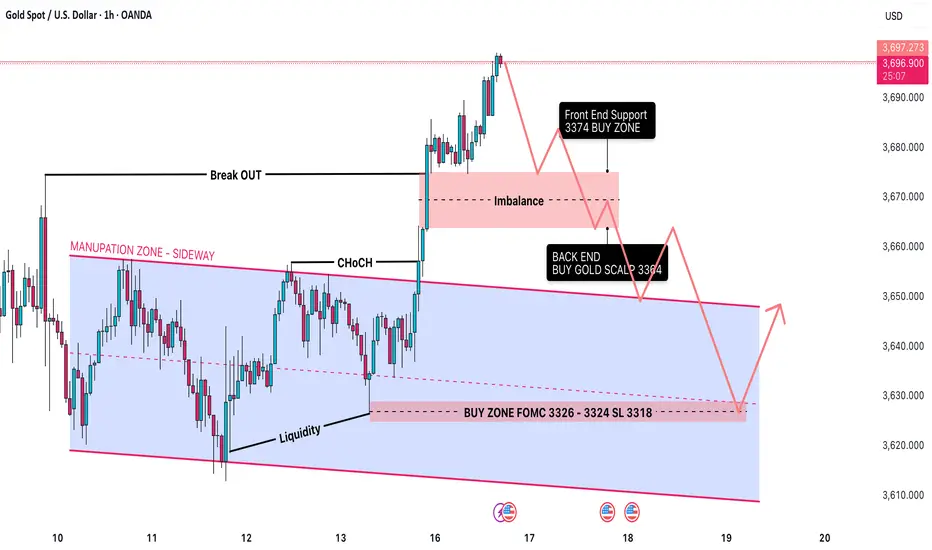
FOMC XAUUSD: Time to Hold Super SELL before FOMC🟡 XAUUSD Daily Trading Plan – Ahead of FOMC
📊 Market Context
Gold (XAUUSD) has recently moved out of its accumulation/manipulation zone and is now trading in the 3,684–3,690 range.
The market structure is bullish after a Change of Character (CHoCH) followed by a Break of Structure (BOS).
Still,
Gold Trading Strategy for 18th September 2025📊 Gold (XAU/USD) Trading Strategy
🔔 This is a structured intraday setup for Gold. Follow carefully with strict risk management.
✨ Buy Setup (Bullish Scenario)
🔼 Condition to Enter Long:
Wait for a 1-Hour Candle Close above $3692.
Entry is valid only if the candle closes above this level, not just a
Nifty 50 Breakout and RSI Momentum Analysis – Sept 2025This TradingView chart presents a technical analysis of Nifty 50, highlighting a recent breakout from a descending trendline with harmonic ABCD pattern and advanced RSI insights. Key support and resistance levels are marked, and RSI momentum shows a clear structural shift as of September 17, 2025. T

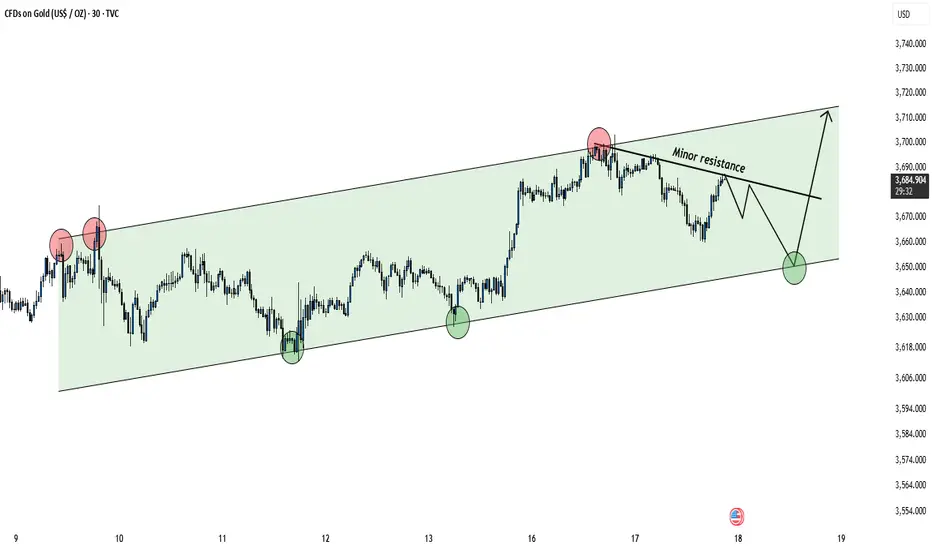
Gold Trading Inside Channel – Key Support & Resistance Levels!Hello Traders!
Gold is currently moving inside a well-defined ascending channel on the 30-min chart. Both buyers and sellers are respecting the levels of this channel, giving us clear trading opportunities.
Key Observations
Price has tested the upper channel resistance multiple times, facing
FED countdown | Buy at support, Sell at resistanceXAU/USD – 17/09 | Captain Vincent ⚓
🔎 Captain’s Log – News Context
18/09, 01:00 (US time): FED rate decision + Dot Plot → policy outlook for upcoming meetings
01:30: Powell’s speech – the key market focus
Market consensus: FED almost certain to cut -25bps. However, the -50bps scenario still ex

Gold technical analysis Gold has been up n up side many reason for upside rally U.S economy, Trump tariffs , Ukraine Russia war . But again I see upside gold $3695 major resistance and support both. And then fly up to 3732. And new design represents “ lights of diva “. 🔥

LiamTrading – XAUUSD Strategy for TodayI would like to share my personal view on gold for the day.
The overall trend in XAUUSD continues to be very strong, with the price consistently making fresh highs over the past two weeks. Buying interest has remained steady across sessions, while any corrections have been short-lived, mostly visib

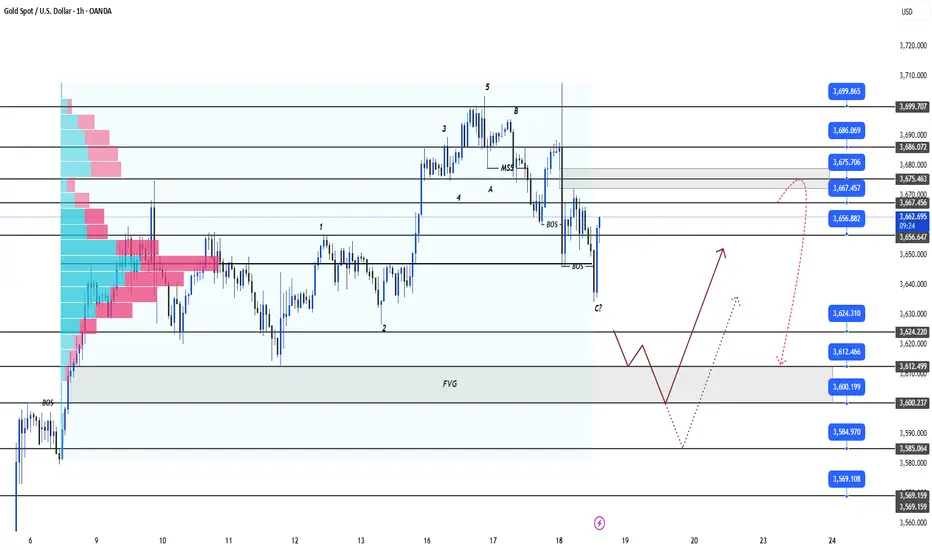
XAUUSD H1 – Pennant + Head & ShouldersXAUUSD H1 – Pennant + Head & Shoulders: Two Key Levels 3657 / 3627
Hello Traders,
Gold opened the week with a bounce of over 20 points from the rising trendline and is now consolidating within a Pennant, which aligns with a small Head & Shoulders structure on the H1 chart. At the moment, the marke

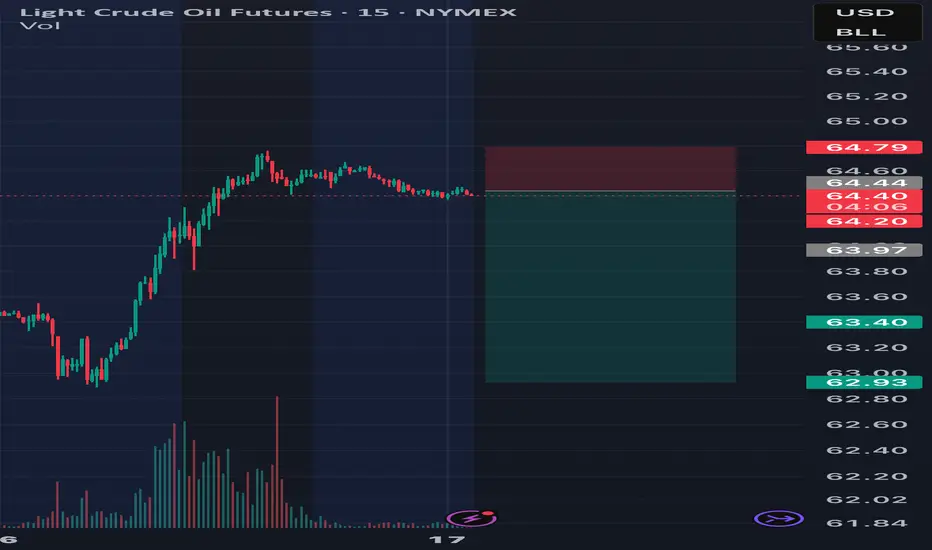
17 sep - CL ShortCrude seems in likely level to bounce back. Crude seems in likely level to bounce Crude seems in likely level to bounce Crude seems in likely level to bounce Crude seems in likely level to bounce back. Crude seems in likely level to bounce Crude seems in likely level to bounce Crude seems in likely
Gold's U-Turn: A Dive into Fundamentals & Trading StrategyHello, fellow traders! The gold market's moves last night were absolutely wild, not at all what one would expect. After hitting a new all-time high of $3,707.40/oz, gold surprisingly took a U-turn and dropped to $3,681.39/oz. And this happened right after the Fed cut rates by 0.25% as predicted! So,
See all futures ideas
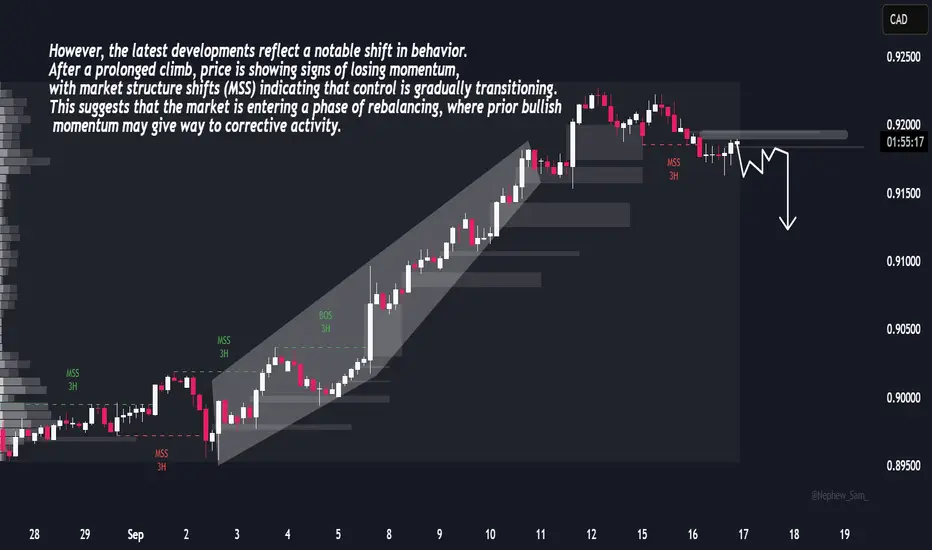
AUDCAD Price Forecast – Structural Shift in MomentumAUD/CAD has recently completed a strong trending phase, characterized by a well-defined upward channel with consistent expansions. The sequence of price action showed clear momentum as each retracement was absorbed and followed by renewed buying interest, maintaining structural order throughout the
GBPUSD MULTI TIME FRAME ANALYSISHello traders , here is the full multi time frame analysis for this pair, let me know in the comment section below if you have any questions , the entry will be taken only if all rules of the strategies will be satisfied. wait for more price action to develop before taking any position. I suggest yo

EURO/USDDealing Range & Discount Zone: Price is in the lower half of the recent range, where buyers may step in.
FVG (Fair Value Gap): Market may retrace to fill imbalance before moving higher.
Bullish Order Block: Strong demand area below, likely to support price if tested.
Trendline: Price is compressi

GBPCHF BEARISH MOMENT WILL TURN ON AFTER RETRACEMENT.ICMARKETS:GBPCHF
The Swiss Frank is capping due to bullish moment of a fundamental asset, Gold.
We believe that the Swiss frank will not frank against Loonie, after hitting resistance risistance area.
From their we will move look at a nice bearish signal on candlestick pattern to enter into sel

Short Idea (EUR/USD)Entry: Around 1.1848 (current price level)
Stop Loss (SL): 1.1859 (above recent swing high)
Target 1: 1.1834 (support area shown on your chart)
Target 2: 1.1825 (if momentum continues downward)
Reasoning:
Price is failing to break above resistance at 1.1850-1.1860.
Recent candles show rejectio

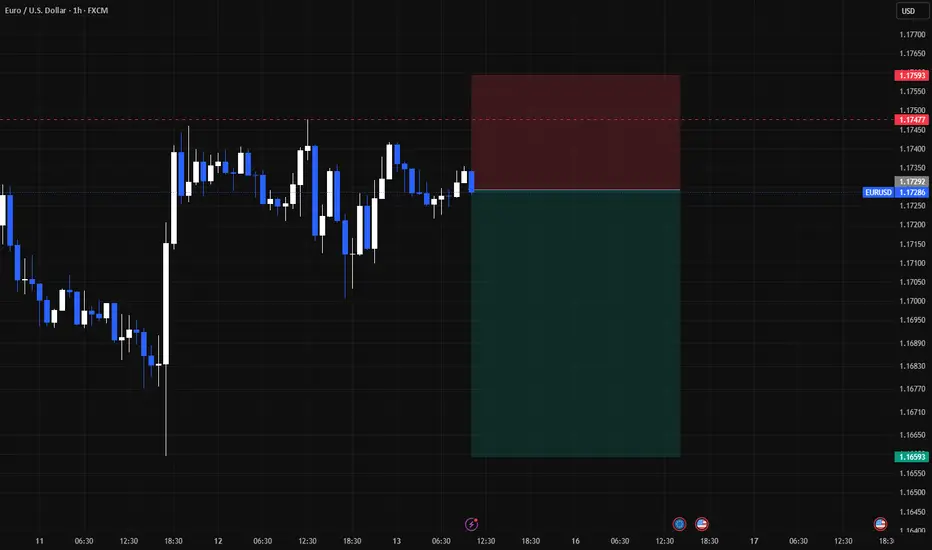
EURUSD Short PossibilitesEURO looks bearish during NY Open targeting the H1 fvg for a quick reversal

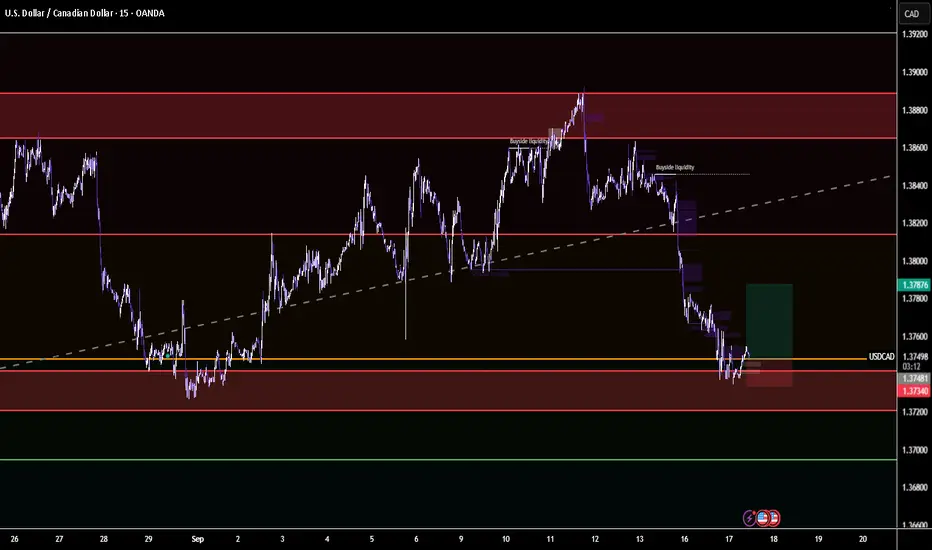
USDCAD Scalping the 1.3740-1.3720 Decision Zone USDCAD at make-or-break support (1.3740–1.3720).
📈 Bullish Plan:
Entry: 1.3745 | SL: 1.3725 | TP1: 1.3770 | TP2: 1.3810 🚀
📉 Bearish Plan:
Entry: <1.3720 | SL: 1.3740 | TP1: 1.3700 | TP2: 1.3680 ⚡
👉 Watch this zone — bounce = long, break = short.
USDCAD is sitting at a critical 1.3740–1.3720 supp
GBPCHFPrice is in a downtrend. It came into 4H supply. Made 15min flip and now waiting for limit to get triggered.

GBPJPY sell positionprice seems to fail pushing higher and now facing resistance at this level. perhaps we shall see a down move from here

See all forex ideas
| - | - | - | - | - | - | - | - | ||
| - | - | - | - | - | - | - | - | ||
| - | - | - | - | - | - | - | - | ||
| - | - | - | - | - | - | - | - | ||
| - | - | - | - | - | - | - | - | ||
| - | - | - | - | - | - | - | - | ||
| - | - | - | - | - | - | - | - | ||
| - | - | - | - | - | - | - | - | ||
| - | - | - | - | - | - | - | - |
Trade directly on the supercharts through our supported, fully-verified and user-reviewed brokers.


