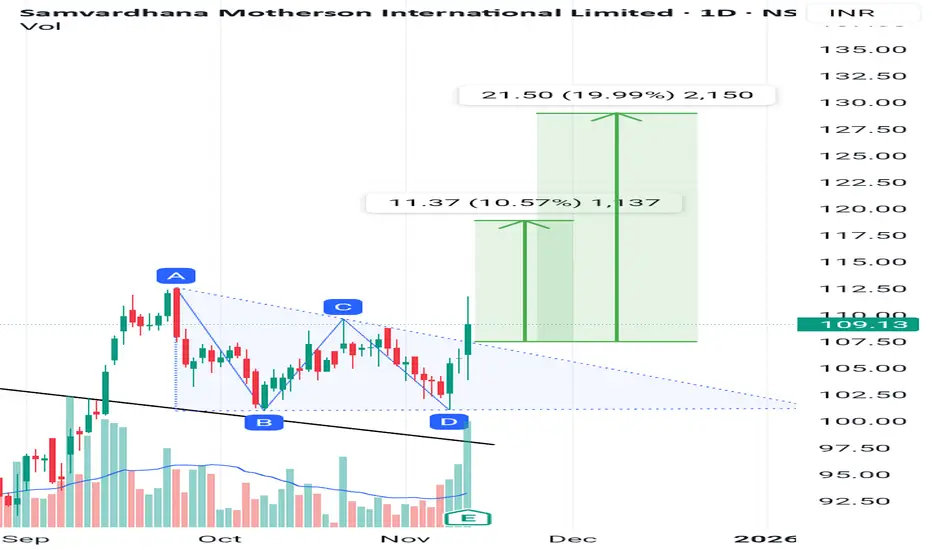
Samvardhana Motherson just made a triangle breakout.will it sustJust broke out of triangle pattern with good volume spike. Volumes are 3 times the average.
It brokeout of treandline on 12 September and gave a move of 10% before entring into consolidation of triangle pattern.
It just broke out of the pattern giving bullish signal.
Indicators
RSI is >60 which is

The best trades require research, then commitment.
Get started for free$0 forever, no credit card needed

Scott "Kidd" PoteetThe unlikely astronaut

Where the world does markets
Join 100 million traders and investors taking the future into their own hands.
Asian Paints Turns Colorful Again!Hello Mates! Here’s a chart that really caught my attention this week Asian Paints showing strength after a long phase of quiet sideways movement. The structure is clean, the breakout is sharp, and the message from price action is clear momentum is shifting again.
After spending almost two years in

BANK NIFTY - Technical Analysis Bank Nifty is showing an interesting setup on the weekly chart.
After breaking out above its previous all-time high, the index has started contracting in a tight range, indicating healthy consolidation.
On the daily timeframe, it continues to take support near the 9 EMA, and during minor dips, it

DALMIA BHARATHello & welcome to this analysis
Technical Outlook:
In the monthly time frame its completing the formation of a Cup & Handle breakout suggesting upside levels for medium term 2800 - 3500, for long term 3800 - 5000
Accumulation can be done in the range of 1900 (on downside) 2300 (on the upside).
T

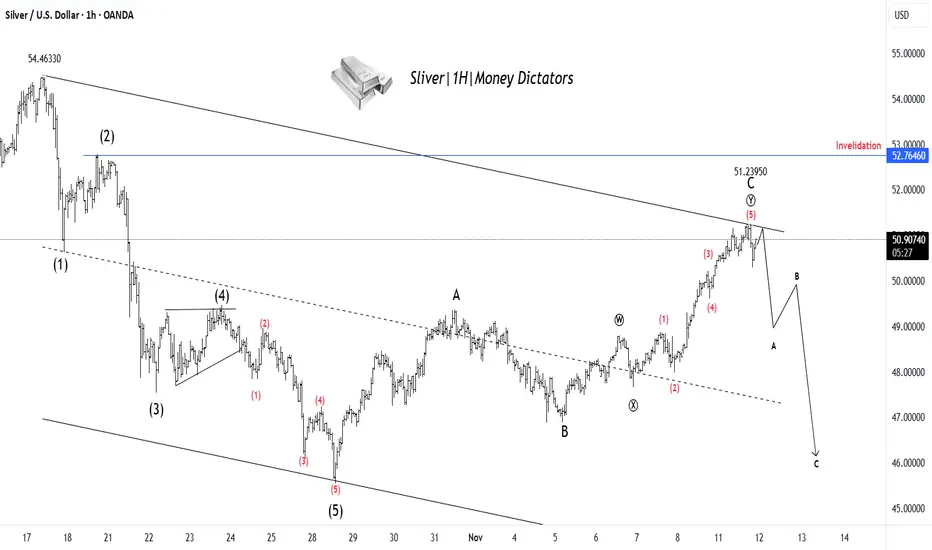
XAG/USD Set for Decline After Finishing Wave YSilver has completed a clear 5-wave upward move, ending near the 51.23 zone, which likely marks the completion of Wave C of the corrective structure. Price action shows rejection from the upper trendline, signaling that buying momentum is fading. This suggests the start of a new A–B–C corrective dec
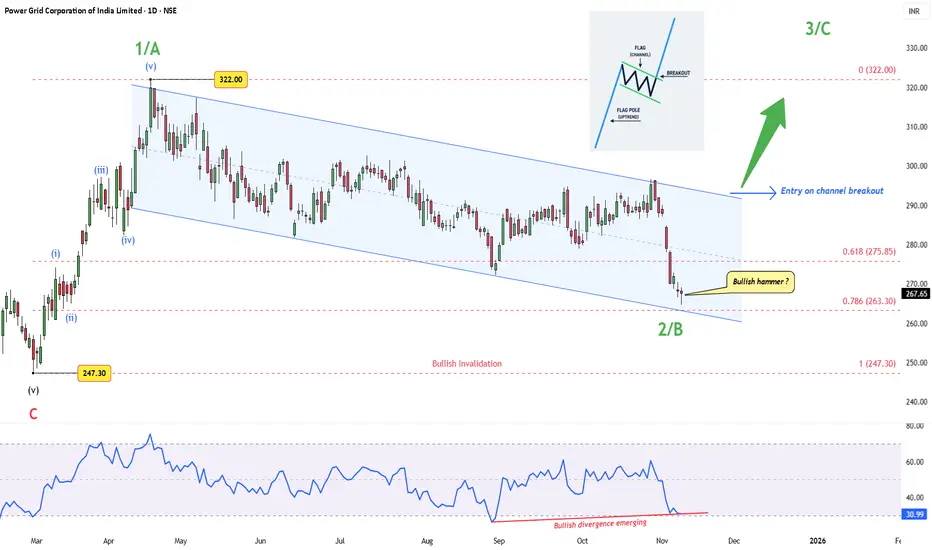
Power Grid – A Flag Within a WaveAfter completing a clean five-wave rally from ₹247.30 to ₹322, Power Grid has spent months in a controlled drift lower — a textbook corrective channel, likely forming Wave 2/B of the next major leg.
Price now sits near the 0.786 retracement (₹263 zone), showing early signs of exhaustion. A “ Bullis
Breakout retesting apollo HospitalBest ever result
ATH breakout & re-testing
Price should start new rally.
Price should not break the strong support of 7500
This is only for educational purpose no any trade recommendation

SAIL : LongTrend: The stock is forming a cup and handle pattern, which is a bullish continuation setup. It has broken out above the neckline around 140 levels, showing strength. The trend has turned positive after a long consolidation phase.
Volume: There is a clear increase in volume during the breakout, whi

Bajaj Finserv: Resistance Breaks, Q2 Results Await🔍 Technical Analysis
Bajaj Finserv Limited has delivered an impressive super bullish rally since 2010, establishing itself as a blue-chip financial services stock. Multiple times since 2021, the stock faced resistance at the ₹2,000 level, which acted as a psychological and technical barrier.
Howe

Crompton | A Reversal Imminent?DISCLAIMER: This idea is NOT a trade recommendation but only my observation. Please take your trades based on your own analysis.
Points to note:
-----------------
1. RSI shows a bullish divergence with price.
2. The rejection of selling comes inside a Weekly Demand zone.
3. The high volume inside

See all editors' picks ideas
PriceFormatLibrary for automatically converting price values to formatted strings
matching the same format that TradingView uses to display open/high/low/close prices on the chart.
█ OVERVIEW
This library is intended for Pine Coders who are authors of scripts that display numbers onto a user's charts. T

LogNormalLibrary "LogNormal"
A collection of functions used to model skewed distributions as log-normal.
Prices are commonly modeled using log-normal distributions (ie. Black-Scholes) because they exhibit multiplicative changes with long tails; skewed exponential growth and high variance. This approach i

Range Oscillator (Zeiierman)█ Overview
Range Oscillator (Zeiierman) is a dynamic market oscillator designed to visualize how far the price is trading relative to its equilibrium range. Instead of relying on traditional overbought/oversold thresholds, it uses adaptive range detection and heatmap coloring to reveal where pri

Volume Surprise [LuxAlgo]The Volume Surprise tool displays the trading volume alongside the expected volume at that time, allowing users to spot unexpected trading activity on the chart easily.
The tool includes an extrapolation of the estimated volume for future periods, allowing forecasting future trading activity.
🔶 U

Smooth Theil-SenI wanted to build a Theil-Sen estimator that could run on more than one bar and produce smoother output than the standard implementation. Theil-Sen regression is a non-parametric method that calculates the median slope between all pairs of points in your dataset, which makes it extremely robust to o

Fair Value Gaps by DGTFair Value Gaps
A refined, multi-timeframe Fair Value Gap (FVG) detection tool that brings institutional imbalance zones to life directly on your chart.
Designed for precision, it visualizes how price delivers into inefficiencies across chart, higher, and lower (intrabar) timeframes — offering a fl

TASC 2025.11 The Points and Line Chart█ OVERVIEW
This script implements the Points and Line Chart described by Mohamed Ashraf Mahfouz and Mohamed Meregy in the November 2025 edition of the TASC Traders' Tips , "Efficient Display of Irregular Time Series”. This novel chart type interprets regular time series chart data to create an ir

Simplified Percentile ClusteringSimplified Percentile Clustering (SPC) is a clustering system for trend regime analysis.
Instead of relying on heavy iterative algorithms such as k-means, SPC takes a deterministic approach: it uses percentiles and running averages to form cluster centers directly from the data, producing smoo

Adaptive Volume Delta Map---
📊 Adaptive Volume Delta Map (AVDM)
What is Adaptive Volume Delta Map (AVDM)?
The Adaptive Volume Delta Map (AVDM) is a smart, multi-timeframe indicator that visualizes buy and sell volume imbalances directly on the chart.
It adapts automatically to the best available data resolution

Dynamic Equity Allocation Model"Cash is Trash"? Not Always. Here's Why Science Beats Guesswork.
Every retail trader knows the frustration: you draw support and resistance lines, you spot patterns, you follow market gurus on social media—and still, when the next bear market hits, your portfolio bleeds red. Meanwhile, institution

See all indicators and strategies
Community trends
Asian Paints Turns Colorful Again!Hello Mates! Here’s a chart that really caught my attention this week Asian Paints showing strength after a long phase of quiet sideways movement. The structure is clean, the breakout is sharp, and the message from price action is clear momentum is shifting again.
After spending almost two years in
Samvardhana Motherson just made a triangle breakout.will it sustJust broke out of triangle pattern with good volume spike. Volumes are 3 times the average.
It brokeout of treandline on 12 September and gave a move of 10% before entring into consolidation of triangle pattern.
It just broke out of the pattern giving bullish signal.
Indicators
RSI is >60 which is
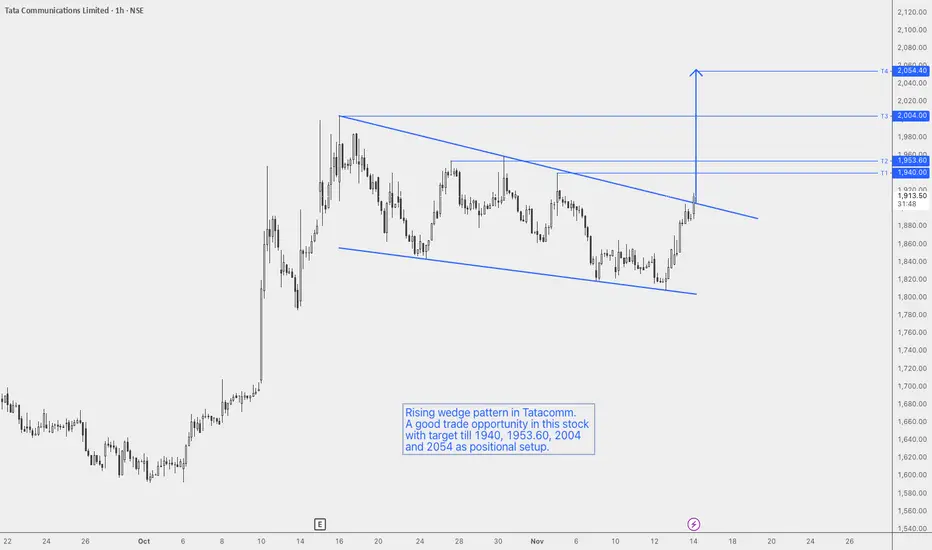
Rising Wedge in TatacommunicationsRising wedge pattern in Tatacomm.
A good trade opportunity in this stock with a target till 1940, 1953.60, 2004 and 2054 as a positional setup.
The pattern will be invalidated if the price reenters the wedge.
Validation for entry on breakout and test of wedge as support.
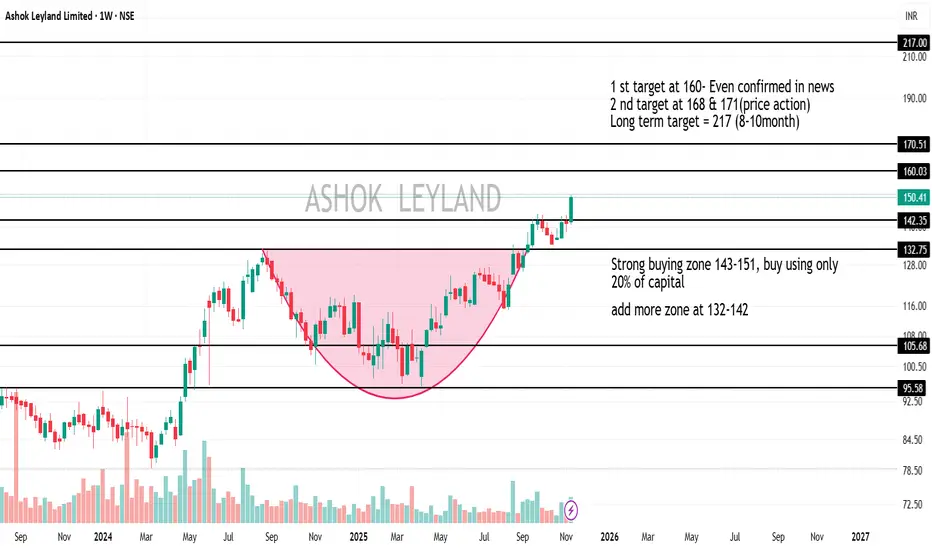
Targets for ASHOKLEY.NS Based on price action & chart patternThe analysis is completely on price action & support/resistance levels along with volume validation of the recent weeks of the pattern breakout. I am sharing this only for the purpose of learning & this isn't a buy/sell recommendation; consult your financial advisor before taking any trade decision.
UTI AMC TECHNICAL ANALYSISUTI AMC TECHNICAL ANALYSIS
- Took monthly high
- Showing divergence
- there was no Fvg in monthly
- do might go to test swing , that might be the good level to pull back.
For education purpose only

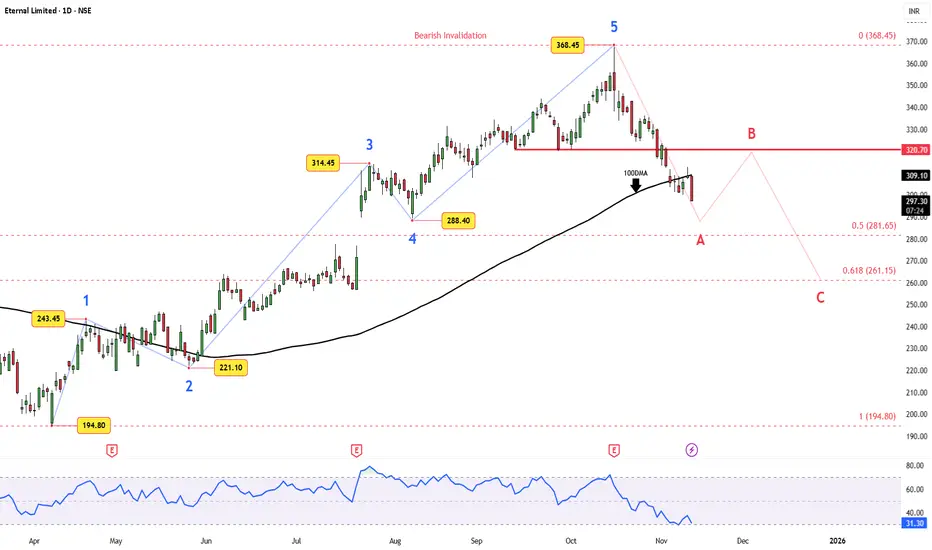
Eternal (Zomato) – 5-Wave Rally Meets a Reality CheckEternal (Zomato) appears to have completed a clean 5-wave impulse from ₹194 → ₹368.45 and is now shifting into a corrective phase.
Technical Setup:
Wave A is unfolding with price slipping below the 100DMA. A temporary Wave B rebound toward ₹320–₹325 could precede another decline toward ₹281–₹261
$ADANIPORTS: Long on 6-Month VCP Breakout (Volatility Play)This is a live swing trade I am taking in $ADANIPORTS. The setup is a 6-month VCP (Volatility Contraction Pattern) that has just broken out.
This post is for my journal, detailing the full mechanical framework for the trade, which includes a specific plan to manage event-driven volatility.
1. Indi

NESTLE INDIAA small, long trade setup by buying on 20 SMA support + UP trend strategy in equity segment lts see what will happen

BUY TODAY SELL TOMORROW for 5%DON’T HAVE TIME TO MANAGE YOUR TRADES?
- Take BTST trades at 3:25 pm every day
- Try to exit by taking 4-7% profit of each trade
- SL can also be maintained as closing below the low of the breakout candle
Now, why do I prefer BTST over swing trades? The primary reason is that I have observed that

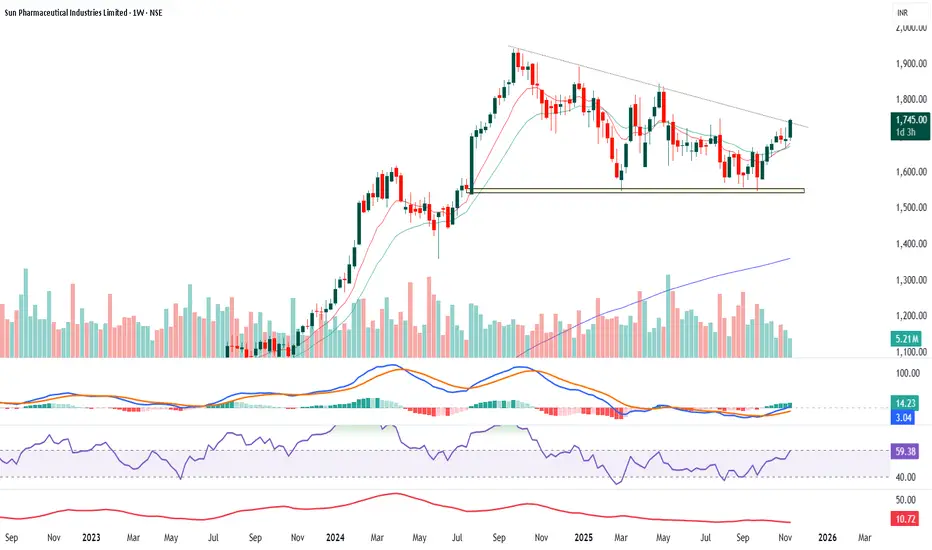
SUNPHARMA - Weekly- LONGA simple and clear analysis of the Sun Pharma weekly chart based on trend, volumes, momentum, RSI, ADX, and chart structure:
Trend: The stock has been in a broad consolidation for many months. It was making lower highs, forming a downward sloping trendline. Now the price is trying to break above th
See all stocks ideas
Today
HPLHPL Electric & Power Limited
Actual
—
Estimate
—
Today
I
INDIAGLYCOIndia Glycols Limited
Actual
—
Estimate
—
Today
SHIVALIKShivalik Rasayan Ltd
Actual
—
Estimate
—
Today
BASFBASF India Limited
Actual
—
Estimate
—
Today
EXIDEINDExide Industries Limited
Actual
—
Estimate
3.75
INR
Today
EKCEverest Kanto Cylinder Limited
Actual
—
Estimate
—
Today
AGSTRAAGS Transact Technologies Ltd.
Actual
—
Estimate
—
Today
MAXHEALTHMax Healthcare Institute Ltd
Actual
—
Estimate
4.26
INR
See more events
Community trends
THETA Monthly Chart Just Entered Its Most Dangerous ZoneTHETA Monthly Chart Just Entered Its Most Dangerous Zone
THETA is testing one of the most crucial zones on the entire macro structure. After a long decline from the 2021 high of 15.686, the market is pressing into levels that will determine whether a major reversal or deeper downside unfolds.
*Maj

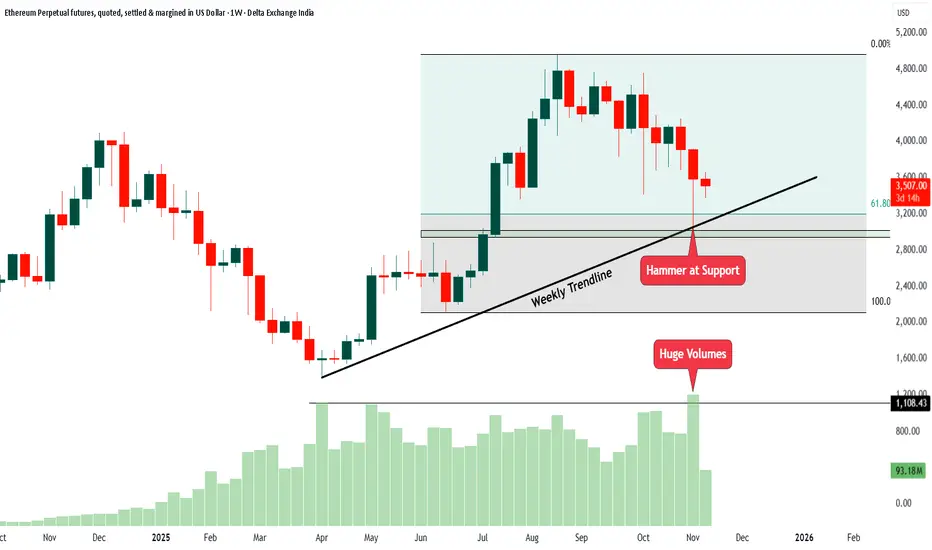
ETH Weekly Chart Analysis1. The price has been respecting a weekly trendline for many months. This trendline acts like a support line where buyers usually come in.
2. Recently, the price fell towards this same trendline and created a hammer candle. A hammer at support often shows that sellers pushed the price down, but buy

“ETH Correction Path: Fall → Trap → Collapse → Rebirth”
🧠 ETH Big Picture Analysis | Multi-Leg Correction Ahead
Current Price: ~$3400
Ethereum appears to be setting up for a deeper corrective structure. From the current levels around $3400, I expect ETH to drop toward $2200, completing the first major leg down.
After that, a strong relief bounce coul

all you need to knowTHE BULL market is coming to an end
i market the key points of the bear market for now
later on i will update it
i said i will say it again for the alt season to happen
we need a BTC Price range my EXPECTATION is betwenn 65k to 80k
where BTC will rest and the alts will take over but if you want my

Bitcoin: A case of confidence and patience | FX ResearchAs we continue to emphasize, any bouts of weakness in the crypto market still look like pullbacks within a broader and constructive medium and longer term uptrend. In our view, any tone of negative sentiment appears misplaced when viewed against price action that continues to reward investors who tr

Polygon Best buy BITSTAMP:POLUSD after long waited made some good consolidation and CHOCH , easy move till 1.3$ possible buy soon before it pumps

BTC live market sell tradeTook Live Btc sell side trade
buy exit?
there is Daily fvg. that might be Btc will turn back

BTC is forming a 3R sell scenario.....BTC is in downtrend in daily timeframe and shown sniper delivery, now it is in pullback mode. We may anticipate a good short term trade around 102000 RDRB level
1. Price is continuously crating BOSs..
2. Sniper deliver is already done and price is pulling back slowly.
3. RSI has already shown bea

Daily Macro, Market Mood Swings, and the Stories Behind the NoisRisk off- Risk on & Repeat:
Thursday delivered a rare market mood swing: only the 10th time in two decades that the Dow has dropped 1% or more the day after a record close.The Dow slid nearly 800 points (-1.7%) to 47,457.22, while the S&P 500 matched the vibe, falling 113.43 points (-1.7%) to 6,73

See all crypto ideas
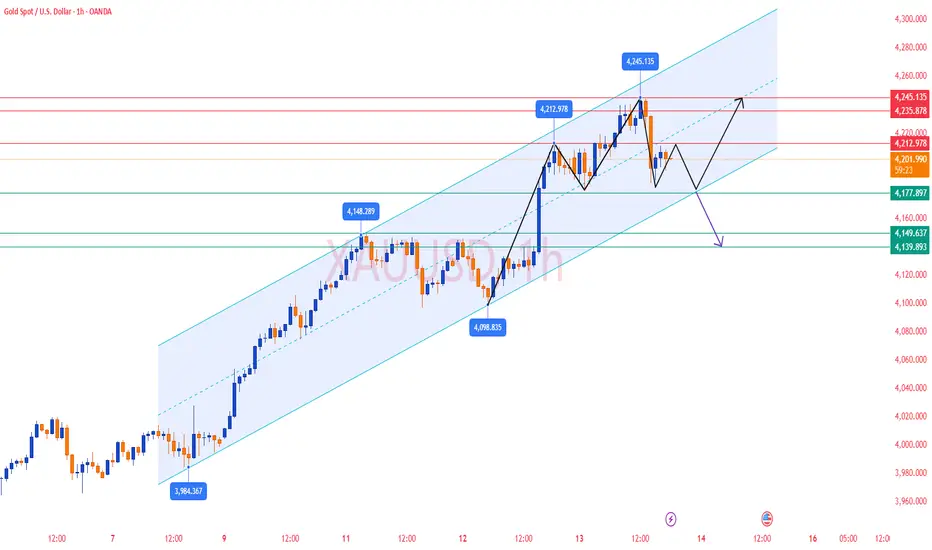
Gold Maintains Bullish Structure Despite 4245 Rejection We have seen a sharp rejection from the 4245 level yesterday, forming a red candle . However,. Gold found solid support at the weekly R3 level around 4147 and managed to close above it, which is a significant technical development. Currently, we're witnessing a strong recovery rally on lower tf that

Gold Analysis and Trading Strategy | November 13–14✅From the 4H chart, gold reached a recent high of 4245.10 before encountering clear resistance and pulling back. The upper Bollinger Band (4234.51) acted as a strong rejection zone, and the price has since retreated toward the 4200 level.
Currently, gold is consolidating between 4190–4210, with sho
XAU Empire | Bullish FlowXAU Empire | Bullish Flow
The market maintains a bullish structure after confirming a break of structure (BOS). Price is currently retracing into a short-term demand zone near 4,100, showing healthy correction within trend. This zone is acting as accumulation before potential continuation.
Momentu

Gold Trading Strategy for 14th November 2025⭐ GOLD Intraday Levels (30-min Candle Strategy)
🟢 BUY Setup
📈 Buy Above: $4,230 (30-min candle close above the high)
🎯 Targets:
$4,240
$4,250
$4,260
🔴 SELL Setup
📉 Sell Below: $4,143 (30-min candle close below the low)
🎯 Targets:
$4,133
$4,123
$4,113
⚠️ Disclaimer
This information is for

Gold Holds Firm Near $4,180 as Markets Await Fed Signal Gold prices are holding steady around $4,184 per ounce, maintaining strong momentum after last week’s sharp rebound of nearly $250 from the $3,930 low. On the 4-hour chart, the uptrend remains intact with multiple Fair Value Gaps acting as key support zones. The nearest support is seen between $4,15

Gold Maintains Uptrend, Watch for Pullback to Buy with Cash Flow🔍 Context & Market Structure
After a strong upward impulse from a low liquidity area, the price has broken the downtrend structure and formed a bullish BoS on H1.
Currently, gold is accumulating above the Support Zone at 4,183 USD after creating a new peak and leaving a FVG just below the

Gold Bulls Eye Major Resistance – Can They Break Through?Gold continues to trade in an upward trend, recovering strongly from recent lows. On the 4-hour chart, price is moving closer to a falling resistance trendline, which has acted as a major barrier in the past. This makes the upcoming resistance zone very important for short-term traders.
The next ke

GOLD RECOVERS STRONGLY – BUYERS RETURN AFTER EARLY MORNING SWEEP2️⃣ MARKET CONTEXT
• Asian session saw gold drop to 4,17x, sweeping liquidity before surging to 4,208.
• Price action indicates buying pressure returning at the OB M30 + FVG, showing a strong reaction.
• USD Index and yields are flat → market awaits Producer Price Index (PPI) news.
🎯 Today's Direc

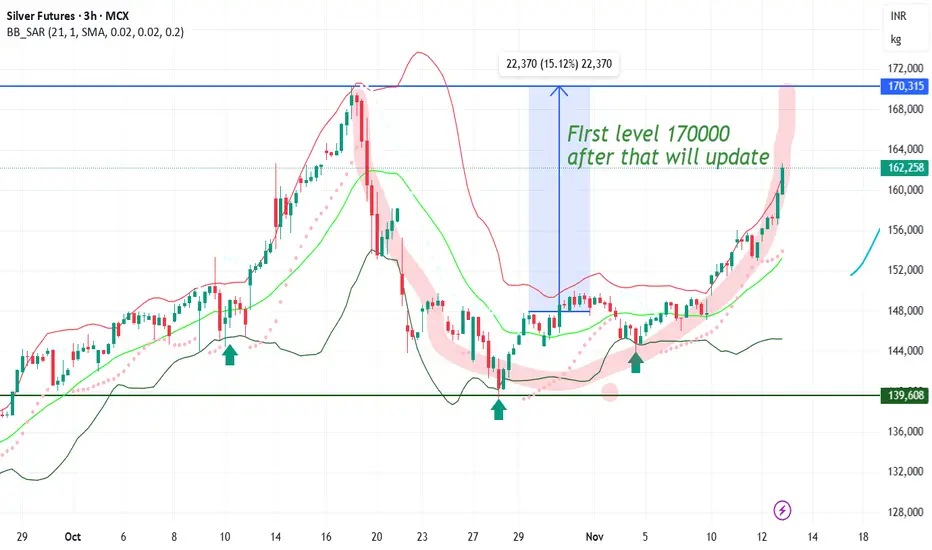
#SILVER FORMING NICE PATTERN #SILVER FORMING NICE PATTERN going to touch 170000 soon
formation like CUP and waiting for handle
after that 15% from high
Xauusd is top out today 4200 to 4230 is a selling zone tar 3750This is a xau usd cycle top out today
Next tar 3750

See all futures ideas
USDJPY MULTI TIMEFRAME ANALYSIS Hello traders , here is the full multi time frame analysis for this pair, let me know in the comment section below if you have any questions , the entry will be taken only if all rules of the strategies will be satisfied. wait for more price action to develop before taking any position. I suggest yo

USDJPY Vulnerable to Deep Pullback After Wave 5USDJPY has completed a full 5-wave rising structure inside a clear wedge pattern, which usually signals exhaustion. The final Wave (5) shows weakening momentum, and price is beginning to slip below the wedge support — an early sign that the trend may be reversing. This suggests the pair is likely en

AUDCAD_Short Elliot Wave I anticipate AUDCAD to form an ABC pattern targeting 0.9060, with a strict stop-loss at 0.9216. The risk-to-reward ratio is 1:4. Please conduct your own research before executing any trade.

EUR/USD – Growth Opportunity After Positive DataThe EUR/USD pair is currently trading around 1.1612, up by 0.2% ahead of the September industrial production data from the Eurozone. This data is expected to show a 0.7% recovery for the month, following a sharp 1.2% decline the previous month. This is a positive signal for the Euro and could

TRADE JOURNAL GBPUSD LONG 13/11/2025Wassup Lads!!
As discussed earlier we were looking to go long after either eurusd or gbpusd tapped into the daily FVG, so yesterday gbpusd tapped into the daily FVG turtle souping the lows, confirmed long by the strong rejection and formation of a bullish orderflow. I had set an alert on the orderbl

EUR/USD Target CompletedTarget Completed EUR/USD Market. 100% Success Fundamentals Analysis.
(Sudarshana N Adhikari)

Self- similarity Trade -GBP/NZDSelf-similarity is a property where a part of an object is similar to the whole object, meaning it contains smaller copies of itself at different scales. This can occur exactly, as in mathematical fractals, or statistically, as seen in many natural phenomena. Examples of self-similarity are found in

EURUSD – Bullish Setup Toward 1.16EURUSD – Bullish Setup Toward 1.17
EURUSD is showing strong signs of a bullish reversal after an extended period of downside movement. The 3H chart highlights several Market Structure Shifts (MSS) and Breaks of Structure (BOS) suggesting that bearish momentum is fading and buyers are regaining cont

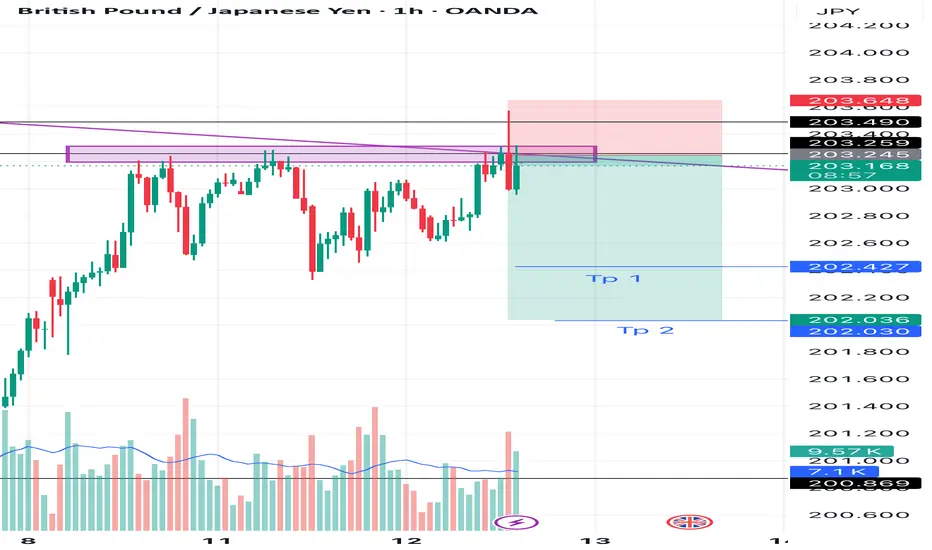
GBPJPY SHORT 1H TIME FRAME I am sitting in short of GBPJPY on 1H Time frame
Logic :- i can clearly see a good rejection with huge volumes from resistance and buyers are trapped, Sellers are gaining control so i am going for 1:2/3.
Let’s see one can take with proper SL gand targets given ✅
Trust the process 🚀, A lot more to
NZD CAD ShortThis idea is for educational purpose only , this is not a recommendation of buy or sell ,

See all forex ideas
| - | - | - | - | - | - | - | - | ||
| - | - | - | - | - | - | - | - | ||
| - | - | - | - | - | - | - | - | ||
| - | - | - | - | - | - | - | - | ||
| - | - | - | - | - | - | - | - | ||
| - | - | - | - | - | - | - | - | ||
| - | - | - | - | - | - | - | - | ||
| - | - | - | - | - | - | - | - | ||
| - | - | - | - | - | - | - | - |
Trade directly on the supercharts through our supported, fully-verified and user-reviewed brokers.


