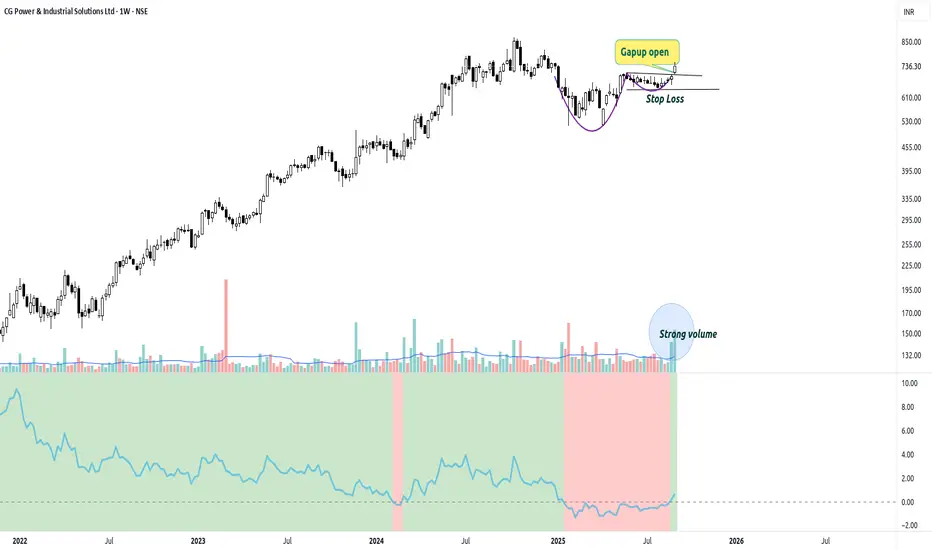
G Power – Weekly Breakout with Gap-Up and Strong VolumeTechnical View:
Stock has given a decisive breakout on the weekly chart, accompanied by a gap-up opening, which adds conviction.
Volume spike indicates strong institutional demand backing the move.
Relative strength vs Nifty has turned positive, showing clear outperformance compared to the br

The best trades require research, then commitment.
Get started for free$0 forever, no credit card needed

Scott "Kidd" PoteetThe unlikely astronaut

Where the world does markets
Join 100 million traders and investors taking the future into their own hands.
Major indices
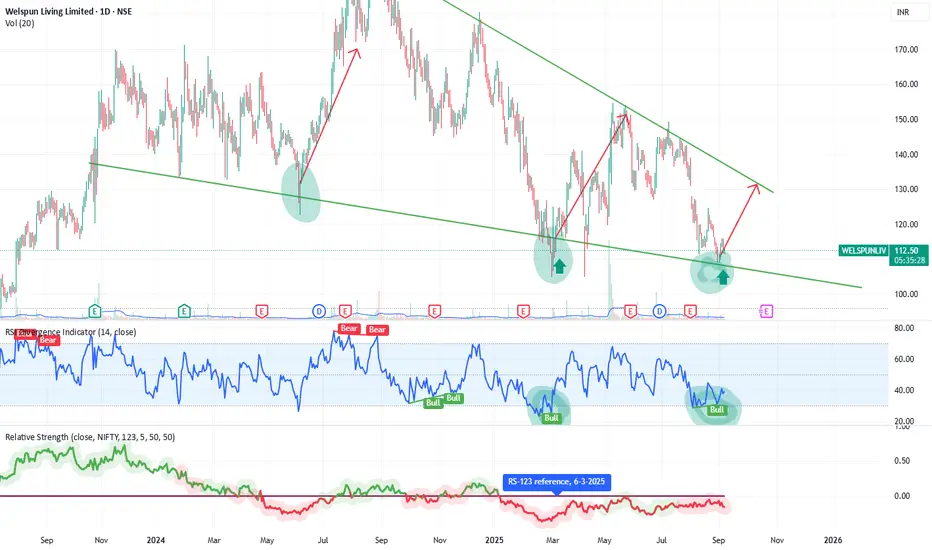
Welspun Living – Bullish Reversal | Swing Trade SetupWelspun Living (NSE: WELSPUNLIV) is showing a potential bullish reversal after bouncing off a long-term descending trendline support. This level has previously triggered strong upward swings.
The chart also shows a bullish RSI divergence, indicating waning selling momentum. A breakout above immedia
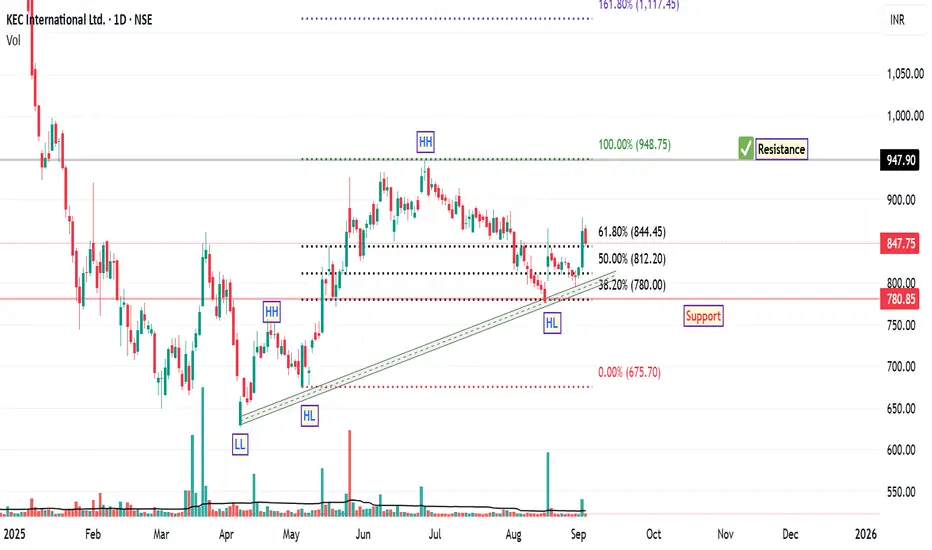
KEC International: Bullish Structure with StrengthSince April 7th, the price structure of KEC International has demonstrated a notable bullish trend reversal, characterized by the formation of higher highs and higher lows along an ascending trendline. This pattern is often interpreted by technical analysts as a sign of strengthening upward moment
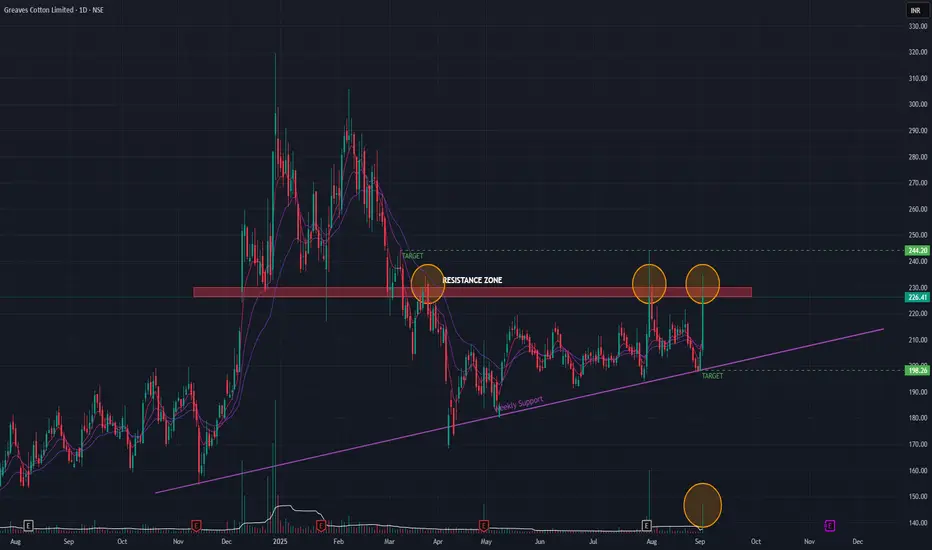
Greaves Cotton (Daily Timeframe) - Will it BreakOut or Not?Greaves Cotton since it's Double-Top formation has been in a downtrend. A key support level has become a resistance zone, which it's been trying to BreakOut few times. The stock has been forming Higher Lows for a while now. Few attempts to BreakOut has been futile. The recent BreakOut attempts been
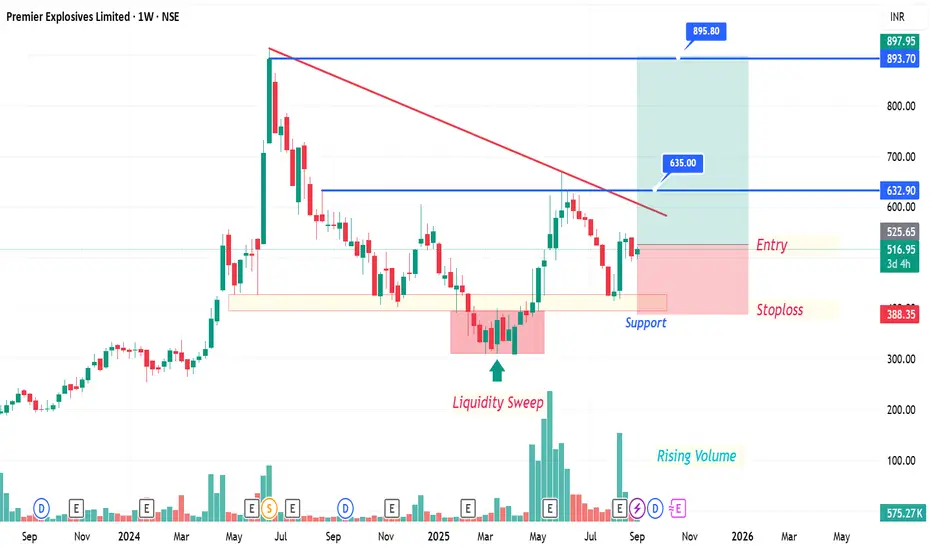
Premier Explosives Limited (NSE: PREMIER) Analysis -1WWeekly Chart Analysis
✅ Support Zone: Strong base around ₹388–400 held well with a liquidity sweep.
📈 Rising Volumes: Indicating accumulation and strong buying interest.
🔻 Downtrend Line: Stock approaching breakout zone near ₹632–635.
📌 Entry Zone: Around ₹517–525 (current levels).
⛔ Stoploss:
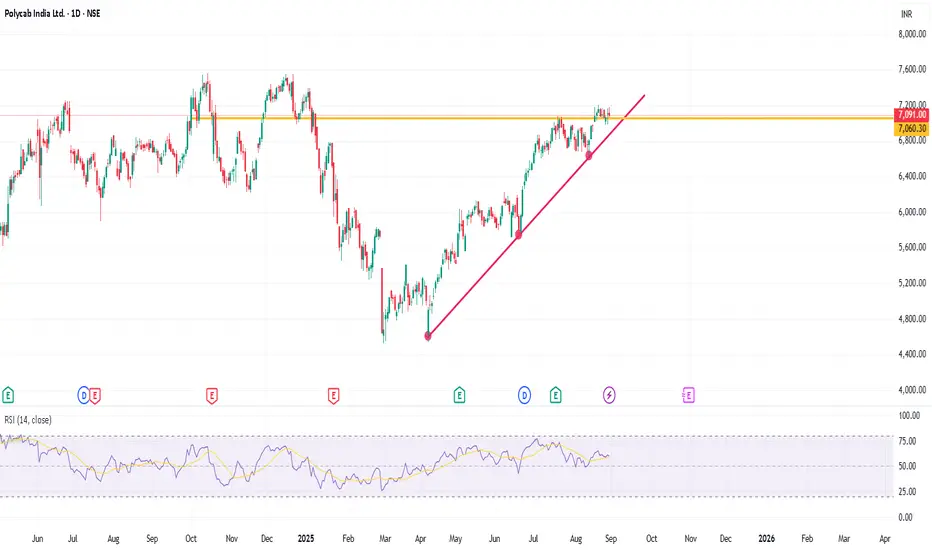
POLYCABThis analysis is intended solely for educational purposes and does not constitute financial advice.
Polycab is showing gradual bullish momentum, supported by a trendline reversal and trading above a key support level. The stock is currently in a minor consolidation phase, which may signal accumulat
Dixon Inverted HnSDixon Technologies is making a inverted Head n shoulder in the daily timeframe.
One can look for taking an entry at the retest of 17300-17320. Support can be considered at todays low. Keep a Check on the Chart and you will get to see how a head n shoulder is made.
Usually the Support for a HnS is

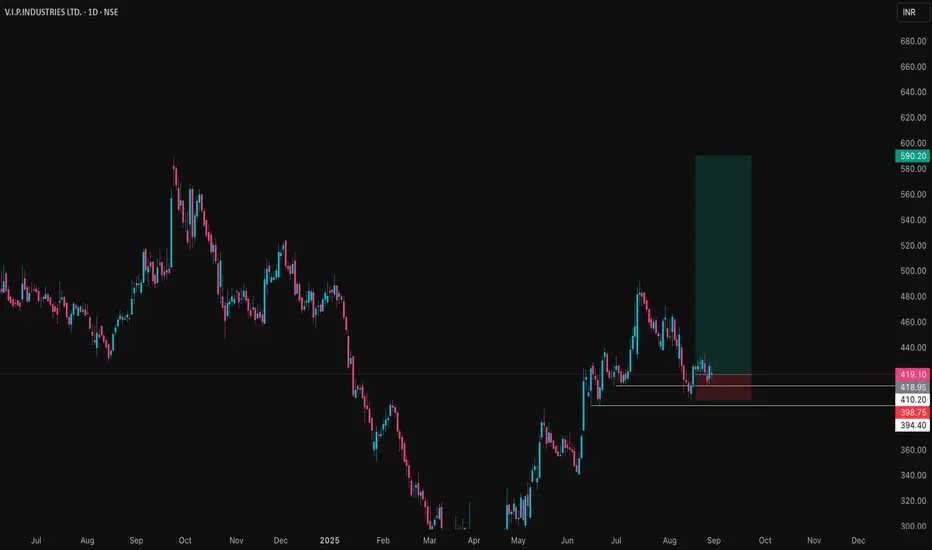
VIPIND Price ActionVIP Industries is trading around ₹420 at the end of August 2025, showing relative stability despite recent operational headwinds. The company reported a decline in both revenue and profitability for the June quarter, with net sales falling to approximately ₹561 crore and a posted net loss of about ₹
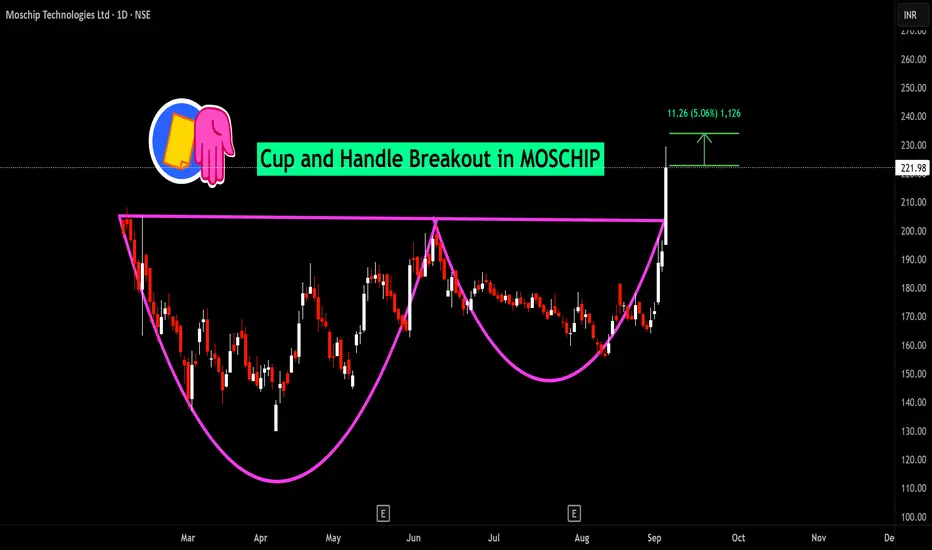
Garuda Construction – Cup & Handle Breakout | Swing Trade PlanGaruda Construction has given a textbook Cup & Handle breakout backed by strong volume and solid fundamentals.
Technical Analysis
A Cup & Handle pattern has formed with a neckline breakout above ₹200.
Stock closed strongly at ₹216.33 (+9.66%) with massive volume (7.5M vs 3.1M avg) - confirms inst

Support and Resistance Concept- Bank NiftyThis article concentrates on Support and resistance concept from investment perspective with Bank Nifty monthly chart example.
Let us first understand a few things:
⚪ In simple terms, a resistance is a level from where price rejects significantly because sellers dominated buyers. Contrastingly, su

See all editors' picks ideas
VWAP Price ChannelVWAP Price Channel cuts the crust off of a traditional price channel (Donchian Channel) by anchoring VWAPs at the highs and lows. By doing this, the flat levels, characteristic of traditional Donchian Channels, are no more!
Author's Note: This indicator is formed with no inherent use, and serves

Fibonacci Sequence Circles [BigBeluga]🔵 Overview
The Fibonacci Sequence Circles is a unique and visually intuitive indicator designed for the TradingView platform. It combines the principles of the Fibonacci sequence with geometric circles to help traders identify potential support and resistance levels, as well as price expansio

ATAI Volume Pressure Analyzer V 1.0 — Pure Up/DownATAI Volume Pressure Analyzer V 1.0 — Pure Up/Down
Overview
Volume is a foundational tool for understanding the supply–demand balance. Classic charts show only total volume and don’t tell us what portion came from buying (Up) versus selling (Down). The ATAI Volume Pressure Analyzer fills that g

Market Cap Landscape 3DHello, traders and creators! 👋
Market Cap Landscape 3D. This project is more than just a typical technical analysis tool; it's an exploration into what's possible when code meets artistry on the financial charts. It's a demonstration of how we can transcend flat, two-dimensional lines and step into

ZigzagLiteLibrary "ZigzagLite"
Lighter version of the Zigzag Library. Without indicators and sub-component divisions
method getPrices(pivots)
Gets the array of prices from array of Pivots
Namespace types: Pivot
Parameters:
pivots (Pivot ) : array array of Pivot objects
Returns: array array

ZigzagLibrary "Zigzag"
Zigzag related user defined types. Depends on DrawingTypes library for basic types
method tostring(this, sortKeys, sortOrder, includeKeys)
Converts ZigzagTypes/Pivot object to string representation
Namespace types: Pivot
Parameters:
this (Pivot) : ZigzagTypes/Pivot

Angled Volume Profile [Trendoscope]Volume profile is useful tool to understand the demand and supply zones on horizontal level. But, what if you want to measure the volume levels over trend line? In trending markets, the feature to measure volume over angled levels can be very useful for traders who use these measures. Here is an att

MathEasingFunctionsLibrary "MathEasingFunctions"
A collection of Easing functions.
Easing functions are commonly used for smoothing actions over time, They are used to smooth out the sharp edges
of a function and make it more pleasing to the eye, like for example the motion of a object through time.
Easing function

Treasury Yields Heatmap [By MUQWISHI]▋ INTRODUCTION :
The “Treasury Yields Heatmap” generates a dynamic heat map table, showing treasury yield bond values corresponding with dates. In the last column, it presents the status of the yield curve, discerning whether it’s in a normal, flat, or inverted configuration, which determined by us

Time & Sales (Tape) [By MUQWISHI]▋ INTRODUCTION :
The “Time and Sales” (Tape) indicator generates trade data, including time, direction, price, and volume for each executed trade on an exchange. This information is typically delivered in real-time on a tick-by-tick basis or lower timeframe, providing insights into the traded size

See all indicators and strategies
Community trends
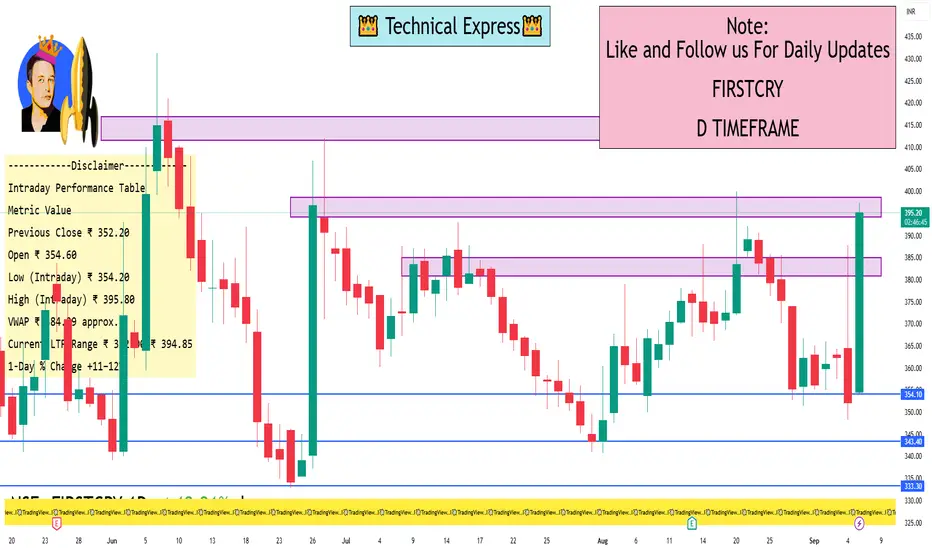
FirstCry 1 Day ViewIntraday Overview (1-Day Time-Frame)
Current / Last Traded Price (LTP): ₹392–₹393 range, reflecting an ~11 % gain over the previous close of ₹352.20
Previous Close: ₹352.20
Intraday Percentage Gain: Approximately +11.3 %
VWAP (Volume Weighted Average Price): ₹384.39–₹384.85
Open / High / Low
Welspun Living – Bullish Reversal | Swing Trade SetupWelspun Living (NSE: WELSPUNLIV) is showing a potential bullish reversal after bouncing off a long-term descending trendline support. This level has previously triggered strong upward swings.
The chart also shows a bullish RSI divergence, indicating waning selling momentum. A breakout above immedia
BUY TODAY SELL TOMORROW for 5%DON’T HAVE TIME TO MANAGE YOUR TRADES?
- Take BTST trades at 3:25 pm every day
- Try to exit by taking 4-7% profit of each trade
- SL can also be maintained as closing below the low of the breakout candle
Now, why do I prefer BTST over swing trades? The primary reason is that I have observed that
G Power – Weekly Breakout with Gap-Up and Strong VolumeTechnical View:
Stock has given a decisive breakout on the weekly chart, accompanied by a gap-up opening, which adds conviction.
Volume spike indicates strong institutional demand backing the move.
Relative strength vs Nifty has turned positive, showing clear outperformance compared to the br
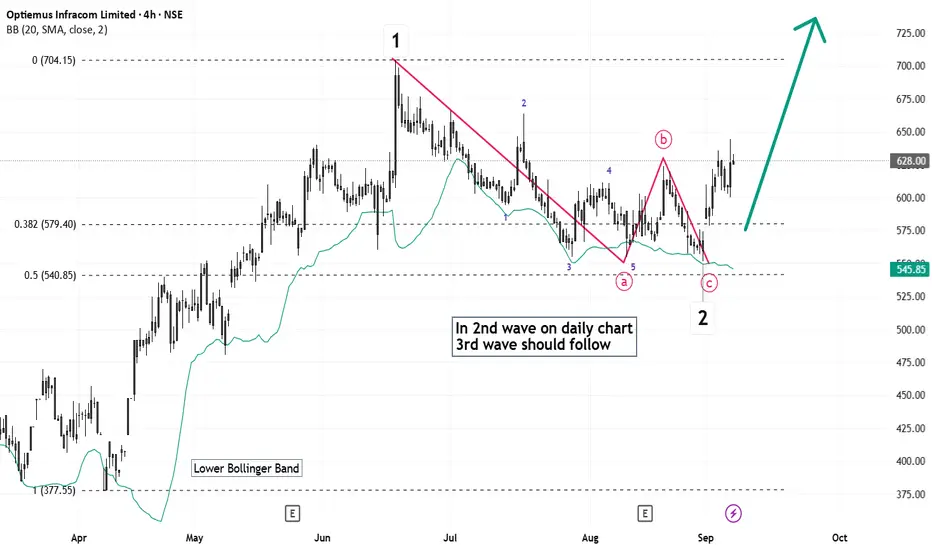
Elliott Wave Analysis of Optiemus Infracom OPTIEMUSThe script is completing 2nd wave on daily chart, at around 0.5% retracement level. This should be followed by 3rd wave. Wave (i) of 3rd wave seems to be ongoing.
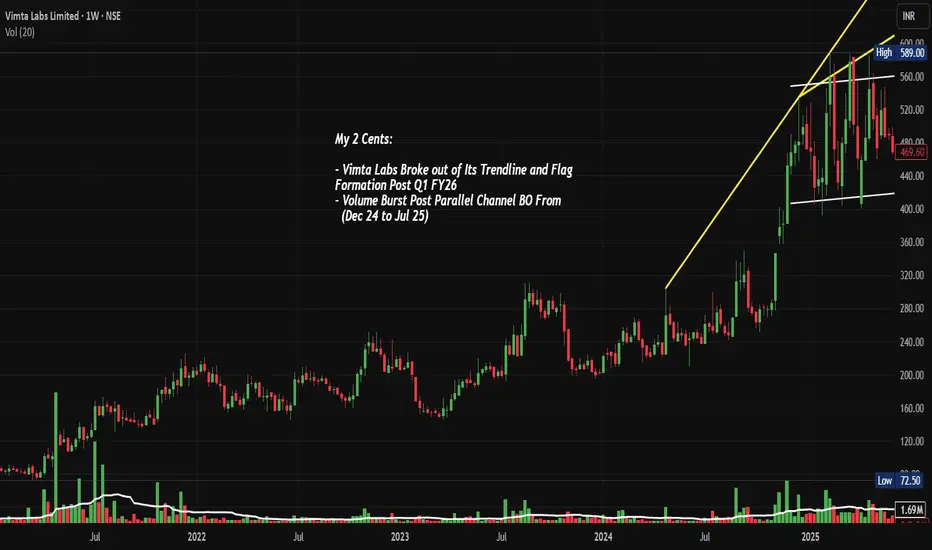
VIMTALABS: Parallel Channel & Flag BO, Chart of the WeekNSE:VIMTALABS Explodes 50%: From Parallel Channel Prison to Trendline Freedom Post Q1 FY26 Flag Breakout. Let's analyse it in the "Chart of the Week"
As per the Latest SEBI Mandate, this isn't a Trading/Investment RECOMMENDATION nor for Educational Purposes; it is just for Informational purposes
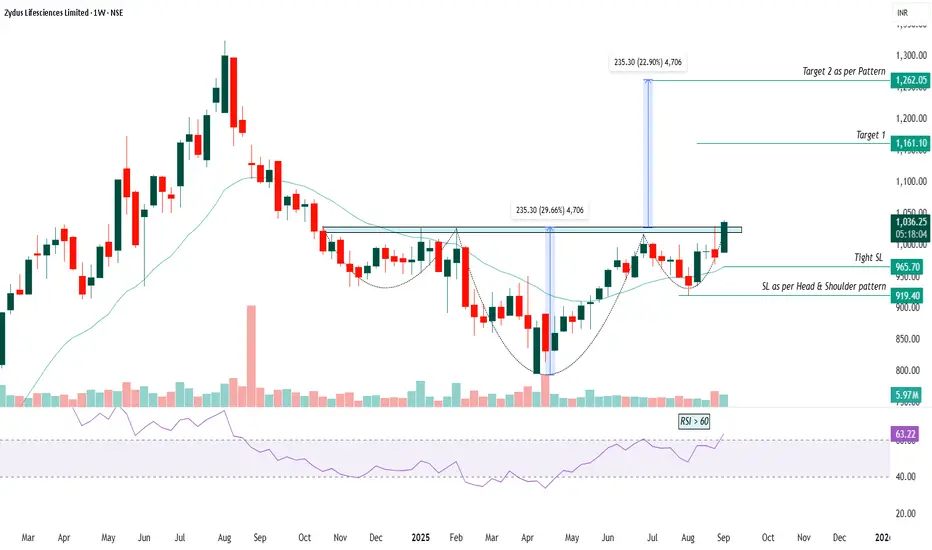
ZYDUSLIFE - Inverted Head and Shoulder's Pattern1. The chart shows Zydus Lifesciences Limited on a weekly timeframe with recent bullish momentum, closing at 1036.85 INR.
2. A clear inverse head and shoulders pattern is marked, indicating a possible trend reversal from downtrend to uptrend.
3. The neckline resistance has been broken, confirming th
National Securities Depository Limited (NSDL) – Swing Setup🔍 Chart View
NSDL has shown strong consolidation post-IPO with a symmetrical triangle breakout setup on the daily chart. Volumes suggest accumulation at lower levels. Fundamentals remain solid, making this a potential swing candidate.
Entry (CMP): ₹1,283
Stoploss: ₹1,221
Targets:
🎯 T1: ₹1,428

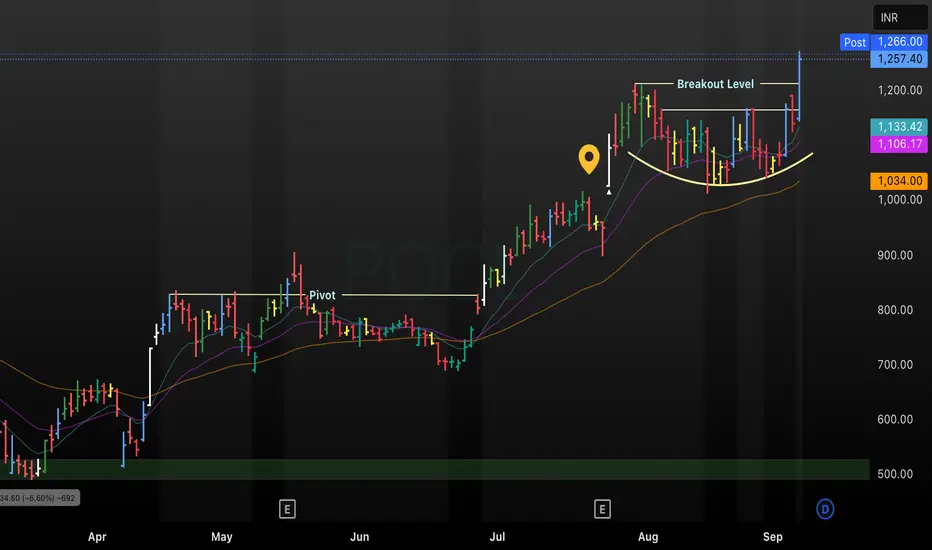
POCL Breakout Analysis & Trend Structure This annotated POCL daily chart tracks price movement from April to September 2025, displaying key technical events including a consolidation pivot, formation of a rounded base, and recent breakout above a major resistance level. Multiple moving averages (including short, medium, and long-term) supp
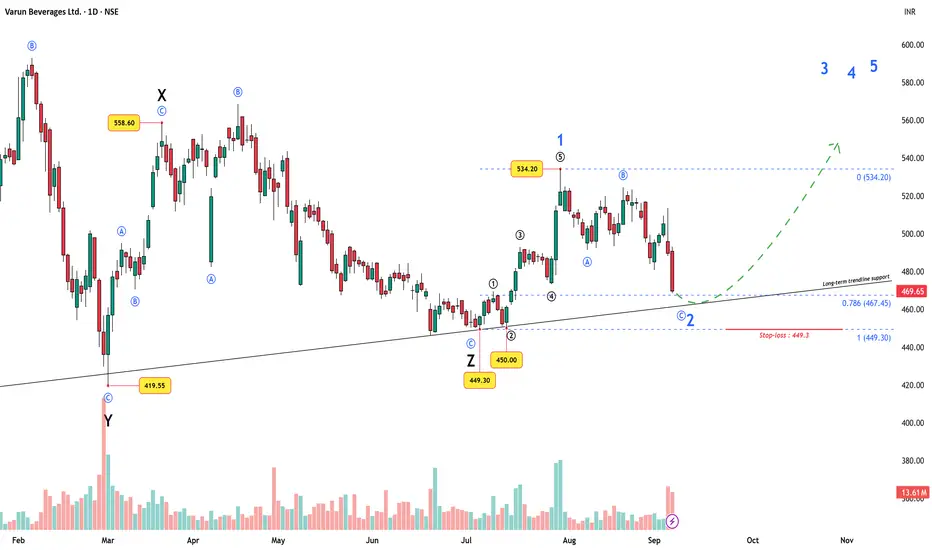
Varun Beverages Ltd – Wave 2 Setup at Trendline SupportVarun Beverages Ltd. (VBL), PepsiCo’s second-largest global bottling partner, has been through a long and exhausting corrective phase. On the Elliott Wave chart, this stretched out as a W–X–Y–X–Z sequence, finally bottoming out at ₹449.3 .
On the current chart you may not clearly see the entire
See all stocks ideas
No scheduled reports
Community trends
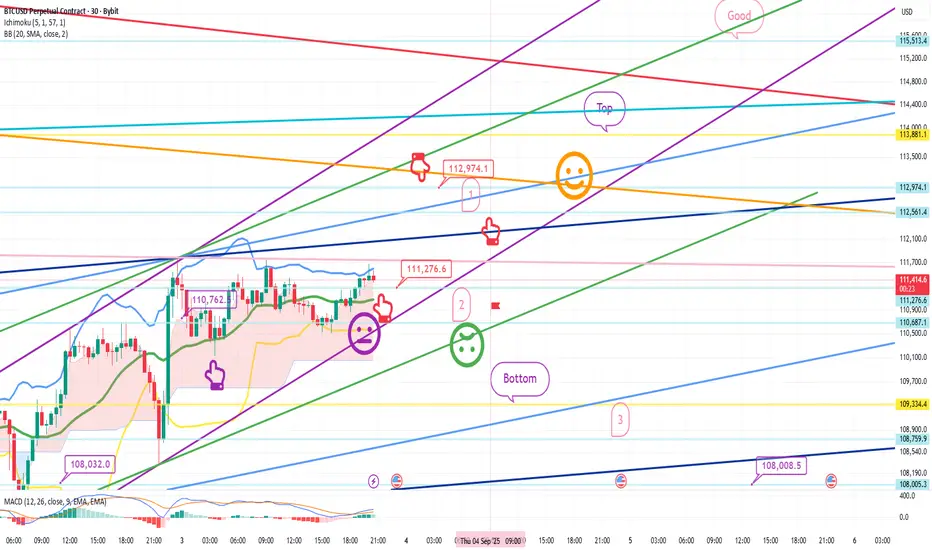
BTC/USD Bullish Order Block Setup – Targeting 114,328BTC/USD (1H) Analysis
Trend & Structure: Price has been respecting a rising channel with clear support and rejection lines. After testing the support line, it rebounded and is now consolidating.
EMA Strategy: Price is fluctuating around the 70 EMA (111,081) and 200 EMA (110,902), showing short-ter

Mina 2H LongPair: MINA/USDT Perpetual Contract
• Timeframe: 2 hours
• Current Price: ~0.1822 USDT
• Indicators:
• EMA (likely short-term, e.g., EMA 9 & 20)
• Volume profile below
⸻
🔹 Key Observations
1. Descending Trendline:
• A downward sloping resistance line is drawn from August highs.
• Price is c

[SeoVereign] BITCOIN BEARISH Outlook – September 03, 2025Let me first take a look at the situation of Bitcoin.
Currently, the situation of Bitcoin is not very good.
These days, it has been continuing to decline, based on 124,400.
Unfortunately, I expect there will be a little more decline this time as well.
The first is the double top.
If you check aroun

“Bitcoin Price Action: Liquidity Grab Fuels Next Bullish Impulse“Bitcoin Price Action: Liquidity Grab Fuels Next Bullish Impulse 📈”
Hello Traders & Investors,
Let’s take a closer look at BTCUSD from both a structural and liquidity perspective.
🔹 Market Structure
The chart shows that after a strong bullish leg into mid-August, BTCUSD faced heavy rejection fro

XAUUSD GOLD ANALYSIS ON(04/09/2025)#XAUUSD UPDATEDE
Current price - 3542
If price stay below 3570, then next target 3520,3508 and above that 3600
Plan;If price break 3540-3550 area, and stay below 3545, we will place sell order in gold with target of 3525 and 3508 & stop loss should be placed at 3600

BTCUSD FORMING INVERSE HEAD & SHOULDER In hourly chart BTC forming inverse head and shoulder pattern which is clearely visible.
> theren is break out seen in this chart.
> target as well as support/resistance T1,T2 & S1,S2 is mentioned here
> this is just for information not buy/sell call.

BITCOINbitcoin creat higher high & lower low ,bitcoin cmo 110649 rasistance zone 119000 to 120800 lower side target 99550 risk reward 1:1

Bitcoin Bybit chart analysis September 3Hello
It's a Bitcoin Guide.
If you "follow"
You can receive real-time movement paths and comment notifications on major sections.
If my analysis was helpful,
Please click the booster button at the bottom.
This is a Bitcoin 30-minute chart.
The Nasdaq indicators will be released at 11:00 AM.
A
BTC LONGBtc long above 110,000
sl 109500
target 110500/111000/111500/112000/112500
time to long btc above 109000

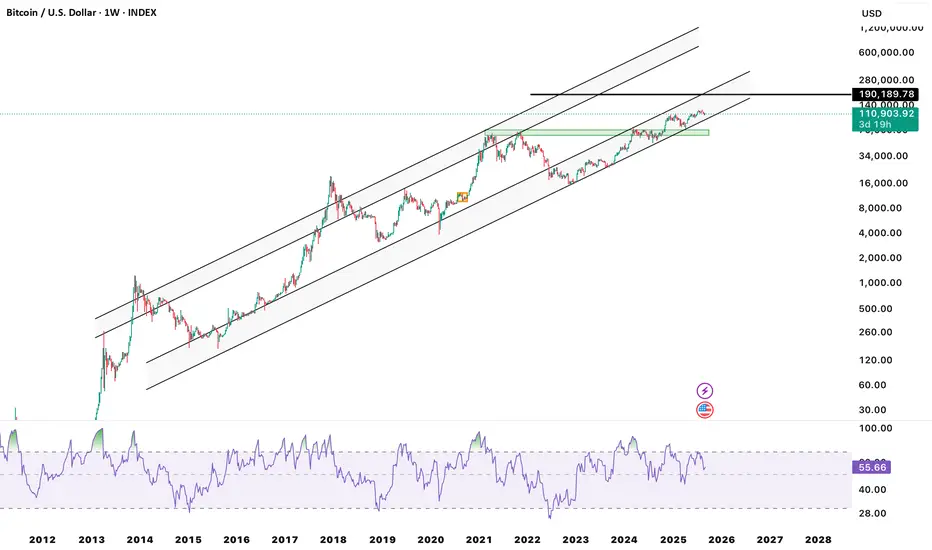
Bitcoin channel from 2015, don’t ignore it. Not financial adviceBitcoin channel from 2015, don’t ignore it. Not financial advice
See all crypto ideas
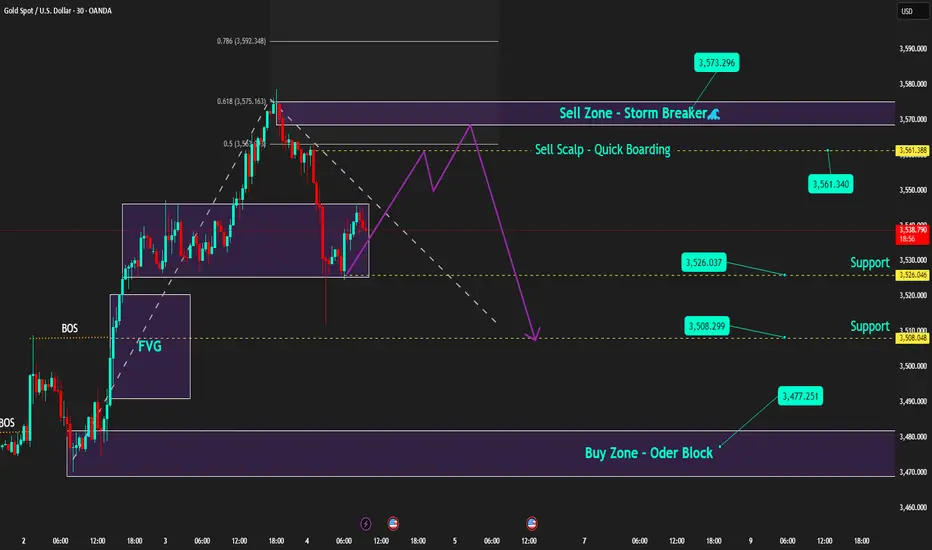
Bearish Pressure Builds: Gold Poised for More RetreatGold retreated sharply today as expected, and directly hit my expected retracement target of 3520-3510 area; the lowest point happened to be around 3511. We added a lot of short positions around 3575 and 3578 overnight, which helped us to make considerable profits during the gold retreat. All short

NIFTY @ 24828. Will HISTORY Repeat?LTP: 24828
Supports: 24389/23830/23587
Resistances: 25025/155/2579626440
As long as the above supports hold, we can see 25300 first.
Further 25877, 26190, 26819 (ultimate target), 27234+++.

XAUUSD Daily Trading Plan Ahead of NFP | MMFLOW TRADINGGold (XAUUSD) has slowed down after a strong bullish rally and is now consolidating in a sideways range 355x – 354x, waiting for today’s Non-Farm Payrolls (NFP) data to set the next major move.
📊 Macro View:
If NFP comes out better than expected, USD strength could push Gold lower into 352x – 350x
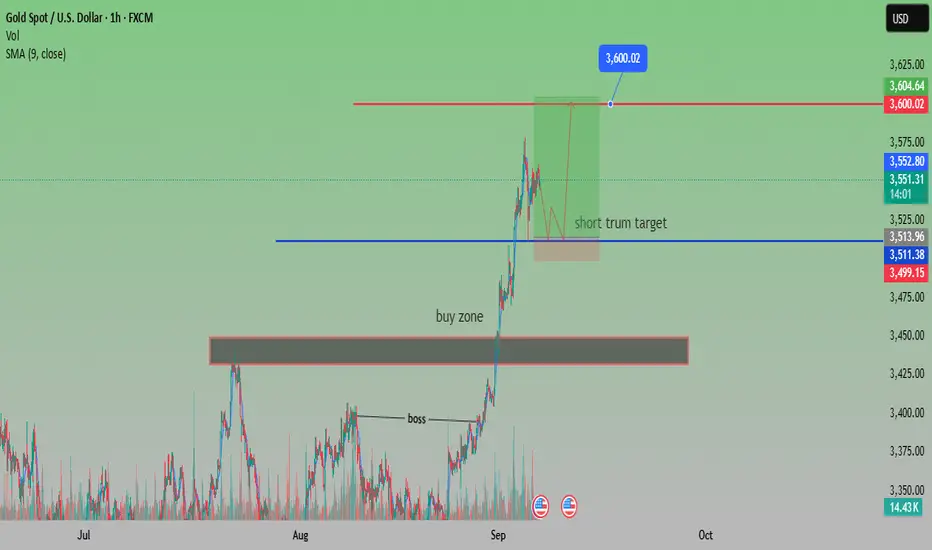
Gold Targets $3,600 After Strong BreakoutAnalysis:
Gold (XAU/USD) continues its bullish rally after breaking above the buy zone near $3,440 and holding strong momentum. The market has recently made higher highs, with price consolidating slightly below the resistance zone.
Currently, gold is trading at $3,548, with the short-term target id
Crazy gold! Buy or wait for a pullback?Market News:
Spot gold prices fluctuated narrowly in early Asian trading on Friday (September 5th), currently trading around $3,550 per ounce. International gold, a traditional safe-haven asset, hit a record high of $3,578 per ounce on Wednesday amid growing global economic uncertainty. The London

Gold 05/09: Ready to Scalp the Drop or Buy the Dip?🟢 Market Context
Gold is currently showing a short-term bearish setup after a ChoCH (Change of Character) near 3,536.556. The market is rejecting supply and forming liquidity sweeps around the 3,531–3,533 zone. Expect price to pull lower towards demand areas before the next bullish leg.
📍 Key Level

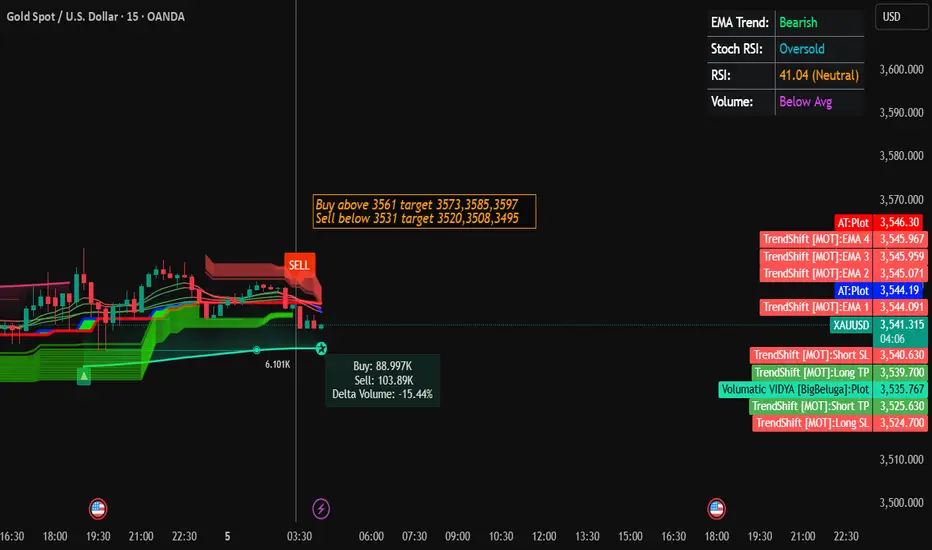
Gold Trading Strategy for 05th September 2025📊 Gold Trading Setup
🟢 Buy Setup
Entry: Buy above the high of the 1-hour candle once price closes above $3561
Targets:
🎯 Target 1: $3573
🎯 Target 2: $3585
🎯 Target 3: $3597
🔴 Sell Setup
Entry: Sell below the low of the 15-minute candle once price closes below $3531
Targets:
🎯 Target 1: $3520
🎯 Targ
FED dovish, Gold stays bullish; SELL only for scalps⚓️ Captain Vincent – Gold Plan XAU/USD
1. Market Wave 🌍
The probability of a FED rate cut in September surged to 96.6% (vs 90.4% earlier) after the JOLTS report showed weakening job prospects.
Several FED officials, from Kashkari to Bostic, shifted dovish. Only Musallim maintained a hawkish stance
Gold Rally Faces Exhaustion – Is a Pullback Next?Gold Rally Faces Exhaustion – Is a Pullback Next?
📊 Gold Market Analysis (XAU/USD)
🔹 Fundamental Outlook
Macroeconomic Sentiment
Recent economic data from the U.S. continues to shape gold’s trajectory. Slower job growth and rising recessionary signals are fueling expectations that the Federal Res

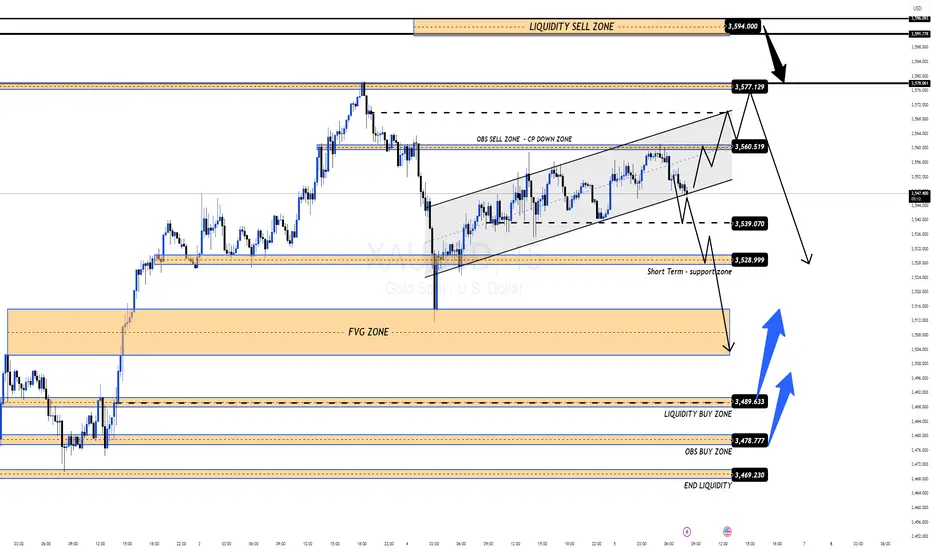
Gold Price Analysis – Testing Resistance near Sell ZoneAnalysis:
Gold (XAU/USD) is currently trading around 3,551.40, showing minor intraday losses (-0.03%). The chart indicates a strong resistance zone between 3,556–3,563, identified as the “sell zone,” with an All-Time High (ATH) slightly above at 3,578.12. Price is consolidating beneath this resistan

See all futures ideas
NZDUSD Forming a Great Sell side scenario....NZDJPY is approaching 4H resistance zone, which has already show rejection previously. There is also a steep bullish trend line creating a confluence. There is a valid 4H FVG at upside. All these things signalling a coming very good sell side opportunity. Below are points detailing the same.
1. Pri

BUY EURUSDEUR/USD – Buy Setup 📈
Entry: 1.16564
Stop Loss: 1.16058
Take Profit: 1.18758
Reasoning: Price bounced from key supportwith bullish candlestick confirmation.

AUDUSD-ShortAUD/USD 15m Chart Update
1️⃣ HTF Resistance
Price has reached a higher-timeframe resistance zone.
This is an important supply area where sellers may step in.
2️⃣ Bearish Order Block (OB)
A bearish order block is formed just below the resistance.
Price tapped into this OB and showed rejection with r

USDCHF BearishA long downward channel in USDCHF predicts a fall in USD comparing with CHF.
This pair is under pressure for so long so I am selling it for further down move.

USD/JPY(20250905)Today's AnalysisMarket News:
The US August "Non-Farm Payrolls" report came in at 54,000, below the expected 65,000. The previous figure was revised up from 104,000 to 106,000. Initial jobless claims rose unexpectedly to 237,000 last week, the highest level since June.
Technical Analysis:
Today's Buy/Sell Levels

EUR/USD Long SetupPrice consolidating after recent downside move.
Entry taken from demand zone with stop below structure and target towards recent highs.
Looking for bullish continuation as liquidity builds to the upside.
REMEMBER THIS IS A HIGH RISK TRADE(Not the best setup possible)

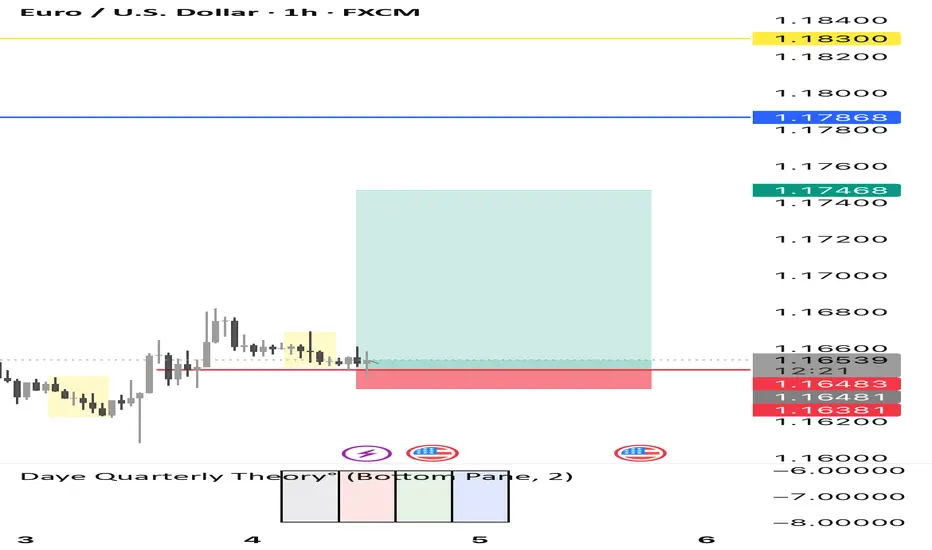
EURUSD 1H Chart – Bullish Setup✅ Support: 1.1640–1.1650
🎯 Targets: 1.1746 / 1.1786 / 1.1830
⛔ SL: Below 1.1638
Bias: Bullish as long as above support. Upside momentum may push towards 1.1830.
#Forex #Trading #EURUSD #PriceAction
BreakOut Retest Strategy Price came back to a fresh supply zone.
First candle went bullish, second candle (50% wick / 50% body) showed rejection + sellers entering.
You entered sell after confirmation.
Stop above zone, TP far below → 1:8 RR achieved.
Key: fresh zone + rejection + patience → high probability trade.
Sell Trade - NZD/USDGreetings to everyone!
You can place a sell trade on NZD/USD and check out my chart for the ideal entry, stop-loss & target placement.
Remember :-
* Move your SL to breakeven once the trade reaches 1:1 R.
* Aim for a minimum reward of 1:1.5 R.
* Don't risk more than 3% of your total margin.

GBPNZD Market Outlook: Pound Strength vs Kiwi WeaknessGBPNZD Market Outlook: Pound Strength vs Kiwi Weakness
GBPNZD Analysis Report
🔎 Technical Outlook
The pair has shown a clear upward channel structure, followed by a sharp breakout with strong bullish momentum.
After topping out, price shifted into a downward corrective leg, suggesting rebalancing

See all forex ideas
| - | - | - | - | - | - | - | - | ||
| - | - | - | - | - | - | - | - | ||
| - | - | - | - | - | - | - | - | ||
| - | - | - | - | - | - | - | - | ||
| - | - | - | - | - | - | - | - | ||
| - | - | - | - | - | - | - | - | ||
| - | - | - | - | - | - | - | - | ||
| - | - | - | - | - | - | - | - | ||
| - | - | - | - | - | - | - | - |
Trade directly on the supercharts through our supported, fully-verified and user-reviewed brokers.


