Lumax industries Look like after strong volume absorption done
Also auto part sector in trending.
Also sector given break out
Little bit late post , allready created entry just post for my trading history chart remember in future look what i have done mistake or Good point
Take 10%risk withtrade

The best trades require research, then commitment.
Get started for free$0 forever, no credit card needed

Scott "Kidd" PoteetThe unlikely astronaut

Where the world does markets
Join 100 million traders and investors taking the future into their own hands.
Major indices

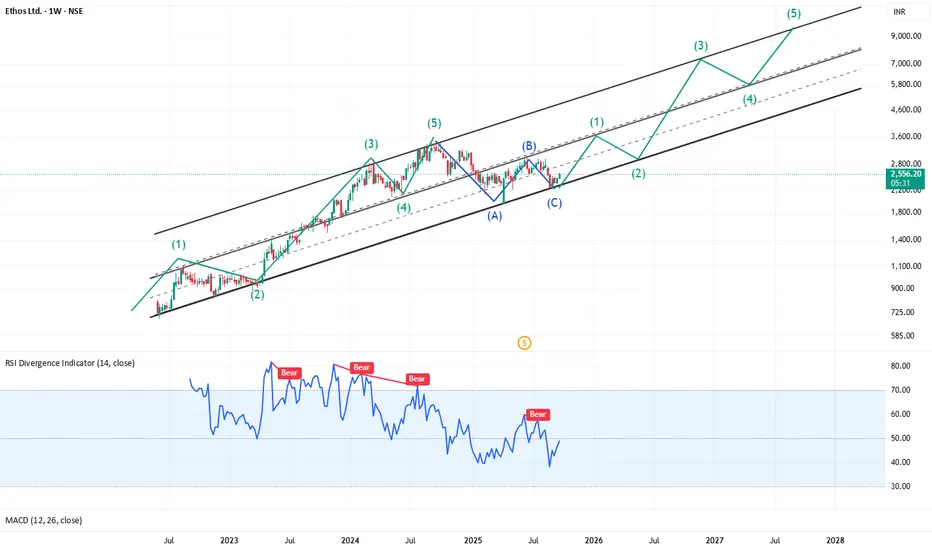
Fasten your wrist watches : CMP 2560Impulse and Corrective Structure
On the ETHOS weekly chart, the price action aligns closely with classic Elliott Wave theory. A complete 5-wave impulse pattern (labelled 1-2-3-4-5 in green) can be observed progressing within a rising parallel channel. Each impulse sequence is followed by a 3-wave c
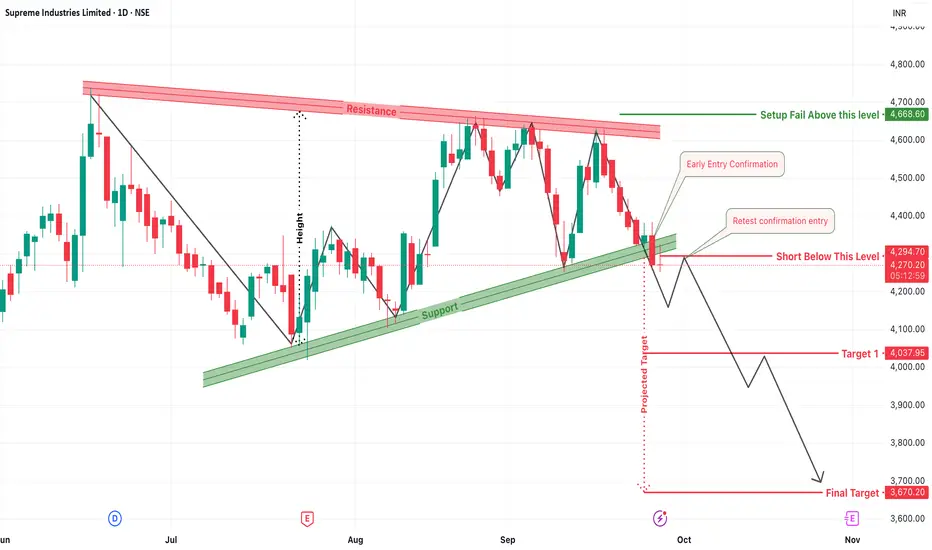
Supreme Industries: Breakdown Below Ascending SupportThe daily chart of Supreme Industries is showcasing a strong bearish signal with a breakdown below a long-held ascending trendline. The structure clearly resembles a descending triangle pattern, and the breakdown confirms growing weakness in price action, favoring sellers in the near term.
1. Bear
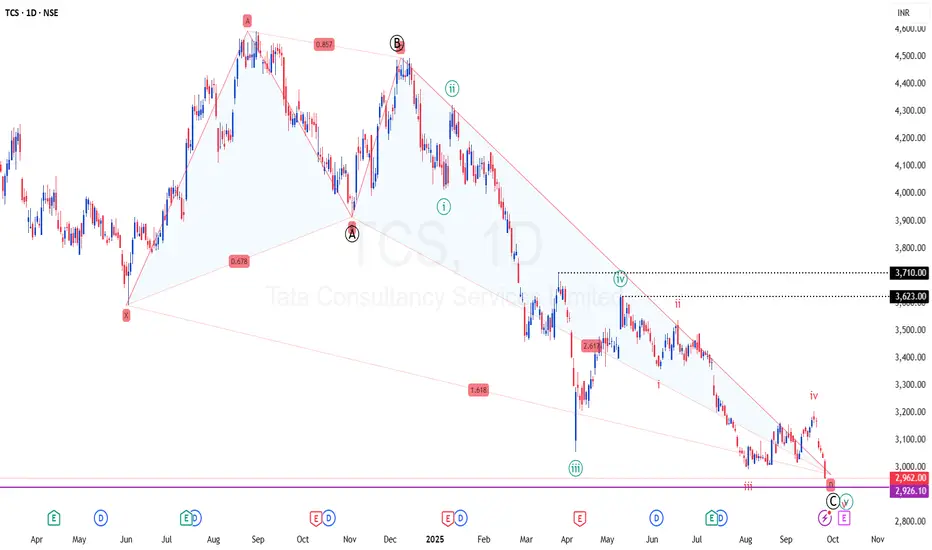
TCS - Time to go up towards 3500+ Bullish CRAB PRZ at play
TF: Daily
CMP: 2965
Here is my previous post on this script for a detailed review.
Price has completed the potential target as per the Bullish Crab pattern.
Results are due in the next couple of weeks.
I expect the stock to bounce from this zone 2900-2950 and potentially march towards 3500+ i
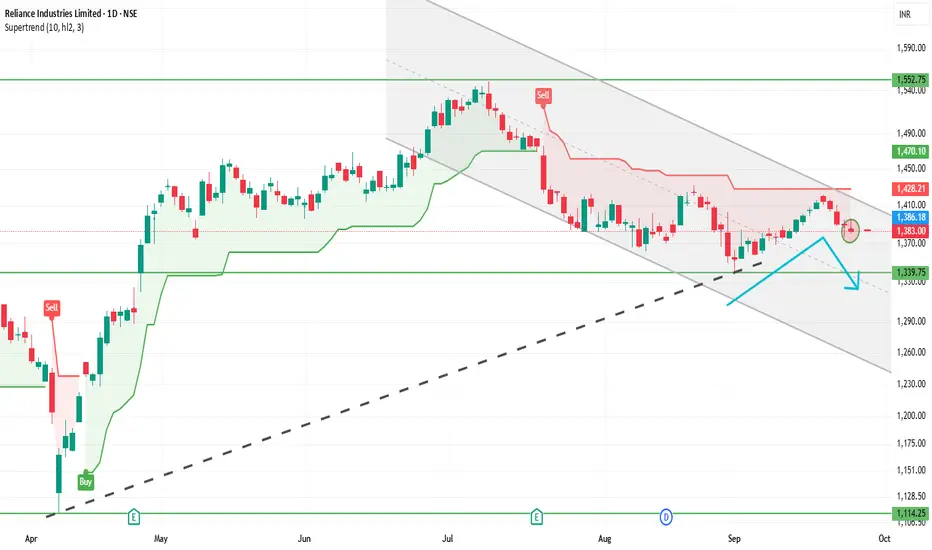
RELIANCE 1D Time frame📊 Reliance Daily (1D) Snapshot
Close: Around ₹1,382
Range of the Day: High near ₹1,396, Low near ₹1,380
Trend: Slight weakness on daily chart (mild red candle)
Stock is consolidating between support and resistance zones.
🎯 Key Daily Levels
Support Zone: ₹1,350 – ₹1,365
Strong Support: ₹1,330
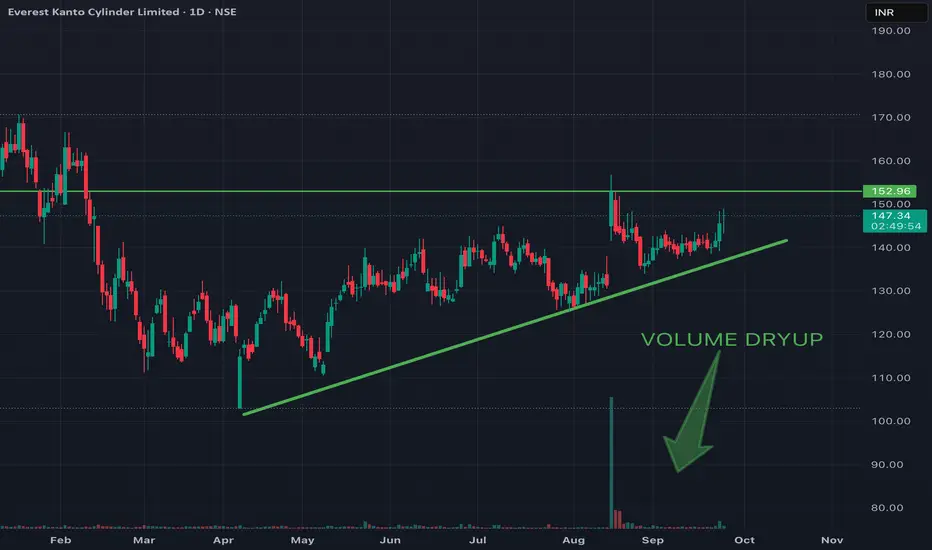
EKC LOOKING GOOD FOR 10-20% MOVE1. Volume dry-up near breakout zone.
2. Trendline Support.
3. Price sustaining at above levels and ready to move upwards from demand zone.
4. Easy 10-20% move possible.
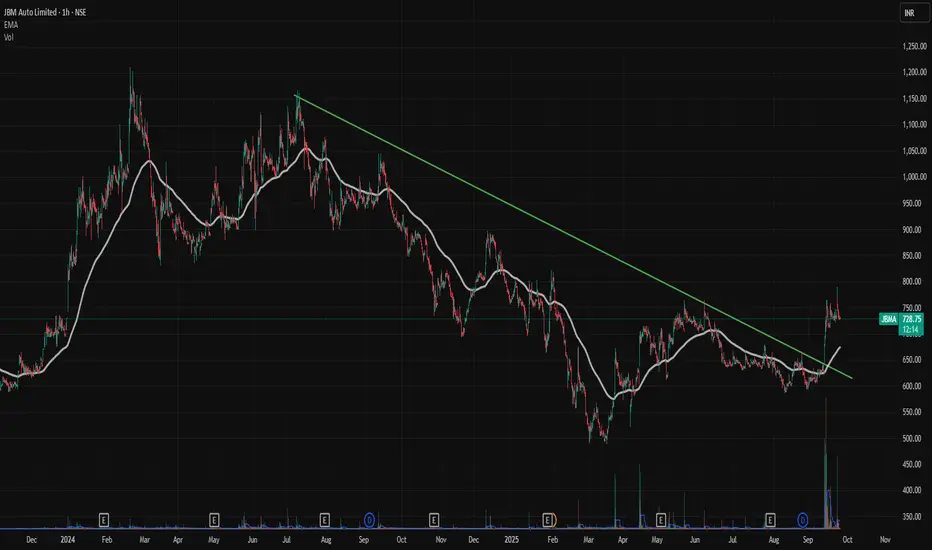
Gapup breakout in JBMAA good good gap up in JBMA.
Very healthy volumes showing up.
Very good time to enter as consolidating after gapup
Trendline breakout also.
good setup
can enter on 1 hr time frame
Risk to Reward ratio 1:2 or higher .
Thank u
Abdul Maajid Gouri
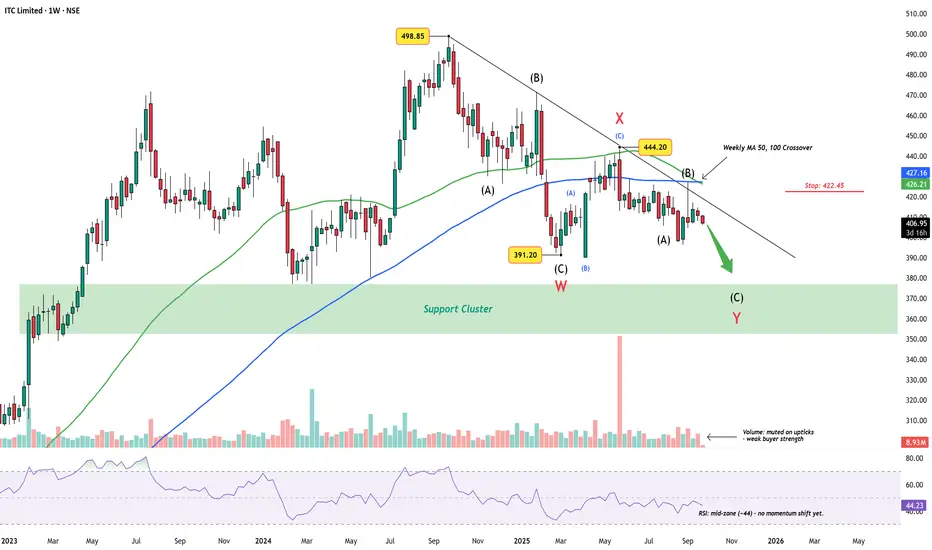
ITC Limited Weekly Chart – Wave Y Targets Support ClusterITC has been trending lower since the ₹498.85 peak, carving out what appears to be a complex W-X-Y correction. The first leg (W) found support near ₹391.20, followed by a corrective bounce into X at ₹444.20. The decline since then has kept price under a descending trendline, respecting the larger co
Tanla Platforms : Inverted Head & Shoulder in making Tanla Platforms is forming a inverted head and Shoulder pattern right shoulder . On Friday last week , the stock is just around the neckline .
The Stock just started holding above 50 and 200 DMA.
RSI daily reading is above 70 indicating a positive momentum.
Need to be watchful in next week , i

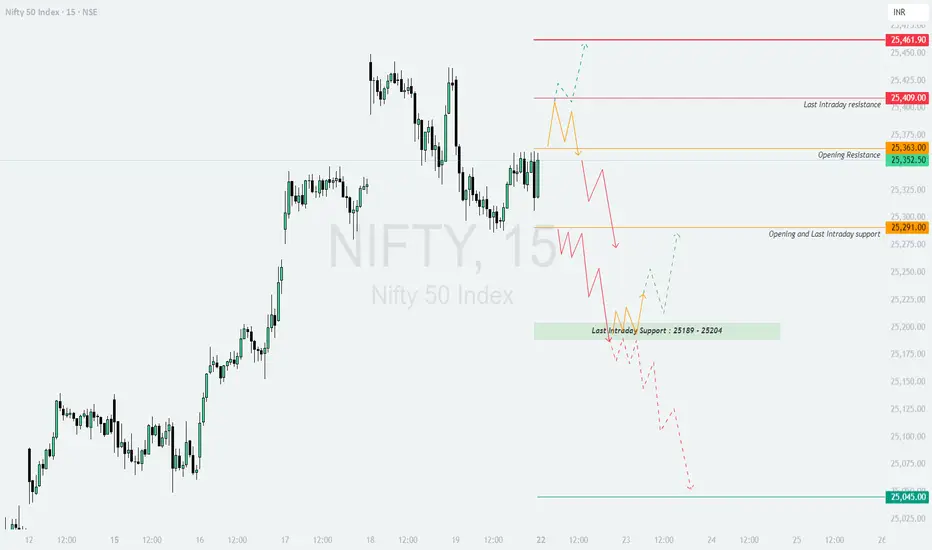
NIFTY : Trading levels and Plan for 22-Sep-2025NIFTY TRADING PLAN – 22-Sep-2025
The index closed around 25,352, with immediate opening resistance at 25,363, and higher hurdles near 25,409 (last intraday resistance) and 25,461. On the downside, supports are placed at 25,291 (opening/last intraday support) and the 25,189–25,204 zone. The critica
See all editors' picks ideas
RiskMetrics█ OVERVIEW
This library is a tool for Pine programmers that provides functions for calculating risk-adjusted performance metrics on periodic price returns. The calculations used by this library's functions closely mirror those the Broker Emulator uses to calculate strategy performance metrics (

Simple Decesion Matrix Classification Algorithm [SS]Hello everyone,
It has been a while since I posted an indicator, so thought I would share this project I did for fun.
This indicator is an attempt to develop a pseudo Random Forest classification decision matrix model for Pinescript.
This is not a full, robust Random Forest model by any stretch o

Tick CVD [Kioseff Trading]Hello!
This script "Tick CVD" employs live tick data to calculate CVD and volume delta! No tick chart required.
Features
Live price ticks are recorded
CVD calculated using live ticks
Delta calculated using live ticks
Tick-based HMA, WMA, EMA, or SMA for CVD and price
Key tick levels (S

analytics_tablesLibrary "analytics_tables"
📝 Description
This library provides the implementation of several performance-related statistics and metrics, presented in the form of tables.
The metrics shown in the afforementioned tables where developed during the past years of my in-depth analalysis of various str

Adaptive Trend Classification: Moving Averages [InvestorUnknown]Adaptive Trend Classification: Moving Averages
Overview
The Adaptive Trend Classification (ATC) Moving Averages indicator is a robust and adaptable investing tool designed to provide dynamic signals based on various types of moving averages and their lengths. This indicator incorporates multipl

Statistics • Chi Square • P-value • SignificanceThe Statistics • Chi Square • P-value • Significance publication aims to provide a tool for combining different conditions and checking whether the outcome is significant using the Chi-Square Test and P-value.
🔶 USAGE
The basic principle is to compare two or more groups and check the results

FiniteStateMachine🟩 OVERVIEW
A flexible framework for creating, testing and implementing a Finite State Machine (FSM) in your script. FSMs use rules to control how states change in response to events.
This is the first Finite State Machine library on TradingView and it's quite a different way to think about your

Trading Activity Index (Zeiierman)█ Overview
Trading Activity Index (Zeiierman) is a volume-based market activity meter that transforms dollar-volume into a smooth, normalized “activity index.”
It highlights when market participation is unusually low or high with a dynamic color gradient:
Light Blue → Low Activity (thin p

Expected Value Monte CarloI created this indicator after noticing that there was no Expected Value indicator here on TradingView.
The EVMC provides statistical Expected Value to what might happen in the future regarding the asset you are analyzing.
It uses 2 quantitative methods:
Historical Backtest to ground your anal

Bar Index & TimeLibrary to convert a bar index to a timestamp and vice versa.
Utilizes runtime memory to store the 𝚝𝚒𝚖𝚎 and 𝚝𝚒𝚖𝚎_𝚌𝚕𝚘𝚜𝚎 values of every bar on the chart (and optional future bars), with the ability of storing additional custom values for every chart bar.
█ PREFACE
This library aims to tackle s

See all indicators and strategies
Community trends
15% Upside in Lumex IndustriesLate post,
The Chart is following a Flag and Pole pattern and the stock has already moved 15% up from the bootom of the flag and now the pole is being formed with still 15% possible upside accoring to the pattern. 23rd Sep to 26th Sep the delivery volumes are good 28%,29%,31% & 50% on sep 26th. The
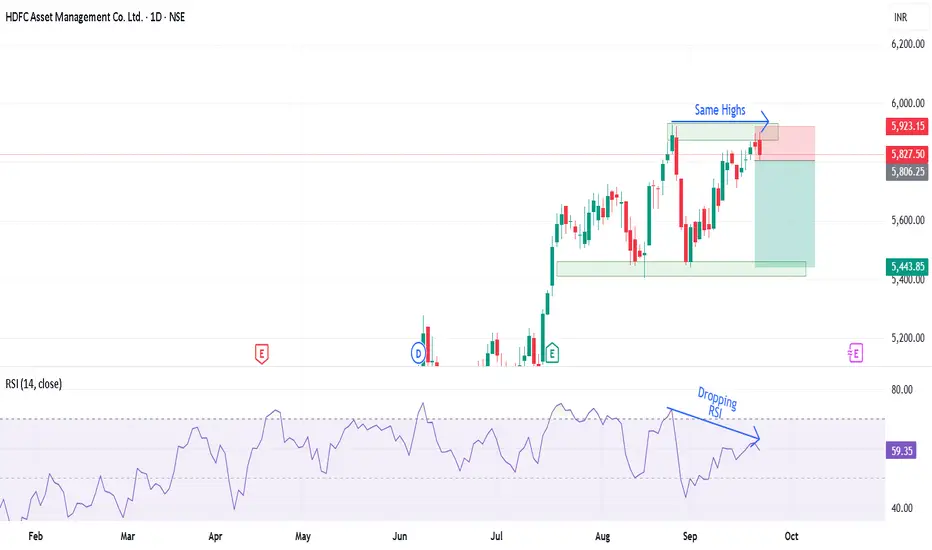
Double Top at the Peak: Is a Bearish Reversal Coming in HDFC AMCHDFC AMC has given a good upside rally of 65% and is form a double top pattern.
The stock is following a bullish trendline but the RSI divergence is creating a bearish sentiment supported by the drop India VIX.
If the stock breaks below the trendline, a bearish trade can be entered with the first
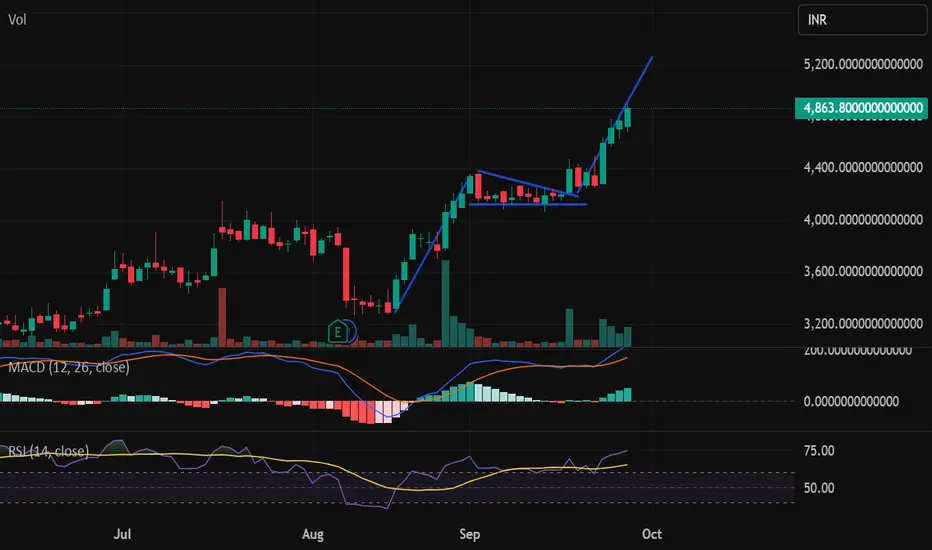
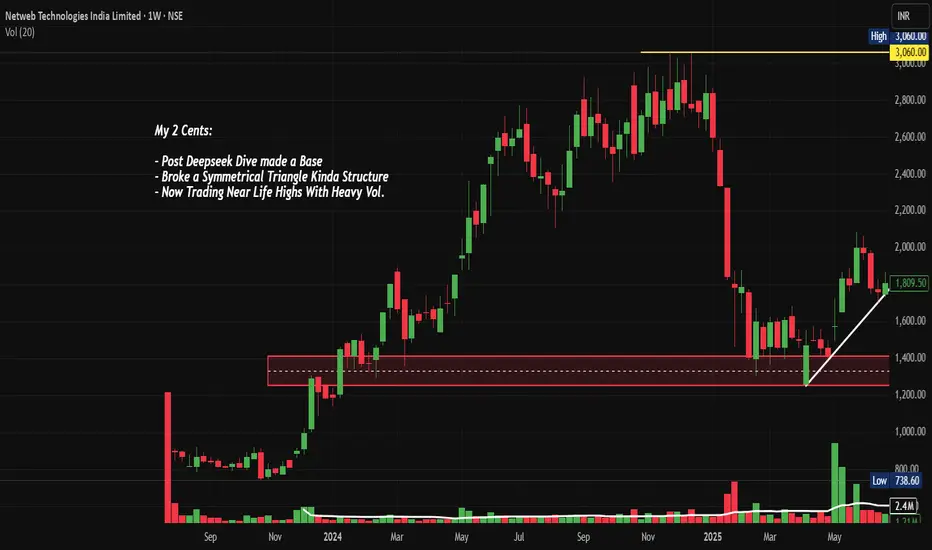
NETWEB: AI Infrastructure Goldmine ? Chart of the MonthNSE:NETWEB MarchingTowards 4,000: Is This the AI Infrastructure Goldmine You've Been Waiting For? Let's analyze in the "Chart of the Month".
As per the Latest SEBI Mandate, this isn't a Trading/Investment RECOMMENDATION nor for Educational Purposes; it is just for Informational purposes only. The
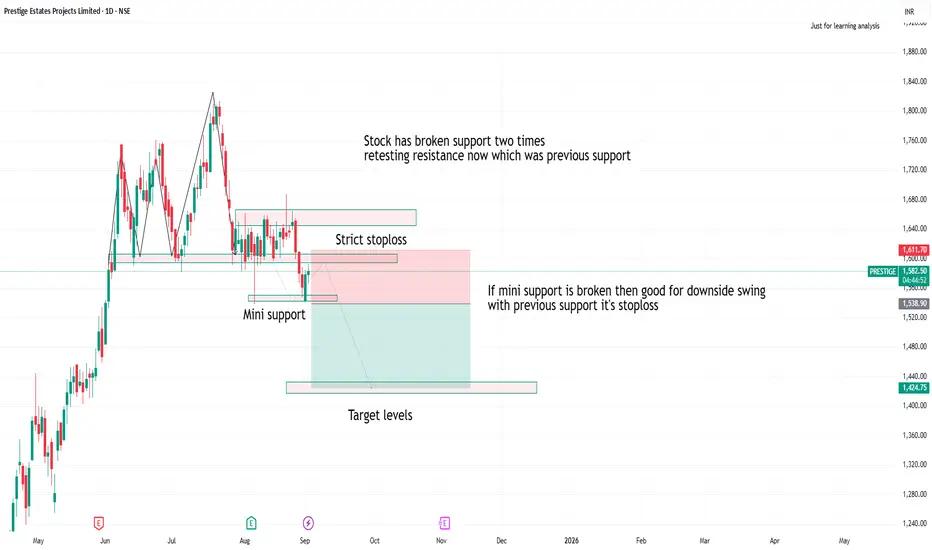
Prestige testing resitanceprestige has broken support second time
if breaks mini support levels good for downside with strict stoploss and targets
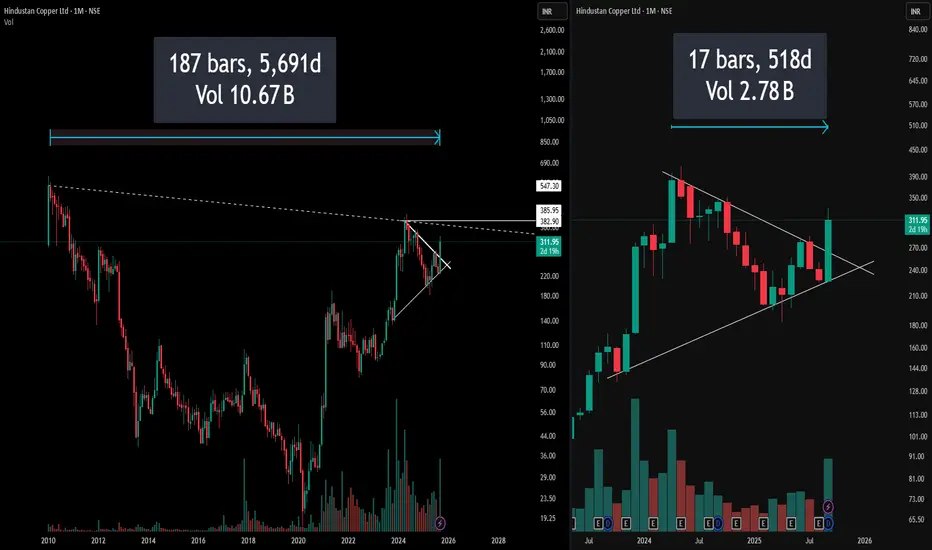
5000 Days vs 500 Days of Data : Which is better ?Most traders jump straight into attractive chart patterns and impulsively take trades, ignoring the bigger picture. Here’s a powerful case study
Left Side: Full Monthly Chart with Hidden Resistance
On the left, the chart captures over a decade of price action, immediately drawing attention to a lo
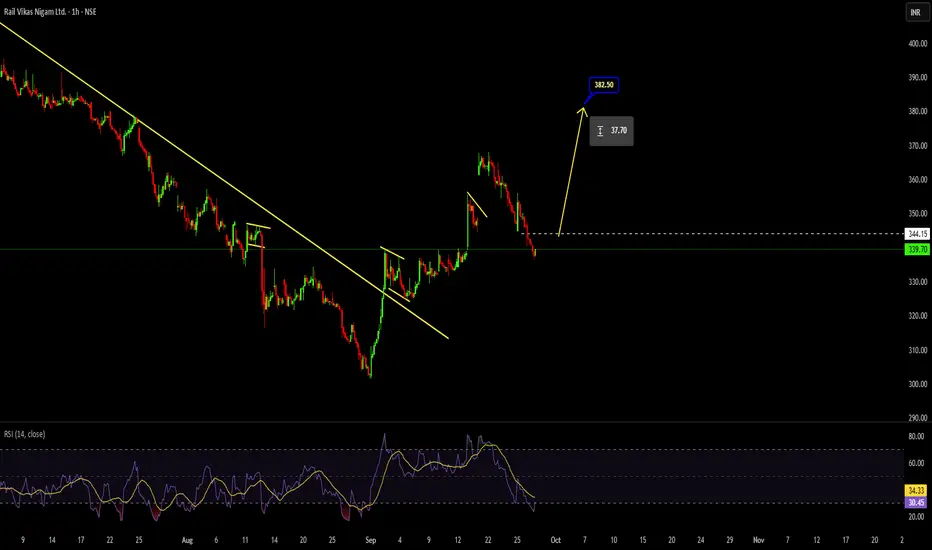
Buy set up Using RSI When we want to enter any Trade we Go to lower time frame of 1 Hour
We take the note of RSI which has made low below 25 and then reverse
then we will wait for price to close 3 Candle high prior to it , Then we enter
we will ride until the Momentum starts dropping when RSI hints of divergence
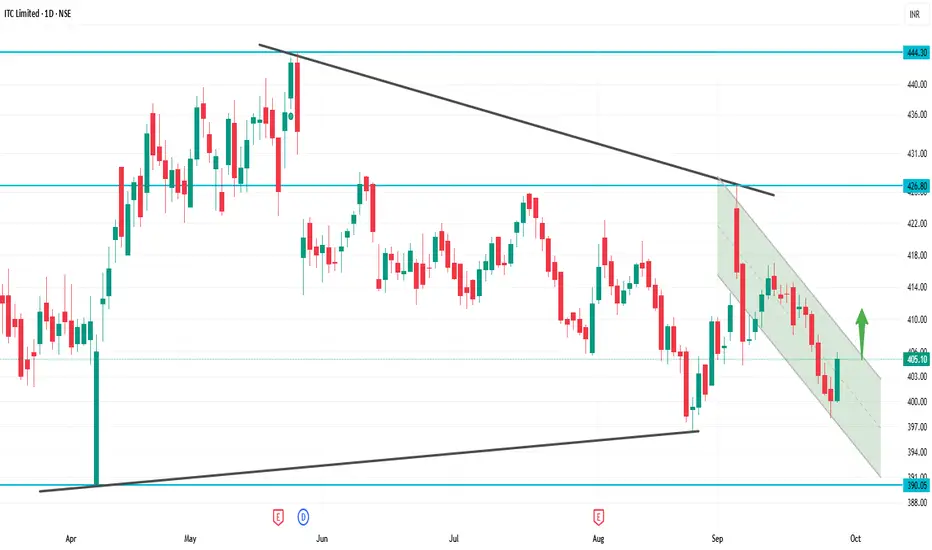
ITC 1D Time frame📊 Updated Snapshot
Current Price: ~₹405
Day Range: ₹402 – ₹410
52-Week High: ₹499
52-Week Low: ₹399
📈 Technical Outlook
Support Zones:
Strong support at ₹405 (current zone)
Next support at ₹398
Resistance Zones:
Immediate resistance at ₹410–₹416
Next resistance at ₹421
Trend Bias: Weak b
TITAN📊 Key Support & Resistance Levels
Resistance Levels:
R1: ₹3,432.14
R2: ₹3,563.29
R3: ₹3,616.93
Support Levels:
S1: ₹3,344.13
S2: ₹3,286.27
S3: ₹3,245.23
The stock is currently near its support zone, suggesting a potential for a short-term rebound if buying interest increases.
Technical Ind

large EMS sector companieshere you can see sector is going to make a breakout i think and some stocks are already out performing this sector as compare to this sectoral index which i have created

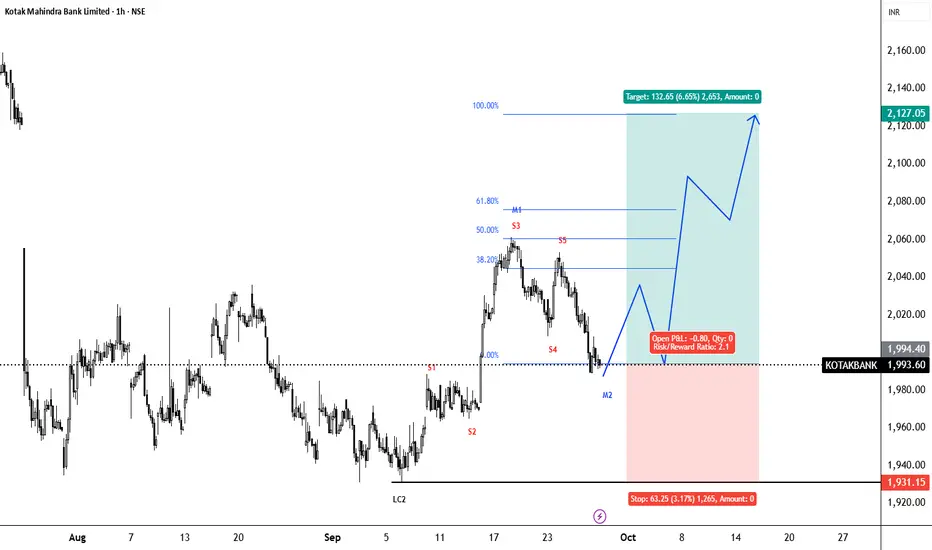
Kotak Mahindra Bank Neowave Trading IdeaNamaskaram Everyone
I trade using Neowave and on that I have created an trading setup, which is kind of automatic entry and exit with Neowave.
Neowave is kind of a method in which you synchronize all the price action across all the time frames. It hides all the noise and tells you market is bulli
See all stocks ideas
Oct 8
AVANTELAvantel Limited
Actual
—
Estimate
—
Oct 8
JTLINDJTL Industries Limited
Actual
—
Estimate
—
Oct 8
PLASTIBLENPlastiblends India Limited
Actual
—
Estimate
—
Oct 9
IREDAIndian Renewable Energy Development Agency Ltd.
Actual
—
Estimate
—
Oct 9
HCLTECHHCL Technologies Limited
Actual
—
Estimate
15.56
INR
Oct 9
GMBREWG.M. Breweries Ltd.
Actual
—
Estimate
—
Oct 9
ANANDRATHIAnand Rathi Wealth Ltd.
Actual
—
Estimate
—
Oct 9
TCSTata Consultancy Services Limited
Actual
—
Estimate
34.55
INR
See more events
Community trends
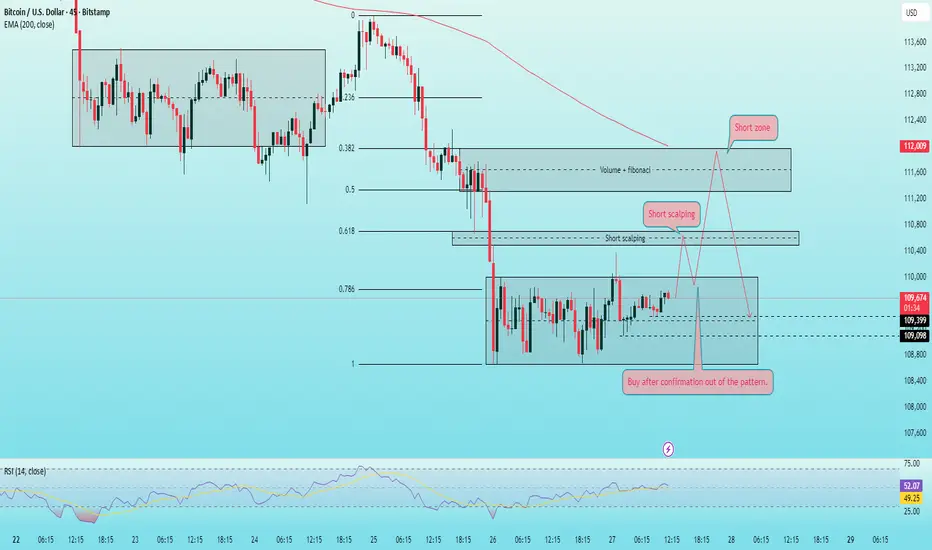
Bitcoin – Short-Term Trading Setup for the Weekend
Technical Outlook
On the 45m chart, BTC has been consolidating in a rectangular range, showing a phase of accumulation before the next breakout. A decisive move outside this zone will confirm the short-term trend direction.
Recent lows suggest selling pressure is not very strong, increasing the p
BTCUSD – Getting “dragged down” by $22B optionsBitcoin just slipped below 110K, right when the market is staring at a massive $22 billion options expiry. In simple words: the pressure is sky-high, and BTC is struggling to catch a breath.
On the H4 chart, price is still trapped inside a falling channel. The 110,675 USD zone now acts like a ceili

BITCOIN CRASH PREDICTIONAs per the chart pattern of Bitcoin USD Chart, there is a possibility of a downtrend and crash in bitcoin till 80k levels as major order blocks are pending on Daily / Weekly / Monthly charts. With a stop loss of 118234, a short position can be initiated for a target of 107000 short term of 2 weeks a

BTCUSD – Short-term Down Channel...BTCUSD – Short-term Down Channel, Accumulation Before a Potential Rally
Hello traders,
On the H4 timeframe, BTC is currently moving within a short-term descending channel. After touching a strong support level, selling pressure has started to weaken. However, the 107.4k zone has not yet been retes

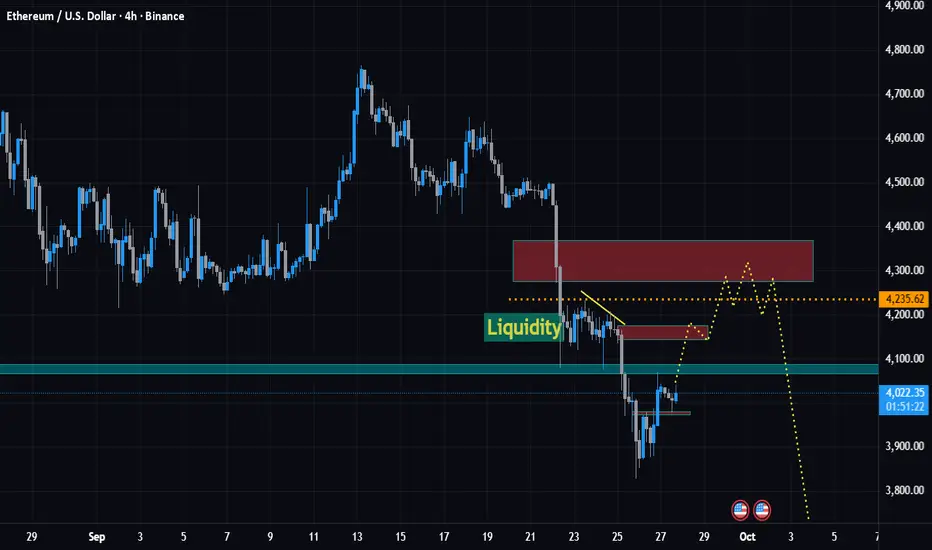
ETHUSDT SELL SETUP – 4H Time Frame AnalysisETHUSDT is currently respecting a clear downtrend on the 4H chart, fully aligned with the Daily Breaker Block rejection near 4100.
After the sharp rejection, price action suggests a possible retracement move back into the premium levels before continuation to the downside.
Key Levels to Watch
Liquid
Bull Takeing Charge on BTC after long ConsolidationBITSTAMP:BTCUSD ready to move up, Hold on tight Good Consolidtion

BTCUSDT Daily & 1H Analysis: Potential Surge to $100K & Scalping🌹🌹Daily Chart: We’re observing the completion of wave ‘c’ in an ABC pattern. This suggests a potential price surge towards $100,000, marking the end of wave ‘c’ and aligning with our drawn channel’s lower boundary.
1-Hour Chart: The market has been consolidating within a tight range, typical for lo

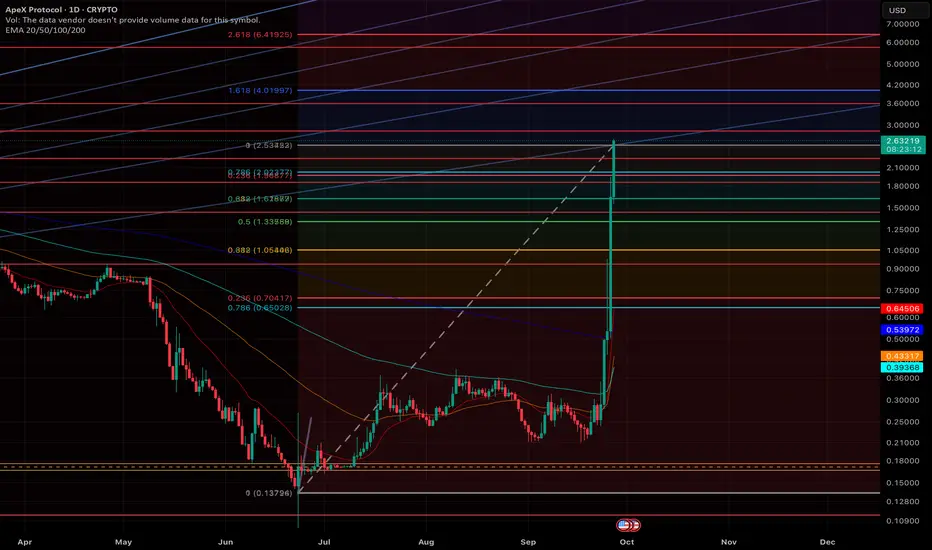
APEXUSDT - MEXC - Daily ChartA tonne of upside, Fib levels have been marked that convey key SR zones
XAUT/USDT – Gold LTF (1H) Analysis
BYBIT:XAUTUSDT
Gold is showing strength after consolidating within the mid-range. On the lower timeframe, price has respected the demand zone and pushed into premium levels, reclaiming liquidity.
Current Zone: Trading around $3,766–$3,778 with a clear push toward the $3,800 resistance.
Fib L

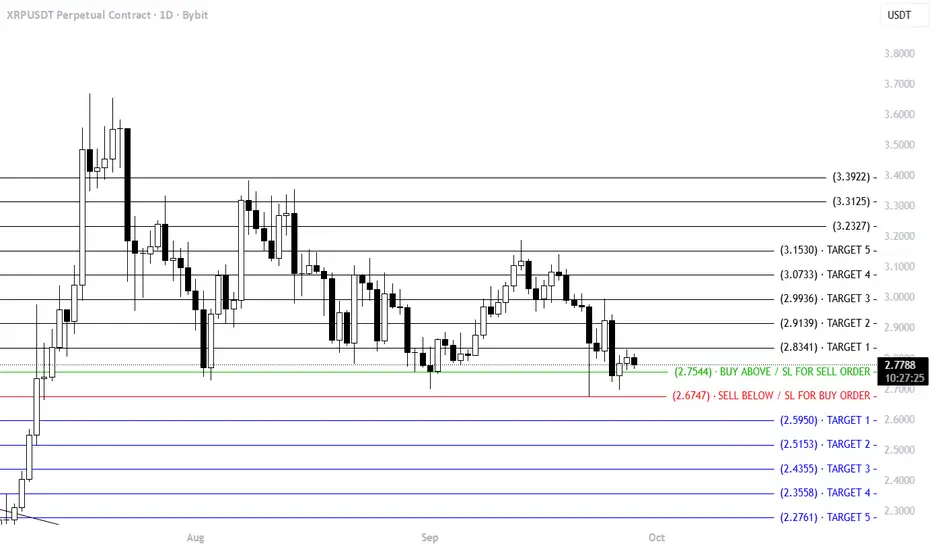
Trading Levels for XRPUSDTrading Levels for XRPUSD
Anyone can Trade on both sides (as per levels
Levels shared on chart
See all crypto ideas
XAUUSD: PCE signals strengthen bullish momentumHello traders, let’s take a quick look at XAUUSD today.
The US Core PCE index for this month is projected at just 0.2%, lower than the previous 0.3%. This points to cooling inflation, which reduces the pressure on the Fed to hike rates further. And when rate hike expectations ease, gold usually ben

XAUUSD – New Week Scenario on D1 FrameXAUUSD – New Week Scenario on D1 Frame: Prioritise buying, the 3790 – 3720 zone decides the trend
Hello Trader,
Trading is a journey, and the most important destination is conquering oneself.
On the D1 frame, gold has experienced a series of consecutive strong increases, indicating that buyers st

XAUUSD – Need confirmation before placing orders
Hello everyone,
Last week, gold experienced a strong surge, but after hitting the resistance at 378x, a noticeable selling pressure emerged, causing the price to drop and the weekly candle to close in a corrective direction. This indicates a market sentiment of hesitation, especially for those tr

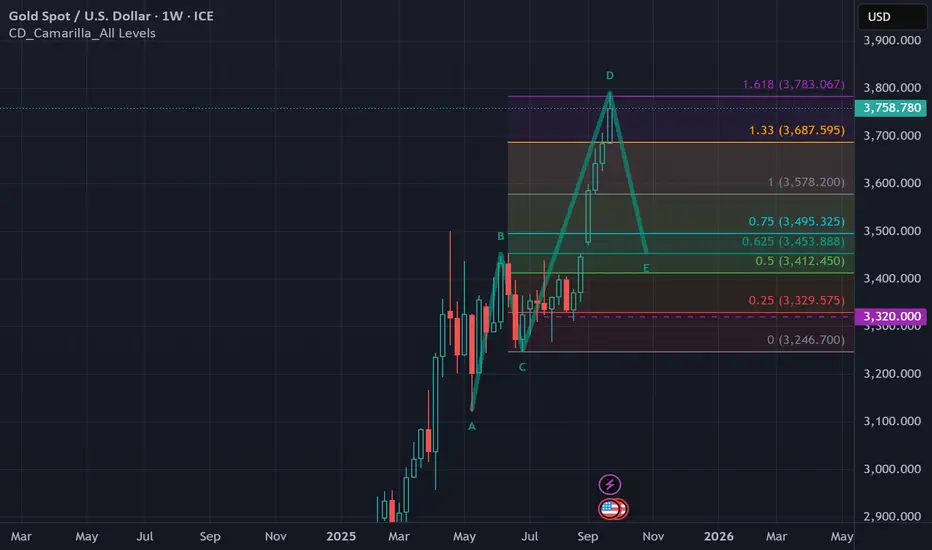
XAU - 1.618 level on 2 week swing chartInteresting to note that we have started to pull back on the 1.618 extension of the previous move on the 2 week swing chart. Only time will tell if we pull back to the 50% or even pull back to the exhaust gap.
Copper mcx continuesly buy recommended 950-960 target hitCopper updated levels given on chart, copper continuesly buying recommended our positional target 950-960 hit next 1020-1050 , next bull run will come on copper
How My Harmonic pattern projection Indicator work is explained below :
Recent High or Low :
D-0% is our recent low or high
Profit bo

XAUUSD/GOLD WEEKLY BUY PROJECTION 28.09.25XAUUSD/Gold Weekly Buy Projection (27.09.25). Here’s a breakdown of what it shows:
Current Price Level: Around 3,759.85.
Technical Zones Marked:
Broke the Uptrend Line (earlier support turned resistance).
Bearish Engulfing Failed (bullish strength seen).
Fair Value Gap (FVG) near 3,740–3,750 zo

LiamTrading – Medium-term Gold Outlook H4Let's prepare the scenario for the new week, folks!
In my opinion, gold in the coming week may start to show a medium-term correction phase. However, it is important to note that nothing is absolutely certain on a larger timeframe. If you are trading intraday, stay closely aligned with price action

Gold awaits PCE | EMA squeeze, big waves ahead🟡 XAU/USD – 26/09 | Captain Vincent ⚓
🔎 Captain’s Log – Context & News
Trump : Announced a 100% tariff on branded drugs if not produced in the US → escalating trade tensions.
PCE tonight : The FED’s most important inflation gauge, key to shaping October rate cut expectations (current probabil

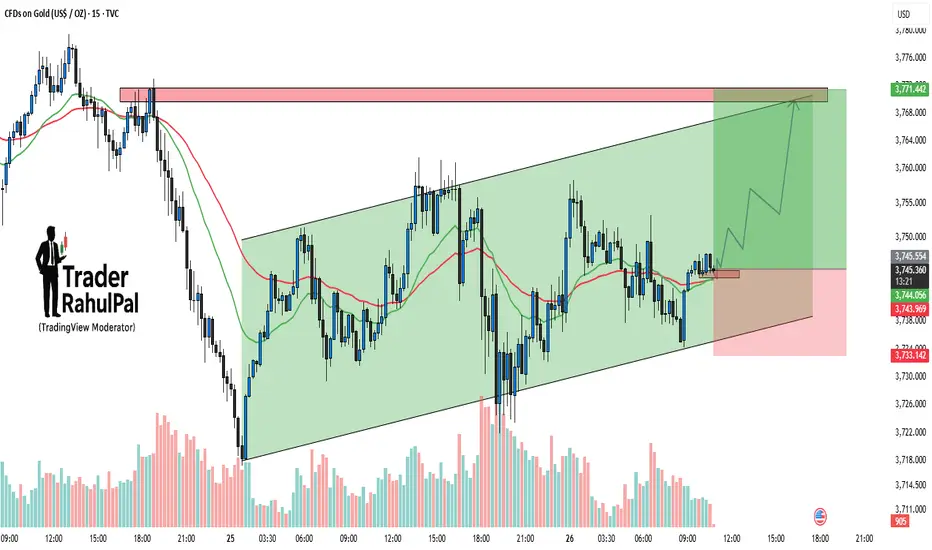
Gold – Channel Support Holding, Upside Target Towards 3770Gold is trading within a well-defined ascending channel on the 15-min chart. Price action has repeatedly respected both support and resistance lines, which makes this pattern highly reliable in the short term. Currently, the price is bouncing from the lower channel support and holding firmly above t
XAUUSD SHOWING A GOOD UP MOVE WITH 1:10 RISK REWARD GOLD SHOWING A GOOD UP MOVE WITH 1:10 RISK REWARD
DUE TO THESE REASON
A. its following a rectangle pattern that stocked the market
which preventing the market to move any one direction now it trying to break the strong resistant lable
B. after the break of this rectangle it will boost the market

See all futures ideas
EURUSD MULTI TIME FRAME ANALYSISHello traders , here is the full multi time frame analysis for this pair, let me know in the comment section below if you have any questions , the entry will be taken only if all rules of the strategies will be satisfied. wait for more price action to develop before taking any position. I suggest yo

EUR/USD: Strong Bullish SignalsEUR/USD is currently in an uptrend, with support at 1.1645 USD. If the price retraces and forms a rejection candle at this support level, it could present an opportunity to buy. The first target to the upside is the 1.1789–1.1802 USD range. If this level is broken, EUR/USD could continue rising towa

EURUSD – Bearish Channel Continuation on H1EURUSD – Bearish Channel Continuation on H1
Market Overview
EURUSD continues to move steadily within a descending channel, confirming a bearish market structure. Recent recovery attempts have been capped at supply zones, while liquidity remains concentrated at lower price levels. As long as the pai

AUDNZD Trading Idea – Momentum & Liquidity OutlookThe pair has been in a clear expansion phase, showing strength after multiple structure breaks. Momentum has favored the upside, while recent consolidation reflects market participants taking profits and rebalancing orders.
A corrective wave appears to be unfolding, which is typical after strong im

USDJPY TRADE || M15 SETUPPrice aggressively retraced after a sharp bullish rally, sweeping equal lows and tapping into a refined demand zone. Now showing a bullish reaction from the zone with clean imbalance above acting as draw on liquidity.
🔹 Key Notes:
– Liquidity grab below short-term low ✅
– Demand zone tapped + bulli

USDJPY (Neowave Trading Idea)FX:USDJPY Namaskaram Everyone
Welcome to intelligent investor, we provide market insights by synchronising and combining all the price action waves from different time frames and gives you single trend.
Now Risk Reward is highly favourable
Trading with risk management, that is 1 percent rule

Ote Refinement trade setup for currency .hoping for a long entry set up . after taking out the inducement and fvg associated with the bos .

GBPJPY Short setupI see the good risk/reward ratio sell setup in GBPJPY as per elliot wave analysis. elliot wave analysis is very complex analysis method and it aways have alternate count, how ever i shorting GBPJPY as it gives good risk/reward ratio.


Buy Trade - EUR/USDGreetings to everyone!
You can place a buy trade on EUR/USD and check out my chart for the ideal entry, stop-loss & target placement.
Remember :-
* Move your SL to breakeven once the trade reaches 1:1 R.
* Aim for a minimum reward of 1:1.5 R.
* Don't risk more than 3% of your total margin.

See all forex ideas
| - | - | - | - | - | - | - | - | ||
| - | - | - | - | - | - | - | - | ||
| - | - | - | - | - | - | - | - | ||
| - | - | - | - | - | - | - | - | ||
| - | - | - | - | - | - | - | - | ||
| - | - | - | - | - | - | - | - | ||
| - | - | - | - | - | - | - | - | ||
| - | - | - | - | - | - | - | - | ||
| - | - | - | - | - | - | - | - |
Trade directly on the supercharts through our supported, fully-verified and user-reviewed brokers.


