Apollo Tyre - SMC AnalysisTechnical Analysis (SMC Method)
Even it is formed bullish choch and trendline breakout in the weekly timeframe, it has to break the crucial resistance zone in daily timeframe (between 488 & 500) for confirmation. Once it's broken in daily timeframe the estimate target price will be 535/540.
== ED

The best trades require research, then commitment.
Get started for free$0 forever, no credit card needed

Scott "Kidd" PoteetThe unlikely astronaut

Where the world does markets
Join 100 million traders and investors taking the future into their own hands.
Major indices

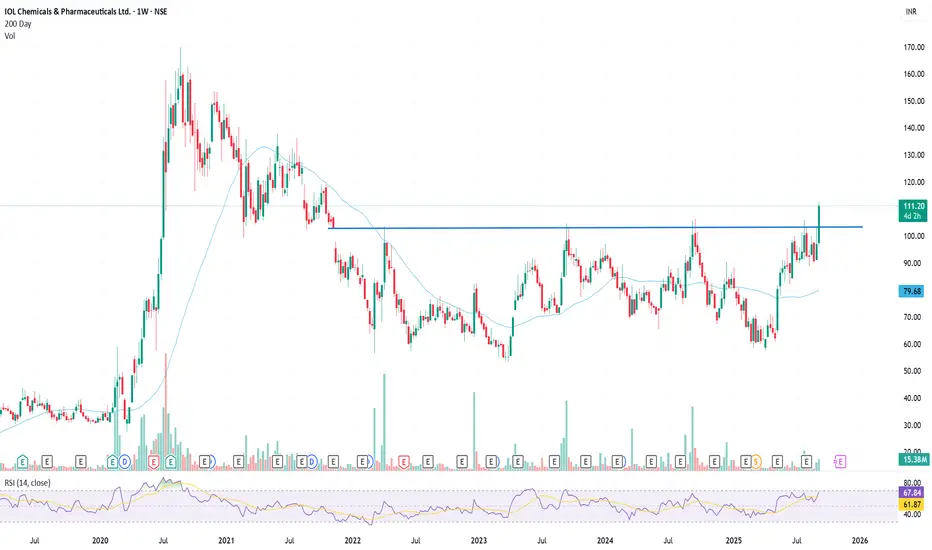
Finally the breakout is done or has it not?Stock has been in long consolidation phase with ibu and para prices making lower lows since over stocking post covid. With the new initiative taken by management and prudent cash allocation from covid times, the volumes speak of more than what the PAT showcases.
Technically on weekly charts on the f
Lupin LtdDate 08.09.2025
Lupin
Timeframe : Weekly Chart
Brands
(1) Lupin Life
(2) Lupin Diagnostics
(3) Life Atharv Ability
(4) SciFlix
(5) Humrahi
(6) Pharmarack
Leadership
(1) Respiratory
(2) Diabetes Care
(3) Cardiac Care
Lupin has partnered with Amman Pharma for exclusive marketing and
commercializ

URJA a worthy penny stock??? detailed analysis - education only!short term speculative trade? - educational purpose
in the past the stock after touching longterm trendline bounces significantly
personally I'm allocation 1-2.5% of my total capital into this speculative trade with 50%+ sl
Momentum in Fundamentals:
FY24 saw total revenue grow from ₹39.58 Cr in FY

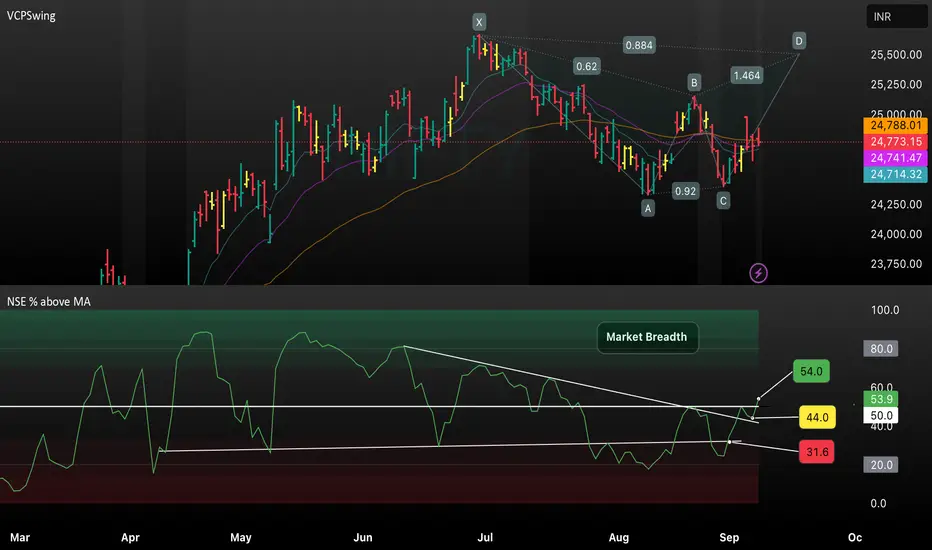
Market Breadth Breakout – Tracking NSE MomentumThis TradingView chart analyzes the NSE Index with a focus on market breadth, highlighting the percentage of stocks above their moving averages. The chart showcases a recent breakout above key breadth levels (44.0 and 50.0), signaling improving momentum and a potential trend reversal. Visual trendli
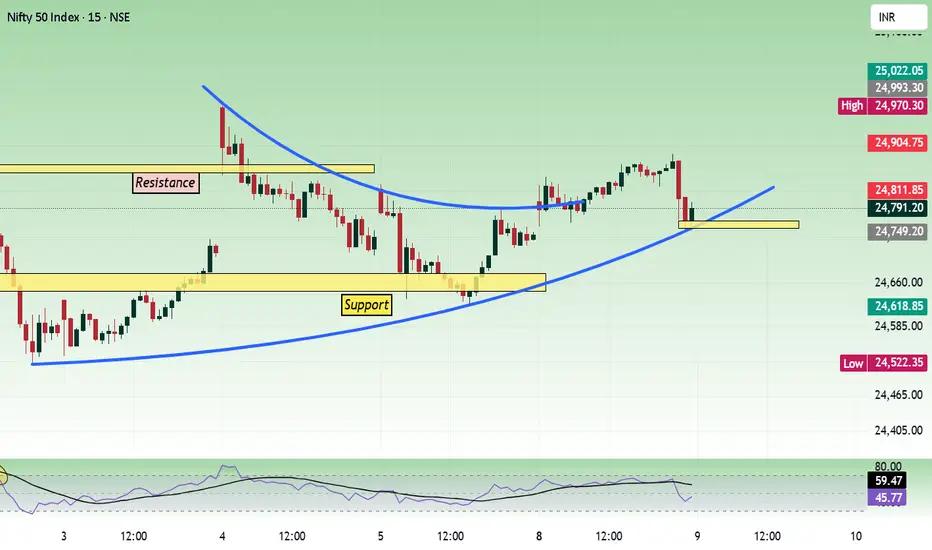
Nifty - Multi time frame analysis Sep 9Today, the price did not gain strength and moved in the range of 24700 to 24900. And 25000 is a psychological level. This type of nearby support/resistance can give choppy movement unless the price shows strength from the opening.
Support levels are 24500, 24600. Resistance levels are 24900, 25000.
Bullish Iron Condor on Nifty (30th September 2025 expiry)Hello Traders!
Just like we shared the August Iron Condor setup, here comes the fresh plan for September expiry.
Nifty is trading around 24,840 and we are witnessing a defined range between 23,750 – 25,500.
Such ranges are perfect for premium eating strategies like the Iron Condor, where ti

COALINDIA-buy for 10 % move bullish points visible on Coal India Ltd (NSE: COALINDIA) 4H chart:
1. Breakout and Retest
Price broke out above a consolidation zone (marked as 1. breakout).
It later came back and successfully retested the breakout level (point 2), confirming it as support.
2. Positive Divergence
The RSI sho

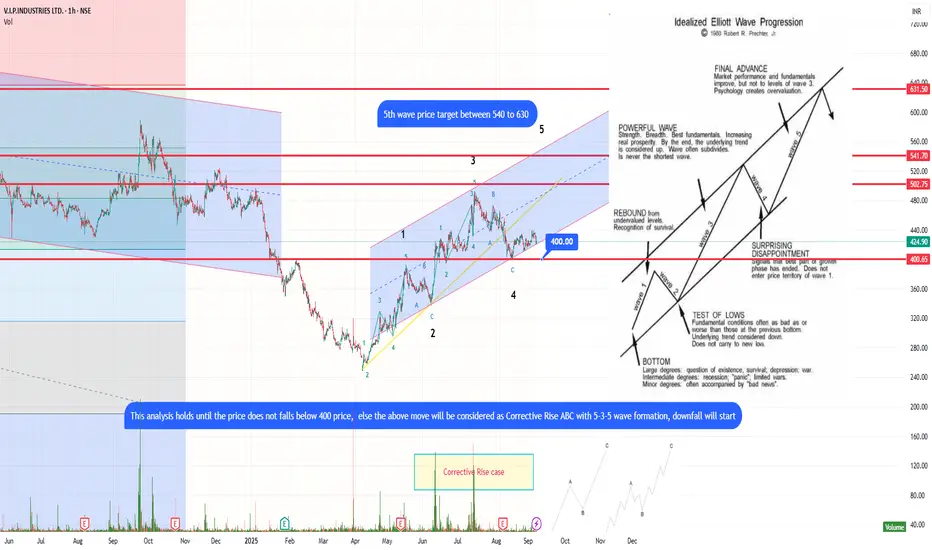
VIPIND UPMOVE Classic Elliott wave VIPIND UPMOVE Classic Elliott wave
Idealised Elliott wave in progression Wave 4 completed, 5th wave projected target between 540 to 630 price.
This analysis holds valid till price does not fall below price 400, else the move will be considered as corrective rise ABC with 5-3-5 wave formation, furth
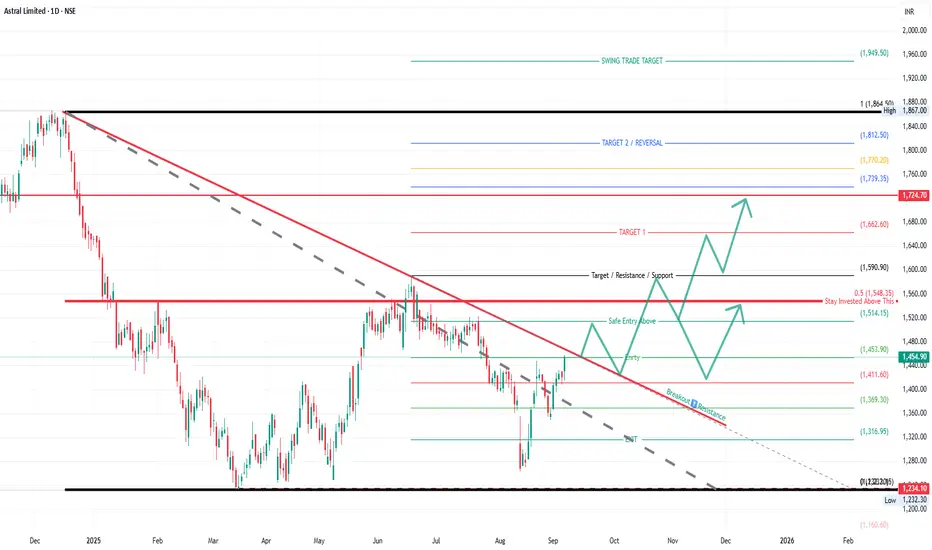
Astral Ltd – Trendline Breakout & Upside TargetsAstral Ltd has broken out of a long-term falling trendline, indicating a potential shift from bearish to bullish momentum. Price is trading above the safe entry level of ₹1,453 and holding strong. Sustaining above ₹1,514 may confirm further upside targets.
📌 Key Technical Highlights:
Pattern: Down
See all editors' picks ideas
VWAP Price ChannelVWAP Price Channel cuts the crust off of a traditional price channel (Donchian Channel) by anchoring VWAPs at the highs and lows. By doing this, the flat levels, characteristic of traditional Donchian Channels, are no more!
Author's Note: This indicator is formed with no inherent use, and serves

Fibonacci Sequence Circles [BigBeluga]🔵 Overview
The Fibonacci Sequence Circles is a unique and visually intuitive indicator designed for the TradingView platform. It combines the principles of the Fibonacci sequence with geometric circles to help traders identify potential support and resistance levels, as well as price expansio

ATAI Volume Pressure Analyzer V 1.0 — Pure Up/DownATAI Volume Pressure Analyzer V 1.0 — Pure Up/Down
Overview
Volume is a foundational tool for understanding the supply–demand balance. Classic charts show only total volume and don’t tell us what portion came from buying (Up) versus selling (Down). The ATAI Volume Pressure Analyzer fills that g

Market Cap Landscape 3DHello, traders and creators! 👋
Market Cap Landscape 3D. This project is more than just a typical technical analysis tool; it's an exploration into what's possible when code meets artistry on the financial charts. It's a demonstration of how we can transcend flat, two-dimensional lines and step into

ZigzagLiteLibrary "ZigzagLite"
Lighter version of the Zigzag Library. Without indicators and sub-component divisions
method getPrices(pivots)
Gets the array of prices from array of Pivots
Namespace types: Pivot
Parameters:
pivots (Pivot ) : array array of Pivot objects
Returns: array array

ZigzagLibrary "Zigzag"
Zigzag related user defined types. Depends on DrawingTypes library for basic types
method tostring(this, sortKeys, sortOrder, includeKeys)
Converts ZigzagTypes/Pivot object to string representation
Namespace types: Pivot
Parameters:
this (Pivot) : ZigzagTypes/Pivot

Angled Volume Profile [Trendoscope]Volume profile is useful tool to understand the demand and supply zones on horizontal level. But, what if you want to measure the volume levels over trend line? In trending markets, the feature to measure volume over angled levels can be very useful for traders who use these measures. Here is an att

MathEasingFunctionsLibrary "MathEasingFunctions"
A collection of Easing functions.
Easing functions are commonly used for smoothing actions over time, They are used to smooth out the sharp edges
of a function and make it more pleasing to the eye, like for example the motion of a object through time.
Easing function

Treasury Yields Heatmap [By MUQWISHI]▋ INTRODUCTION :
The “Treasury Yields Heatmap” generates a dynamic heat map table, showing treasury yield bond values corresponding with dates. In the last column, it presents the status of the yield curve, discerning whether it’s in a normal, flat, or inverted configuration, which determined by us

Time & Sales (Tape) [By MUQWISHI]▋ INTRODUCTION :
The “Time and Sales” (Tape) indicator generates trade data, including time, direction, price, and volume for each executed trade on an exchange. This information is typically delivered in real-time on a tick-by-tick basis or lower timeframe, providing insights into the traded size

See all indicators and strategies
Community trends
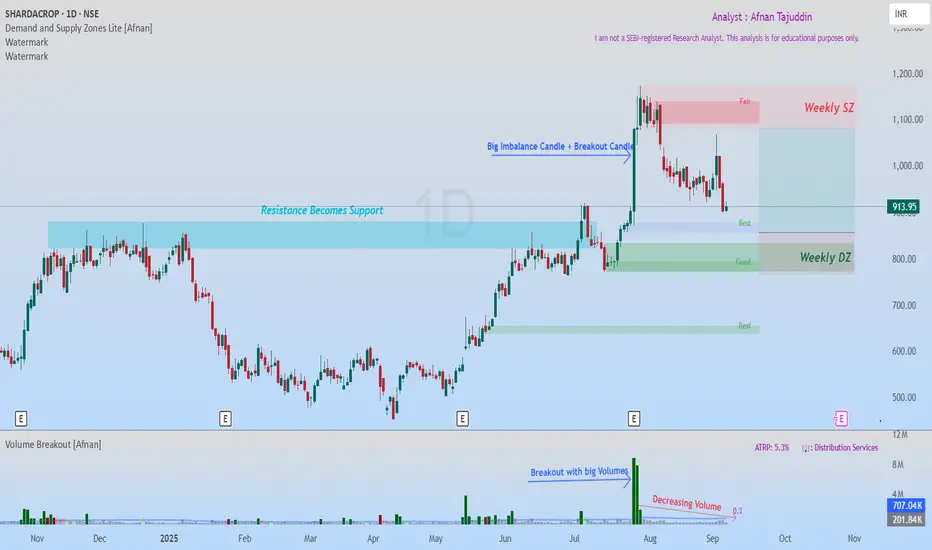
SHARDACROP: Smart Money Demand Zones Align with Classic BreakoutI've been tracking SHARDACROP, and what I'm seeing is honestly one of those setups that doesn't come around too often. There's something brewing here that caught my attention—and it's not just one signal, but two completely different analytical approaches pointing to the exact same conclusion.
Toda
COALINDIA-buy for 10 % move bullish points visible on Coal India Ltd (NSE: COALINDIA) 4H chart:
1. Breakout and Retest
Price broke out above a consolidation zone (marked as 1. breakout).
It later came back and successfully retested the breakout level (point 2), confirming it as support.
2. Positive Divergence
The RSI sho
Buy, Sell, or Skip? Backtesting Charts with Bar Replay!Using TradingView’s Bar Replay, I break down an old chart and reveal the exact logic behind whether it was a buy, sell, or skip trade. Perfect for traders who want to sharpen entry-decisions with real market context.

VIPIND UPMOVE Classic Elliott wave VIPIND UPMOVE Classic Elliott wave
Idealised Elliott wave in progression Wave 4 completed, 5th wave projected target between 540 to 630 price.
This analysis holds valid till price does not fall below price 400, else the move will be considered as corrective rise ABC with 5-3-5 wave formation, furth
BUY TODAY SELL TOMORROW for 5%DON’T HAVE TIME TO MANAGE YOUR TRADES?
- Take BTST trades at 3:25 pm every day
- Try to exit by taking 4-7% profit of each trade
- SL can also be maintained as closing below the low of the breakout candle
Now, why do I prefer BTST over swing trades? The primary reason is that I have observed that

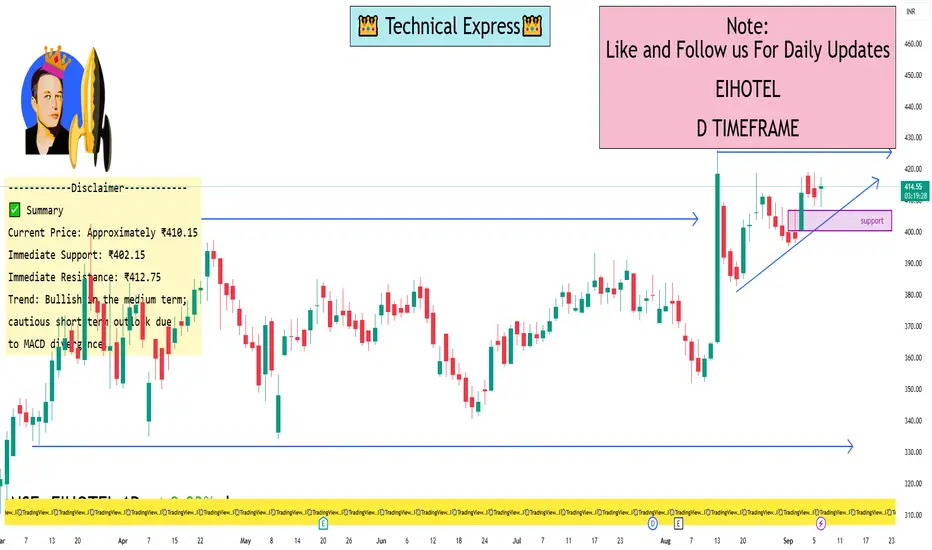
EIHOTEL 1 Day View📈 Daily Support & Resistance Levels
Based on recent data, here are the critical levels:
Support Levels:
S1: ₹402.15
S2: ₹396.05
S3: ₹388.93
Resistance Levels:
R1: ₹412.75
R2: ₹417.25
R3: ₹423.35
These levels are derived from standard pivot point calculations and provide insight into potent
URJA a worthy penny stock??? detailed analysis - education only!short term speculative trade? - educational purpose
in the past the stock after touching longterm trendline bounces significantly
personally I'm allocation 1-2.5% of my total capital into this speculative trade with 50%+ sl
Momentum in Fundamentals:
FY24 saw total revenue grow from ₹39.58 Cr in FY
Apollo Tyre - SMC AnalysisTechnical Analysis (SMC Method)
Even it is formed bullish choch and trendline breakout in the weekly timeframe, it has to break the crucial resistance zone in daily timeframe (between 488 & 500) for confirmation. Once it's broken in daily timeframe the estimate target price will be 535/540.
== ED
Lupin LtdDate 08.09.2025
Lupin
Timeframe : Weekly Chart
Brands
(1) Lupin Life
(2) Lupin Diagnostics
(3) Life Atharv Ability
(4) SciFlix
(5) Humrahi
(6) Pharmarack
Leadership
(1) Respiratory
(2) Diabetes Care
(3) Cardiac Care
Lupin has partnered with Amman Pharma for exclusive marketing and
commercializ
Finally the breakout is done or has it not?Stock has been in long consolidation phase with ibu and para prices making lower lows since over stocking post covid. With the new initiative taken by management and prudent cash allocation from covid times, the volumes speak of more than what the PAT showcases.
Technically on weekly charts on the f
See all stocks ideas
No scheduled reports
Community trends
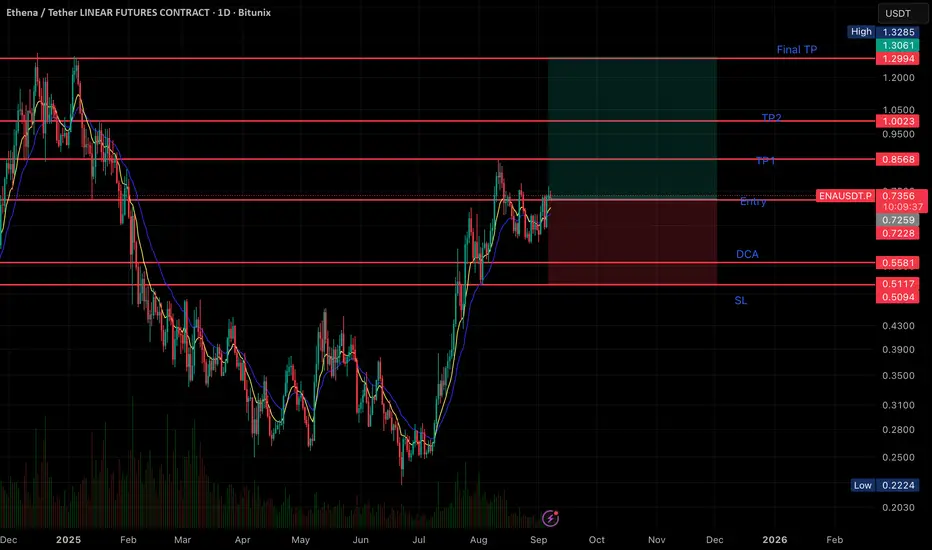
ENA Long Set Up swing or spot only🔹 Chart Setup
• Current Price: 0.7341 USDT
• Trend: Price has been recovering strongly after a bottom in June and is consolidating around the entry zone.
🔹 Key Levels
• Entry Zone: ~0.7341 USDT (current price is at entry).
• DCA (Dollar-Cost Average) Levels:
• 0.7229
• 0.6580
• 0.6082
• 0.5
Btc sell Btc sell here
Because the Market goes up i conferm
This is counter trade
This short selling move is a trap
But hum trend ke against bhi market pakadte hai

Bitcoin – Short-Term Trend ScenarioBitcoin – Short-Term Trend Scenario
Hello Traders,
Bitcoin is maintaining a bullish tone in the short term while still moving within a corrective structure on the medium-term horizon.
Chart Patterns
On the chart, a double-bottom formation has already completed and confirmed.
In a broader view,

sometimes You need nothing new its just a repetationEth repeted same level trade. Its just a hourly supply that identified and repeteadly played 3 times. easy pips...

H&S in the making?Watch out for the possible H&S pattern in the making on the 6H chart of $BITSTAMP:BTCUSD. If the prices don't breach $109,900 on the downside, and move back up, $113,400 would be the neckline for the breakout.

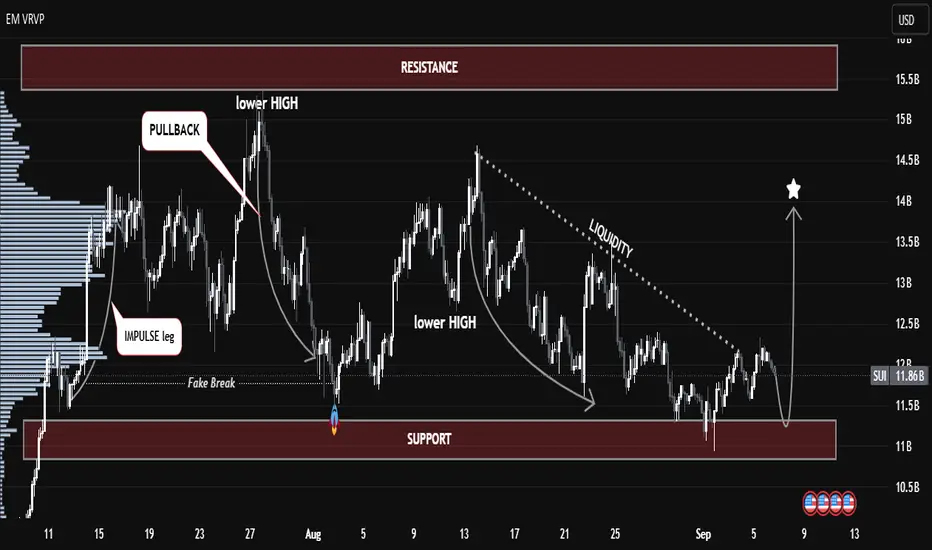
Liquidity Trap or Smart Money Play? SUI Price Poised for Big Liquidity Trap or Smart Money Play? SUI Price Poised for Big Move Ahead”
👋 Hello Traders & Investors,
Looking at SUI, the price action is showing a very interesting structure between the support zone ($11B – $11.5B) and the resistance zone ($14.5B – $15.5B). We already saw a strong impulse leg ear
Bearish Trade Setup for SOLUSDOverview:
This is a short position on SOLUSD, entering on the 1-hour chart with a well-defined risk-to-reward ratio. The trade is based on a downward trend confirmed by the price action and EMAs, making this a high-probability bearish scenario.
Key Levels and Indicators:
Entry Point: 186.6736
The

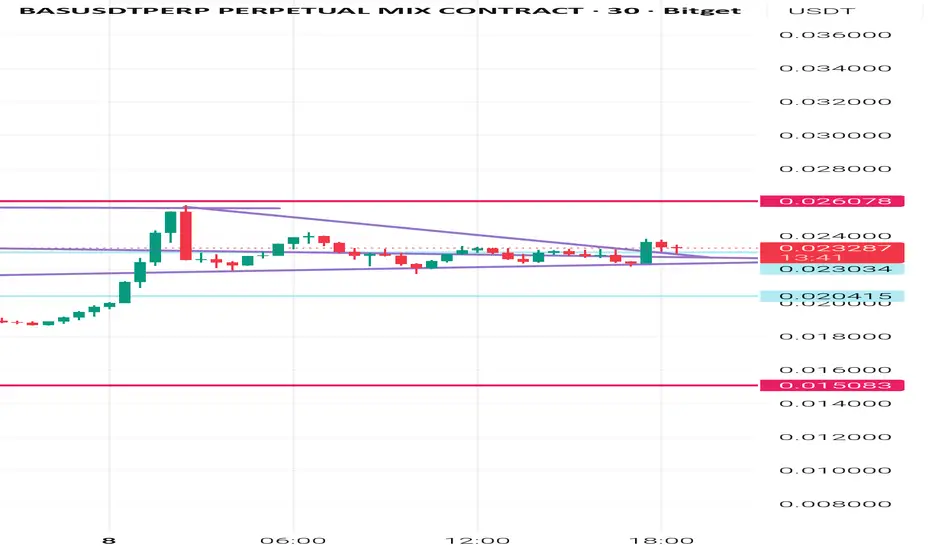
Bas ascending triangle breakBas is moving in an ascending triangle break out will make it breach the ath
Hoping for nice long trade on this my entry is 0.0230
BTCUSDAfter an extended period of sideways consolidation, BTC/USD now appears poised for an upward move. The pair is currently retesting a key support zone, and if this level continues to hold, it could serve as a strong foundation for the next bullish leg.

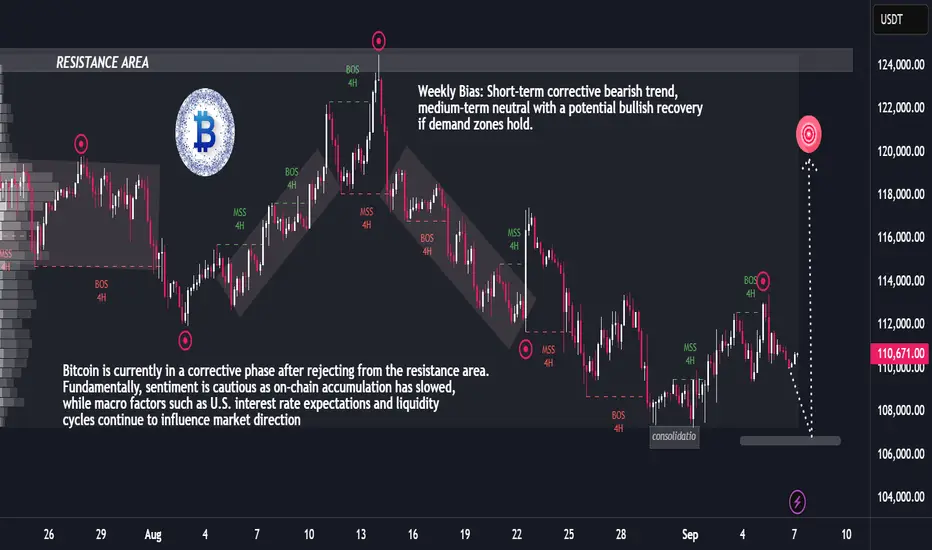
BTC Weekly Analysis: Correction Phase with Rebound PotentialBTC Weekly Analysis: Correction Phase with Rebound Potential
Weekly BTCUSDT Fundamental–Technical Report
Bitcoin has entered a consolidation-to-correction phase after failing to hold momentum above the resistance zone. From a fundamental perspective, global liquidity conditions and Fed rate expect
See all crypto ideas
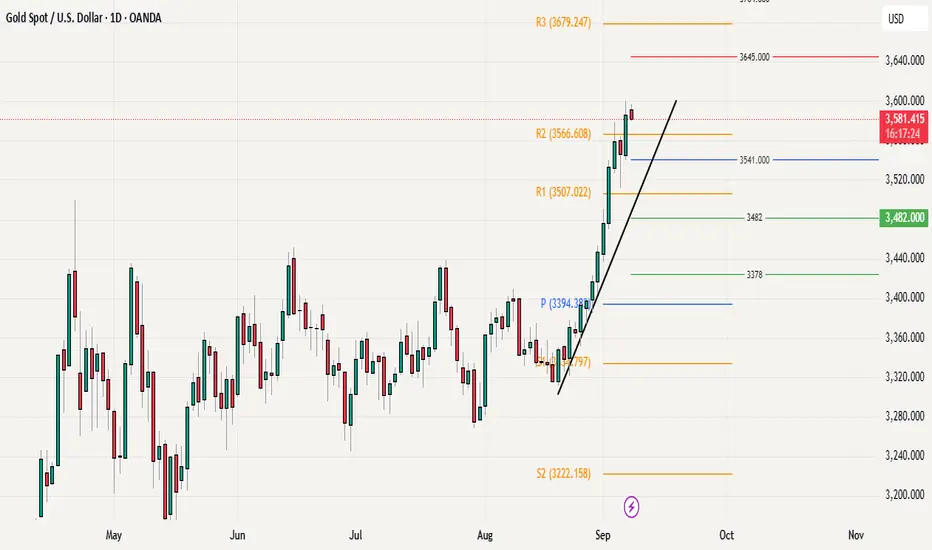
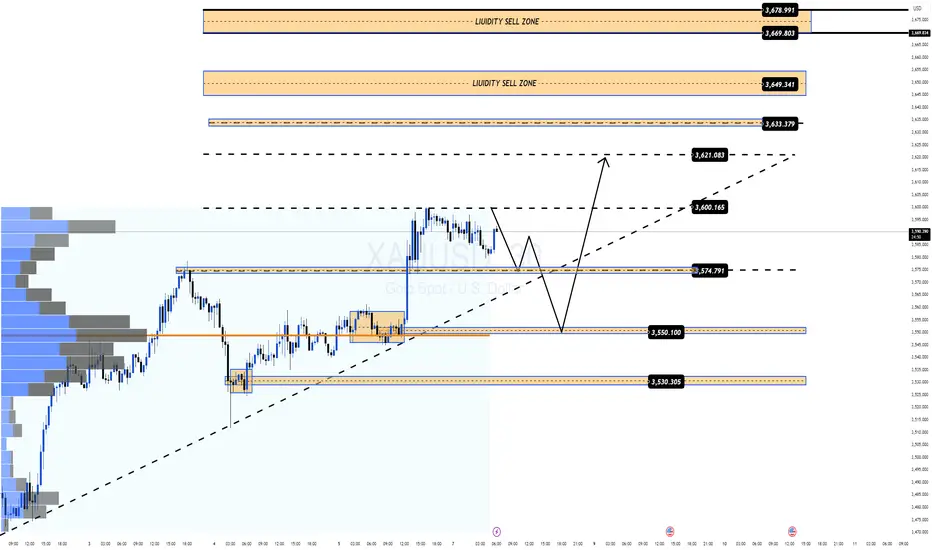
Gold Rally at Its Peak – Correction on the Horizon?Gold Rally at Its Peak – Correction on the Horizon?
Gold (XAUUSD) Technical–Fundamental Market Report
Over the past weeks, gold has shown a significant transition in market structure. After a prolonged distribution and corrective phase through late July into mid-August, price action shifted decisi

XAUUSD At Critical PRZ: Will Gold Reverse or Break to New Highs?Hello Traders And Investors
XAUUSD At Critical PRZ: Will Gold Reverse or Break to New Highs? 🔥”
The recent price action on Gold (XAUUSD) has reached a very critical level near $3,586 – $3,600, which aligns with a strong resistance zone. This area is marked as a Potential Reversal Zone (PRZ), where

Gold's historic rally continues!Market News:
In early Asian trading on Monday (September 8), spot gold prices fluctuated within a narrow range, currently trading around $3,597/oz. Influenced by exceptionally weak US non-farm payroll data, spot gold prices surged, reaching $3,600/oz in London, a record high. The market now believe

Gold Trading Strategy for 08th September 2025📊 Gold Trading Strategy (Intraday)
This is a price action–based plan for intraday traders. Please read carefully before applying it.
✅ Buy Setup (Long Position)
Condition to Enter: Buy above the high of the 1-hour candle (confirm that the candle closes bullish and price breaks above it).
Stop Loss

XAU/USD Bullish Trade Setup Buy from POI Zone towards 3668TargetXAU/USD (Gold) – 1H Analysis
✅ Trend: The market is in a clear bullish trend with higher highs & higher lows. Price is trading above both EMA 70 (3,547) and EMA 200 (3,486), confirming strong upward momentum.
📌 Key Levels:
POI Buying Zone: 3,554 – 3,576 (strong support area)
Target Point: 3,668

Gold Trading Strategy for Monday✅ After a continuous rally, gold faced resistance around 3599, with significant short-term selling pressure. The price has moved far from the MA20 (around 3547), creating a short-term deviation. Without continued volume support, there is a risk of a technical pullback. The MACD histogram is shrinkin

Elliott Wave Analysis XAUUSD – September 7, 2025
Momentum
• D1: Momentum is still declining → a corrective move may occur before turning bullish again.
• H4: Currently in the overbought zone → a main downward move is expected tomorrow.
• H1: About to enter the oversold zone → a short-term upward bounce may appear tomorrow morning.
Wave Structure

Gold Marks New ATH at 3600 – Bulls Still in ControlGold closed last week on a very strong note, posting its highest daily and weekly close and also printing a new all-time high at 3600, which now stands as an important psychological resistance Level. The overall price action structure continues to favor the bulls, with no major signs of reversal vis
XAUUSD – Weekly Trading Plan: Bulls Still in Control MMFLOW TRADING PLAN XAUUSD
Market View:
Gold (XAUUSD) is trading exactly as expected from our weekly outlook. After the big Nonfarm push near $3600/oz ATH, price is consolidating around 357x–358x while holding the rising trendline. Both Daily and Weekly charts remain bullish, showing that buyers a
xau paper trade placedjuda swing completed in asian session..now london will continue bearish ,
Asian Session Recap: Price action showed a completed swing, likely testing a key resistance zone before reversing.
London Session Setup:
Bias: Bearish continuation expected, especially if price remains below intraday resista

See all futures ideas
USD/CAD(20250908)Today's AnalysisMarket News:
Non-farm payroll growth fell significantly short of expectations, with June's data revised downward to negative territory, marking the first contraction since 2020. The unemployment rate hit a nearly four-year high.
Technical Analysis:
Today's buy/sell levels:
1.3812
Support and re

Bearish Still Valid with Dual TPsThe Sell signal was already triggerred on Wednesday 27th August with the hope that it will hit the TP1 area which is at 1.3683.
Offcourse, it retraced without hitting the required TP which is still indicating the validation of TP 1.
Now the price is availalbe at extremely discount level. A ride wi

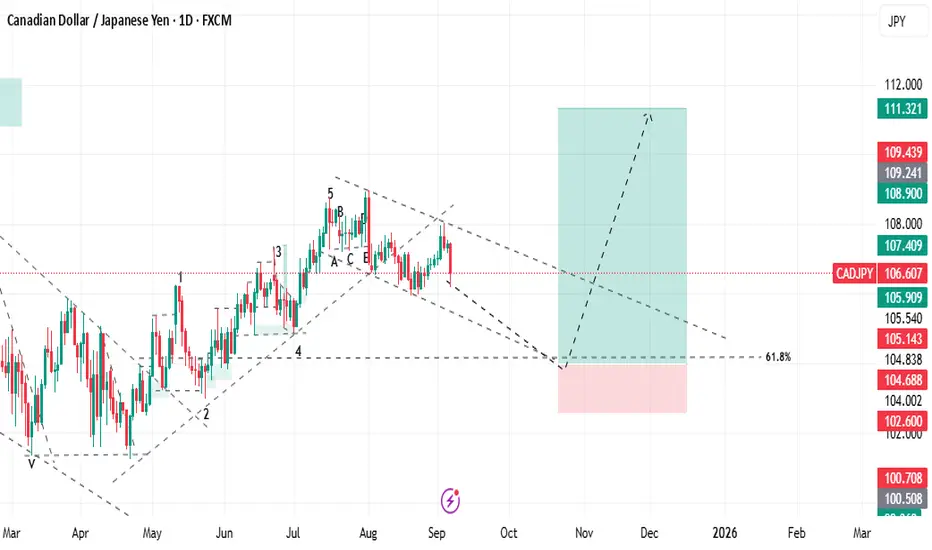
BUY CADJPY🚀 BUY CADJPY
Entry: 104.002
TP: 111.321 🎯
SL: 102.600 🛑
Bullish momentum in play — targeting higher levels! 📈
#CADJPY #ForexSignals #BuySignal #ForexTrading #PriceAction #ForexSetup #TradingSignal #ForexLife #Pips
GBP/USD Rising Wedge Breakdown PotentialThe GBP/USD 30-minute chart shows price moving within an ascending trendline but recently stalling near resistance around 1.3550–1.3560. The Ichimoku cloud suggests weakening bullish momentum, with price struggling to sustain above the support line.
Bearish Setup: A breakdown below the ascending tr

USDCHF BearishA long downward channel in USDCHF predicts a fall in USD comparing with CHF.
This pair is under pressure for so long so I am selling it for further down move.

AUDUSD-ShortAUD/USD 15m Chart Update
1️⃣ HTF Resistance
Price has reached a higher-timeframe resistance zone.
This is an important supply area where sellers may step in.
2️⃣ Bearish Order Block (OB)
A bearish order block is formed just below the resistance.
Price tapped into this OB and showed rejection with r

NZDUSD Forming a Great Sell side scenario....NZDJPY is approaching 4H resistance zone, which has already show rejection previously. There is also a steep bullish trend line creating a confluence. There is a valid 4H FVG at upside. All these things signalling a coming very good sell side opportunity. Below are points detailing the same.
1. Pri

EUR/USD Long SetupPrice consolidating after recent downside move.
Entry taken from demand zone with stop below structure and target towards recent highs.
Looking for bullish continuation as liquidity builds to the upside.
REMEMBER THIS IS A HIGH RISK TRADE(Not the best setup possible)

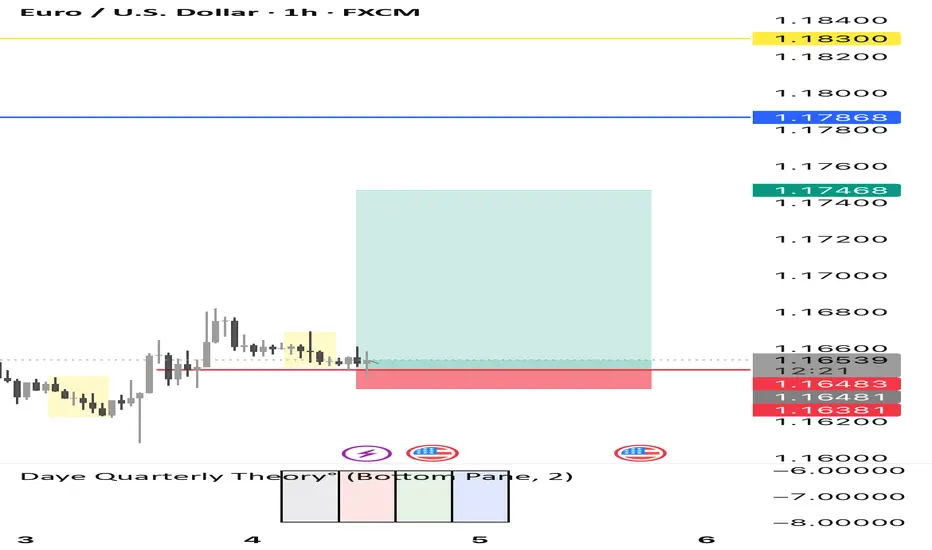
EURUSD 1H Chart – Bullish Setup✅ Support: 1.1640–1.1650
🎯 Targets: 1.1746 / 1.1786 / 1.1830
⛔ SL: Below 1.1638
Bias: Bullish as long as above support. Upside momentum may push towards 1.1830.
#Forex #Trading #EURUSD #PriceAction
BreakOut Retest Strategy Price came back to a fresh supply zone.
First candle went bullish, second candle (50% wick / 50% body) showed rejection + sellers entering.
You entered sell after confirmation.
Stop above zone, TP far below → 1:8 RR achieved.
Key: fresh zone + rejection + patience → high probability trade.
See all forex ideas
| - | - | - | - | - | - | - | - | ||
| - | - | - | - | - | - | - | - | ||
| - | - | - | - | - | - | - | - | ||
| - | - | - | - | - | - | - | - | ||
| - | - | - | - | - | - | - | - | ||
| - | - | - | - | - | - | - | - | ||
| - | - | - | - | - | - | - | - | ||
| - | - | - | - | - | - | - | - | ||
| - | - | - | - | - | - | - | - |
Trade directly on the supercharts through our supported, fully-verified and user-reviewed brokers.


