📊 Market Structure
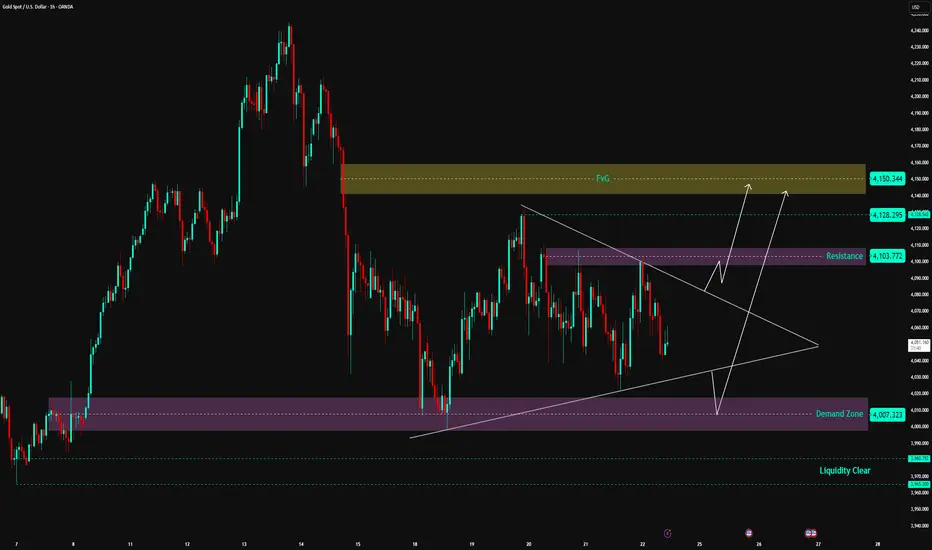
Gold is entering a tight accumulation phase within a Symmetrical Triangle pattern – indicating compression before a strong breakout.
On the downside, the price is still supported by the Demand Zone 4,007 – 4,020 USD, which is the main support area for the medium-term uptrend structure.
On the upside, the Resistance Zone 4,103 – 4,110 USD continuously exerts pressure, causing price rejection.
Currently, gold is trading right in the middle of the compression triangle → the market is preparing to choose a direction.
Looking at the wave structure, the trend slightly leans towards a break up to sweep liquidity in the high area.
💎 Key Technical Zones
• ⭐ FVG Supply Zone: 4,128 – 4,150 USD → expected strong reaction area if price breaks up
• 🟣 Resistance Zone: 4,103 – 4,110 USD → decisive area for direction
• 🟪 Demand Zone: 4,007 – 4,020 USD → strong base maintaining structure
• 🟦 Liquidity Clear: 3,980 USD → risk area if price collapses the triangle
🎯 Trading Plan – Two Possible Scenarios
1️⃣ BUY – Wait for Breakout from Triangle (priority scenario)
If the price breaks the resistance zone 4,103 – 4,110 with a strong H1 closing candle:
• Entry: 4,112 – 4,115
• SL: 4,095
• TP1: 4,128
• TP2: 4,145
• TP3: 4,150 (reach FVG)
→ This is a trend-following setup, with a high probability of sweeping liquidity above after the break.
2️⃣ BUY – Retest Demand Zone 4,007 – 4,020
If the price continues to follow the triangle pattern and falls to the trendline + demand zone:
• Entry: 4,010 – 4,017
• SL: 3,990
• TP1: 4,103
• TP2: 4,128
• TP3: 4,150
→ This is a very strong confluence area between Demand Zone + Trendline + pattern base.
❌ SELL? When is it valid?
Currently, selling is not prioritized, as the price is still above the Demand Zone and the larger structure still favors an uptrend.
Selling is only valid if the price:
• Breaks strongly below 4,007 USD
→ At this point, the market turns bearish, with a distant target of 3,980 USD.
🧠 Vincent’s View
Gold is under strong compression. When the triangle pattern is broken, the move will be extremely fast and decisive.
The current trend leans towards breaking up and heading straight into the FVG area 4,128 – 4,150 USD.
Just be patient and wait for the confirmation candle — don’t predict, react to the market.
⚡ “Breakout is born from pressure — patience profits.”
⏰ Timeframe: 1H
📅 Update: 24/11/2025
✍️ Analysis by: Captain Vincent
Join Real - Time Trade Post: t.me/+BqHHX9vgDa04ZTJl
🔥 3 - 4 DAILY TRADE
🔥 15 - 20 SCALPING SIGNALS
🔥 Real - Time Proceed Orders
🔥 3 - 4 DAILY TRADE
🔥 15 - 20 SCALPING SIGNALS
🔥 Real - Time Proceed Orders
Disclaimer
The information and publications are not meant to be, and do not constitute, financial, investment, trading, or other types of advice or recommendations supplied or endorsed by TradingView. Read more in the Terms of Use.