Bharat Dynamics Ltd – Symmetrical Triangle Breakout on Watch (D)Bharat Dynamics is currently trading near a key breakout point of a symmetrical triangle pattern on the daily chart. After a prolonged downtrend, the stock has entered a consolidation phase, forming higher lows and compressing price action — a setup that often leads to a strong directional move.
Bharat Dynamics Q2 Results
✅ Net Profit: ₹216 Cr vs ₹123 Cr (YoY) — 🔼 up 75.5%
✅ Revenue: ₹1,147 Cr vs ₹545 Cr (YoY) — 🚀 strong growth
✅ EBITDA: ₹188 Cr vs ₹98.8 Cr (YoY) — 🔼 up 89.4%
✅ EBITDA Margin: 16.4% vs 18.1% (YoY) — 🔽 slight dip
The price has reclaimed the ₹1,500–₹1,530 zone, and a sustained close above ₹1,550 could confirm a breakout, opening the path for a quick momentum rally toward ₹1,650 and beyond.
🎯 Key Levels:
CMP: ₹1,525.70 (−0.95%)
Breakout Zone: ₹1,550 – ₹1,560
Target 1: ₹1,650 – ₹1,670
Target 2: ₹1,710 – ₹1,740
Resistance: ₹1,950 – ₹2,000
Stop-Loss: ₹1,470 (on daily close basis)
📊 Technical View:
Symmetrical triangle pattern forming after a prolonged correction.
Price compression with reduced volume indicates breakout buildup.
Breakout confirmation expected above ₹1,560 with increasing volume.
If sustained, the move could extend toward the higher resistance zone around ₹1,950+.
🧠 View:
Bharat Dynamics is at a decisive point — a breakout above ₹1,550–₹1,560 with volume can mark the start of a short-term uptrend. Keep an eye on price action near this level for confirmation.
Fibonacci

Bullish Fibonacci Retracement Setup📈 Bullish Fibonacci Retracement Setup
Intro
The chart illustrates a classic Bullish Fibonacci Retracement structure — highlighting key swing points, retracement levels, and potential continuation zones.
Price action shows a healthy pullback within a larger uptrend, suggesting accumulation before a possible breakout move.
⸻⸻⸻⸻⸻⸻⸻⸻⸻⸻⸻⸻⸻
🟩 Chart Overview
• Point A → Represents the Swing Low , marking the starting point of the current upward move.
• Point B → Denotes the Swing High , where price faced resistance before retracing.
⸻⸻⸻⸻⸻⸻⸻⸻⸻⸻⸻⸻⸻
📊 Key Fibonacci Levels
1️⃣ Validation Line (78.60%) — Entry is confirmed when any two consecutive candles close above this level, signaling a strong breakout and bullish continuation.
2️⃣ Minimum Retracement (61.80%) — This level has been achieved, and two candles have successfully closed below it, confirming a valid retracement phase within the Fibonacci structure.
3️⃣ Devalidation Line (38.20%) — If any two candles close below this level, the Fibonacci setup becomes invalid.
⸻⸻⸻⸻⸻⸻⸻⸻⸻⸻⸻⸻⸻
🎯 Trail Levels
Trail Levels →
• Stop-loss will trail two levels below the current active level.
• Each target level is confirmed only when two consecutive candles close above it successfully .
⸻⸻⸻⸻⸻⸻⸻⸻⸻⸻⸻⸻⸻
✅ Summary
• Price is retracing within a strong bullish trend.
• A close above the 78.6% Validation Line confirms continuation.
• Structure remains valid as long as price holds above the 38.2% Devalidation Line.
• Trail progressively with momentum as higher targets activate.
⸻⸻⸻⸻⸻⸻⸻⸻⸻⸻⸻⸻⸻
⚠️ Disclaimer:
📘 For educational purposes only.
🙅 Not SEBI registered.
❌ Not a buy/sell recommendation.
🧠 Purely a learning resource.
📊 Not Financial Advice.

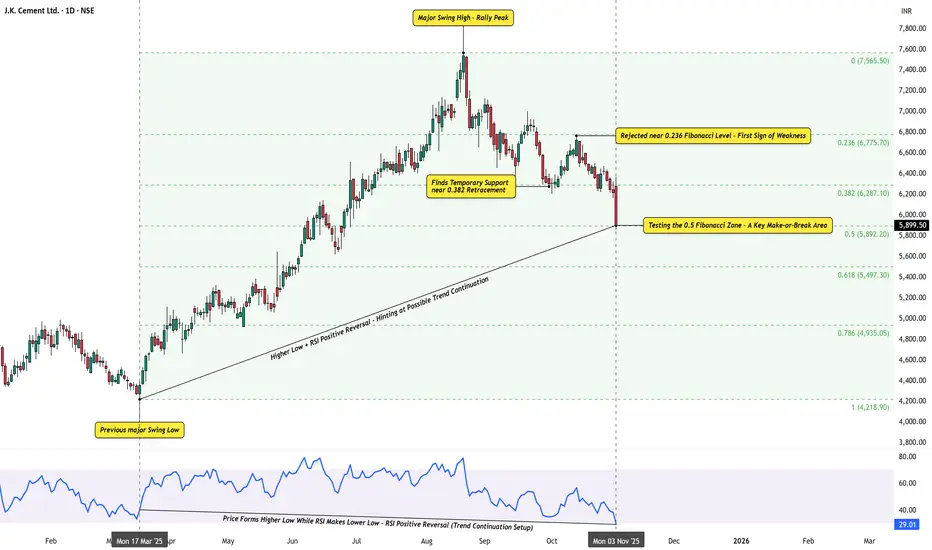
Fibonacci in Action – A Lesson from J.K. CementFibonacci retracement is one of the simplest yet most consistent tools for studying how markets correct within trends.
To understand it better, here’s a clean example from J.K. Cement .
After a strong uptrend from the March 2025 swing low to ₹7,565 , the stock began to retrace. Notice how price behavior respected the Fibonacci structure:
It bounced from the 0.382 level , illustrating a temporary reaction point.
Later, it faced resistance near 0.236 , where rallies often stall during corrective phases.
The 0.5 retracement zone now serves as a classic testing ground that often helps define trend continuation or deeper correction.
Even the RSI pattern offers insight — price forms a higher low while RSI makes a lower low, a textbook positive reversal setup that often aligns with trend studies.
The purpose of this example isn’t prediction, but to show how Fibonacci ratios and RSI behavior interact — highlighting rhythm, structure, and market psychology in motion.
Disclaimer: This analysis is for educational purposes only and does not constitute investment advice. Please do your own research (DYOR) before making any trading decisions.
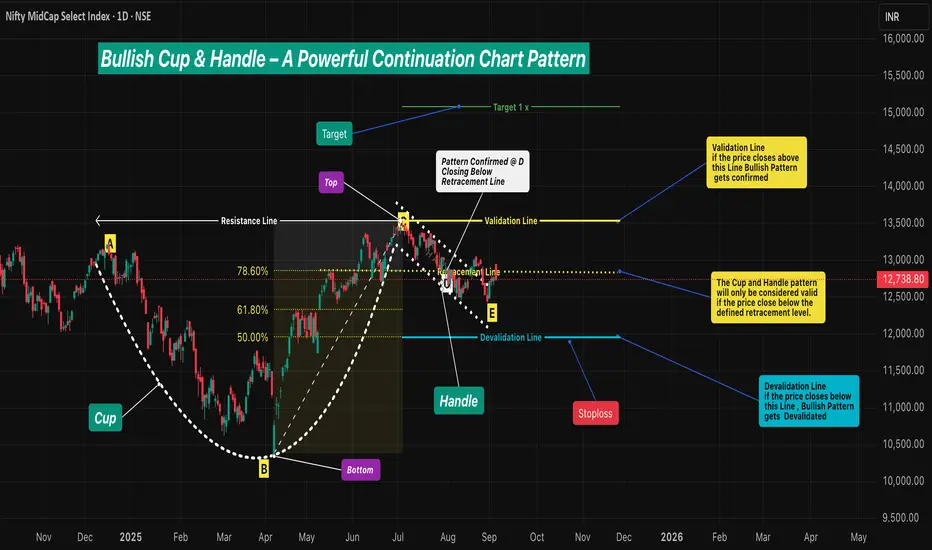
Bullish Cup & Handle – A Powerful Continuation Chart Pattern🔹 Intro / Overview
☕ The Cup and Handle is a 📈 bullish continuation pattern often studied in technical analysis.
⚔️ It forms when there is a fight between bulls 🐂 and bears 🐻 — the Cup develops as both remain strong.
📉 During the Handle, sellers 🛑 temporarily gain strength.
📈 But when price closes above the Validation Line, buyers regain control 💪 and bullish momentum dominates.
____________________________________________________________
📖 How to Identify
✅ Validation → The pattern is valid if price closes above the Validation Line.
❌ Devalidation → The pattern is invalid if price closes below the Devalidation Line(before Validation).
📉 Retracement Rule →The pattern is only confirmed if the price closes below the Retracement Line during the Handle formation.
This ensures a proper pullback forms before breakout .
____________________________________________________________
📖 Key Points of Pattern
✅ A valid Cup requires the retracement condition — confirmation occurs only if price closes below the Retracement Line .
⚖️ Balanced Highs → Point A (left peak) and Point C (right peak) should be relatively close in price, ensuring a proper Cup shape 🍵.
🔒 The Handle must not break the structural integrity of the Cup.(No Close Below Devalidation Lines)
____________________________________________________________
🎯 Trading Plan (Educational Only)
📌 Entry → Considered only after confirmation when price closes above the Validation Line.
🛡️ Stop-Loss (SL) → After validation, the Devalidation Line may act as an SL.
🎯 Target (TP) →
First Target → 1R (equal to the risk defined by Entry–SL distance).
Remaining Lots → Trail using ATR, Fibonacci levels, Box Trailing, or structure-based stops.
____________________________________________________________
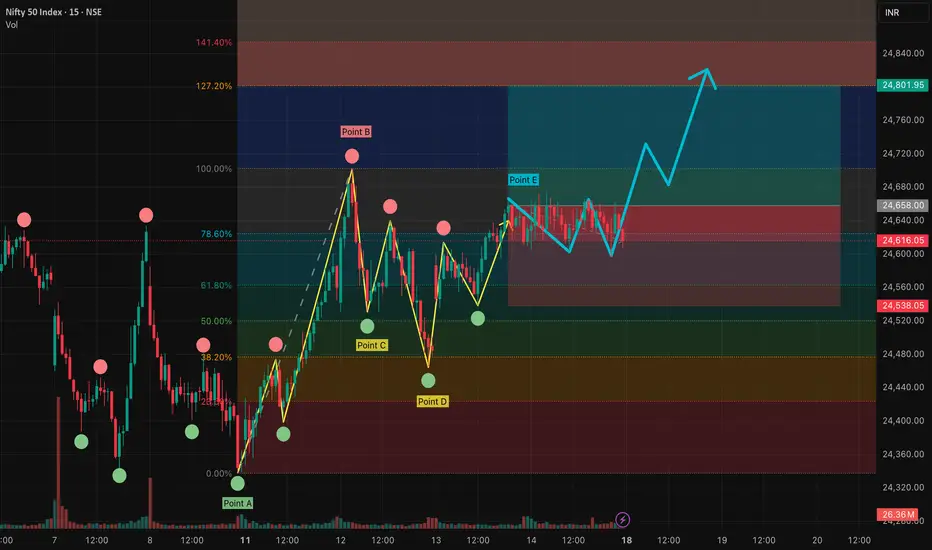
📊 Chart Explanation
🍵 The Cup forms with a rounded base Point B and two balanced tops: Point A (left peak) & Point C (right peak) - The marginal price difference should be small to ensure a reliable Cup.
📈 The Retracement Line ( Point D ) confirms the pattern only if price closes below the Fibonacci Level of 78.60% and above the 50.00% .
📉 The Handle develops as price pulls back, with Point E marking the Handle low. and Good Handle of Cup is Formed (this low should not go below 50.00% Level )
📏 The Fibonacci retracement levels are drawn from Point B (Cup base) to Point C (right peak). These levels provide a reference framework to observe Retracement (minimum 78.60%) , Validation (100.00%) , and Devalidation (50.00%) areas for educational study of the structure.
____________________________________________________________
👀 Observations
✨ Works best after a strong uptrend 🚀 or at major support–resistance zones 🧱.
⚖️ A balanced Cup (Top Right ≈ Top Left) improves reliability.
📏 Handle Formation
The Handle should be shorter than the Cup depth — and should also be longer than the required minimum depth for proper structure.
If the Handle is too deep, it weakens the setup — and also if it is too short, the formation loses reliability.
____________________________________________________________
❗ Why It Matters
🔍 Shows the market battle between buyers and sellers.
💪 Highlights how buyers regain dominance after retracement validation.
⚖️ Balanced structure + strict rules = better filtering of weak setups.
📝 Provides clarity on entry, SL, and TP with a structured framework.
____________________________________________________________
🎯 Conclusion
The Cup and Handle pattern, when validated through Fibonacci retracement rules 📉, balanced highs ⚖️, and proper Handle structure 🔒, offers a disciplined framework for studying bullish continuation setups.
🔥 Patterns don’t predict. Rules protect.
____________________________________________________________
⚠️ Disclaimer
📘 For educational purposes only.
🙅 Not SEBI registered.
❌ Not a buy/sell recommendation.
🧠 Purely a learning resource.
📊 Not Financial Advice.
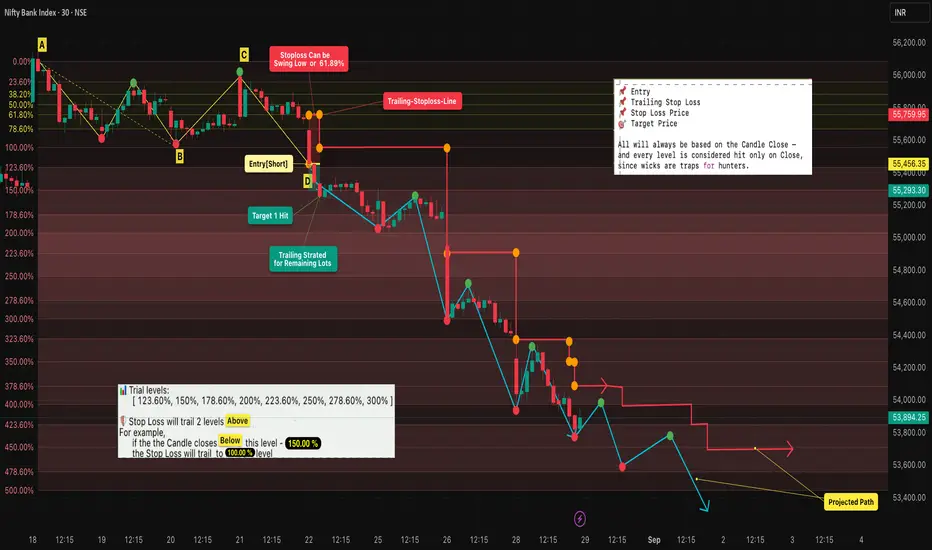
Fibonacci Trailing : Lock Profits & Ride Trends [BANKNIFTY]🔹 Intro / Overview
Managing trades after entry is just as critical as spotting the entry itself.
In this idea, we apply Fibonacci retracements with a trailing stop system to capture profits while staying disciplined.
A well-structured trailing plan helps traders:
✅ Lock in gains early
🛡️ Protect capital against reversals
📊 Stay rule-based instead of emotional
📈 In this case study, BANKNIFTY aligned well with Fibonacci retracement levels , showcasing how these concepts can work in practice as an educational example.
---
📖 Concept
- A swing High (A) to Low (B) defines our Fibonacci retracement zones.
- Retracements (C) test Fibonacci levels but don’t confirm entry until structure is validated.
- Entry (D) occurs only after a successive close confirms the short trade.
- Stop Loss (SL) is placed at the 61.8% retracement (closer and more protective than the far swing).
- Trailing: SL trails forward only , two Fib levels behind price. It manages the remaining position after booking partial profits.
---
📊 Chart Explanation (Step-by-Step)
1️⃣ Swing Definition
📍 A = Swing High
📍 B = Swing Low
2️⃣ Retracement Testing
- C → first retracement (no confirmation) - Here there's a retracement but due to the candle closes below the 38.20% level so devalidation doesn't occured.
3️⃣ Entry Point
✅ At D, successive closes confirm → short entry taken
4️⃣ Stop Loss (SL)
📉 Set at 61.8% retracement for tighter risk management
5️⃣ Targets & Trailing
🎯 Target 1 hit → exit one lot, secure partial profits
🔄 Remaining lots managed with trailing system:
• SL adjusted only forward , never backward
• SL trails as price moves down:
• 150% → SL to 100%
• 178.6% → SL to 123.6%
• 200% → SL to 150%, etc.
6️⃣ Projected Path
🔍 Blue/red paths illustrate how price could move while trailing locks in gains
---
🔍 Observations
📌 Entry validated on structure → reduces false signals
🎯 Booking partial profits builds confidence and ensures realized gains
🔄 Trailing maximizes potential while staying safe
📊 Fib-based progression keeps decisions mechanical, not emotional
---
✨ Why It Matters
✔ Turns static Fibonacci into a dynamic strategy
✔ Prevents giving back profits when trends reverse
✔ Adds confidence and discipline in trade management
✔ Teaches how to scale out smartly
---
✅ Conclusion
Fibonacci retracement alone gives levels — but combining it with a trailing stop system transforms it into a complete trade plan.
By booking partial profits and trailing the rest:
🛡️ You protect capital
🚀 You ride trends longer
🤝 You trade with discipline instead of emotion
---
⚠️ Disclaimer
For educational purposes only · Not SEBI registered · Not a buy/sell recommendation · No investment advice — purely a learning resource
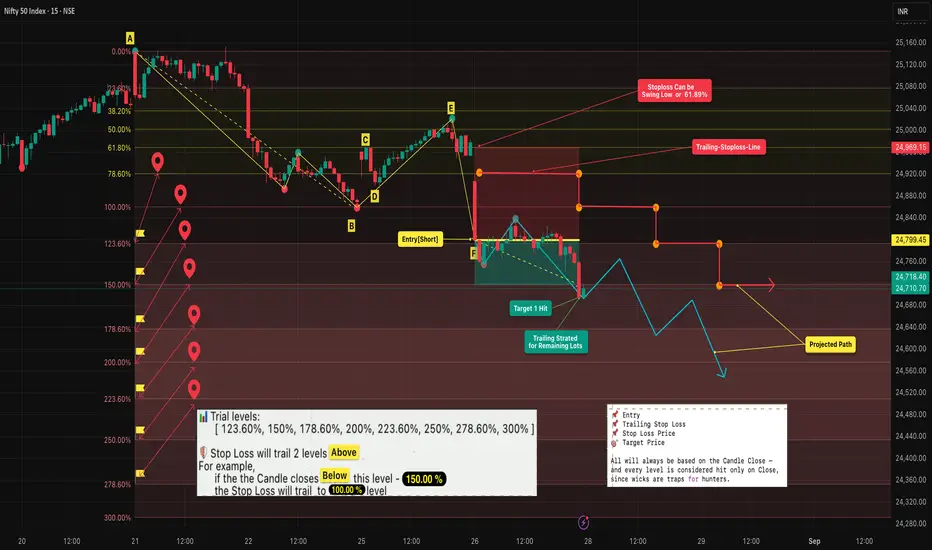
Fibonacci Retracement Trailing : Lock Profits & Ride Trends🔹 Intro / Overview
Managing trades after entry is just as critical as spotting the entry itself.
In this idea, we apply Fibonacci retracements with a trailing stop system to capture profits while staying disciplined.
A well-structured trailing plan helps traders:
✅ Lock in gains early
🛡️ Protect capital against reversals
📊 Stay rule-based instead of emotional
---
📖 Concept
- A swing High (A) to Low (B) defines our Fibonacci retracement zones.
- Retracements (C, E) test Fibonacci levels but don’t confirm entry until structure is validated.
- Entry (F) occurs only after a successive close confirms the short trade.
- Stop Loss (SL) is placed at the 61.8% retracement (closer and more protective than the far swing).
- Trailing: SL trails forward only , two Fib levels behind price. It manages the remaining position after booking partial profits.
---
📊 Chart Explanation (Step-by-Step)
1️⃣ Swing Definition
📍 A = Swing High
📍 B = Swing Low
2️⃣ Retracement Testing
- C → first retracement (no confirmation)
- D → invalid as no proper close
- E → deeper retracement, still no entry
3️⃣ Entry Point
✅ At F, successive closes confirm → short entry taken
4️⃣ Stop Loss (SL)
📉 Set at 61.8% retracement for tighter risk management
5️⃣ Targets & Trailing
🎯 Target 1 hit → exit one lot, secure partial profits
🔄 Remaining lots managed with trailing system:
• SL adjusted only forward , never backward
• SL trails as price moves down:
• 150% → SL to 100%
• 178.6% → SL to 123.6%
• 200% → SL to 150%, etc.
6️⃣ Projected Path
🔍 Blue/red paths illustrate how price could move while trailing locks in gains
---
🔍 Observations
📌 Entry validated on structure → reduces false signals
🎯 Booking partial profits builds confidence and ensures realized gains
🔄 Trailing maximizes potential while staying safe
📊 Fib-based progression keeps decisions mechanical, not emotional
---
✨ Why It Matters
✔ Turns static Fibonacci into a dynamic strategy
✔ Prevents giving back profits when trends reverse
✔ Adds confidence and discipline in trade management
✔ Teaches how to scale out smartly
---
✅ Conclusion
Fibonacci retracement alone gives levels — but combining it with a trailing stop system transforms it into a complete trade plan.
By booking partial profits and trailing the rest:
🛡️ You protect capital
🚀 You ride trends longer
🤝 You trade with discipline instead of emotion
---
⚠️ Disclaimer
For educational purposes only · Not SEBI registered · Not a buy/sell recommendation · No investment advice — purely a learning resource
Trailing Stops: Protect Profits & Ride the Trend with Discipline🔹 Intro / Overview
Managing a position after entry is just as important as identifying the entry itself.
Here, we are specifically discussing trailing stops using Fibonacci retracements .
A well-structured trailing stop helps traders:
✅ Lock in profits
🛡️ Reduce risk
📊 Stay objective in the face of market noise
This idea shows how trailing stops can be applied in a structured way to complement Fibonacci retracements and trend management.
📖 Concept
📍 A trailing stop is a dynamic stop-loss that adjusts as price moves in your favor.
🔄 Instead of staying fixed, it “trails” price at a chosen distance — capturing more upside while capping downside.
🧩 Traders often trail stops using swing lows/highs, moving averages, or volatility measures like ATR .
📊 Chart Explanation (Step-by-Step)
1️⃣ Entry Criteria
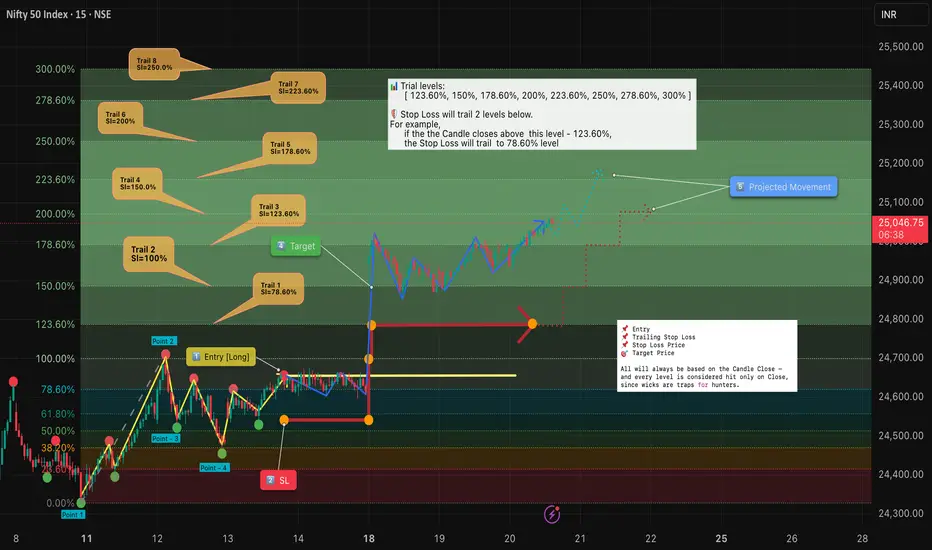
✅ Successive closes above 78.6% confirm the long entry.
2️⃣ Stop Loss (SL)
📉 Placed at the previous swing low for structure-based protection.
⏩ SL adjustments move forward only with trailing rules — never backward.
3️⃣ Trailing Levels
👉 SL always trails two levels below the current trail level if the candle closes above it.
📈 Trail 1: 123.60% → SL moves to 78.60%
📈 Trail 2: 150.00% → SL moves to 100.00%
📈 Trail 3: 178.60% → SL moves to 123.60%
📈 Trail 4: 200.00% → SL moves to 150.00%
📈 Trail 5: 223.60% → SL moves to 178.60%
📈 Trail 6: 250.00% → SL moves to 200.00%
📈 Trail 7: 278.60% → SL moves to 223.60%
📈 Trail 8: 300.00% → SL moves to 250.00%
4️⃣ Target Points
🎯 At Target 1 , book one lot to secure profits.
📊 Remaining positions can be trailed further with the next levels.
5️⃣ Projected Path
🔍 Dotted blue/red projections illustrate potential movement under this trailing system.
🔍 Observations
📌 Objective Entry : Requires successive closes above 78.6%, reducing false signals.
🎯 Partial Profit Booking : Taking one lot off at Target 1 ensures realized gains.
🔄 Two-Level Trailing : Locks in profits while leaving room for trend continuation.
📊 Rule-Based Framework : Clear Fibonacci-based progression keeps decisions mechanical and consistent.
✨ Why It Matters
✔ Prevents turning winning trades into losers.
✔ Builds confidence by removing emotions from exit decisions.
✔ Lets profits run while maintaining protection.
✅ Conclusion
Trailing stops are not about perfection — they’re about discipline .
By systematically adjusting stops as the market moves, traders:
🛡️ Protect capital
🚀 Let profits run
🤝 Remove emotions from decision-making
When combined with Fibonacci retracements , trailing stops provide a structured framework to manage trades effectively after entry.
⚠️ Disclaimer : For educational purposes only · Not SEBI registered · Not a buy/sell recommendation · No investment advice — purely a learning resource
Fibonacci Retracement Explained: Smarter Entries & Exit Zones🔹 Intro / Overview
Fibonacci retracement highlights potential support and resistance zones during pullbacks. By mapping ratios between swing highs and lows, traders can structure trades, plan entries, and manage risk — not predict the market.
📖 How to Use
1️⃣ Identify Swing Points – Draw from recent swing low ➝ swing high (or reverse for downtrend)
2️⃣ Watch Key Levels – 23.6%, 38.2%, 50%, 61.8%, 78.6%
3️⃣ Confirm with Price Action – Candle closes above/below key levels = stronger signal
4️⃣ Plan Stops & Targets – Use Fibonacci zones or swing points
5️⃣ Enhance Reliability – Combine with trendlines, moving averages, or candlestick patterns
📊 Chart Explanation (Step-by-Step)
The chart demonstrates a possible long setup using Fibonacci retracement:
Point A (Swing Low) : Starting point of the retracement
Point B (Swing High) : Endpoint establishing Fibonacci ratios
Point C (Chart Confirmation) : Swing low confirming levels are relevant
Point D (Potential Invalidation) : Price dips near 38.2%–61.8%; closes below could invalidate
Point E (Entry Zone) : Successive closes above 78.6% confirm entry
🔍 Observations
Price respected multiple Fibonacci zones (38.2%, 50%, 61.8%)
Swing highs/lows defined the structure
Yellow path = past trend movement
Blue path = potential reaction for illustration only
📌 Trade Management
Stops : Just beyond Fibonacci zones or swing points
Targets : Next Fibonacci level or previous swing high/low
Reliability increases when combined with other confirmations
✨ Key Takeaways
✔ Fibonacci is a guide, not a prediction
✔ Candle closes near levels strengthen entries
✔ Stops & targets can flex with Fibonacci or swing structure
✔ Always use confluence for decision-making
✅ Conclusion
Fibonacci retracement is a visual framework to time entries and exits with discipline. Combine it with other tools for stronger setups.
⚠️ Disclaimer: For educational purposes only. Not financial advice.
Complete Beginner’s Guide to Fibonacci, AutoFibGaugeTitle:
Complete Beginner’s Guide to Fibonacci, AutoFibGauge, and How to Plan Perfect Trades! 🎯
⸻
Many traders hear about Fibonacci but don’t really know what it is or how to use it properly.
Here’s a full beginner-friendly guide covering everything — from the math basics to real trading strategies!
What is Fibonacci?
The Fibonacci Sequence is a set of numbers where each number is the sum of the two numbers before it.
It looks like this:
0, 1, 1, 2, 3, 5, 8, 13, 21, 34, 55, 89, 144…
This simple rule creates a pattern that we see everywhere in nature:
• In the way flowers bloom
• In the spiral of seashells
• In the structure of hurricanes
• Even in galaxies
Nature follows Fibonacci.
Markets, which are built by human emotions (fear, greed, hope), also often follow Fibonacci behavior.
That’s why Fibonacci is important in trading.
⸻
The Special Golden Ratio — 61.8%
From the Fibonacci sequence, if you divide a number by the next one (e.g., 21 ÷ 34), you get approximately 0.618 — or 61.8%.
This is called the Golden Ratio.
The Golden Ratio shows up in art, architecture, music, human faces, and… yes, financial markets.
In trading, the 61.8% retracement is considered the strongest potential turning point.
If a price pulls back by around 61.8%, there’s a high chance it will bounce and continue the trend.
⸻
What is Fibonacci Retracement in Trading?
In trading, after a big move (up or down), the market rarely moves in a straight line.
It pulls back (corrects) before continuing.
Fibonacci Retracement levels help us predict where the pullback might end and the trend might continue.
Commonly Used Fibonacci Levels:
• 23.6% — Very shallow retracement
• 38.2% — Healthy pullback
• 50.0% — Halfway mark (not a Fibonacci number, but widely watched)
• 61.8% — Golden zone (high probability area)
• 78.6% — Deep retracement before a reversal
Traders look at these levels as support and resistance zones.
⸻
What is AutoFibGauge?
Normally, drawing Fibonacci manually takes time — you have to find correct swings and plot retracement.
AutoFibGauge does it automatically:
• Detects swing highs and swing lows
• Plots Fibonacci retracement levels instantly
• Keeps updating live as price moves
✅ Saves time
✅ Reduces human error
✅ Keeps your chart clean and professional
It’s built for traders who want speed, simplicity, and reliability.
⸻
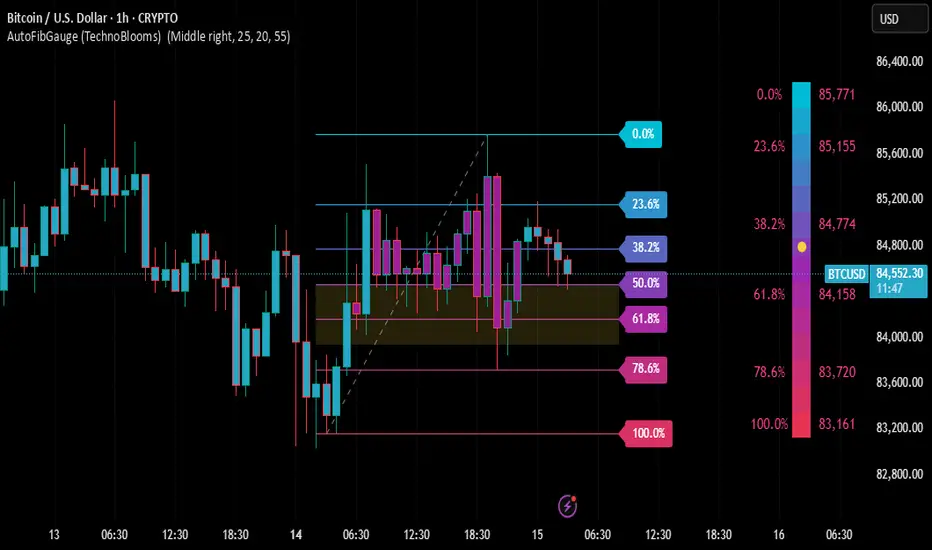
My Default Settings for AutoFibGauge:
• Swing Length: 25
• Fib Levels Displayed: 23.6%, 38.2%, 50.0%, 61.8%, 78.6%, 100%
• Mode: Automatic (finds swings without needing to adjust)
• Visual: Bands instead of just thin lines (for easier viewing)
Adjustment Tip:
• 15 min chart: Swing Length 20–25
• 1 Hour chart: Swing Length 25–30
• 4 Hour chart: Swing Length 30–40
Higher timeframes = Slightly bigger swing lengths.
⸻
How to Plan Entry:
1. Wait for price to approach a major Fibonacci level (especially 38.2%, 50%, or 61.8%).
2. Watch how the candles behave:
• If you see a bullish engulfing candle, hammer, or strong bounce from the level → Good sign to buy.
• If price hesitates or gives bearish reversal → Could signal continuation of downtrend.
3. Combine with trend confirmation tools (QMA, Parabolic SAR, moving averages).
✅ Remember: Confirmation is key.
Don’t just blindly buy or sell because price touched a level.
⸻
How to Plan Exit:
• Set first target at the next major Fibonacci level.
Example:
• If you enter near 61.8%, target 38.2% or 23.6%.
• Another method: Trail your stop-loss behind swing highs/lows as price moves in your favor.
✅ This way you lock profits even if the market reverses later.
⸻
When Fibonacci Works Well:
✅ In trending markets (clear uptrend or downtrend)
✅ When combined with price action or indicators
✅ After strong impulsive moves followed by natural pullbacks
⸻
When Fibonacci Might Not Work Well:
❌ In sideways (rangebound) markets
❌ During extreme news events or unexpected volatility
❌ When used alone without confirmation
Always remember — Fibonacci levels are not magical.
They are guidelines, not exact rules.
You need to combine them with market structure and momentum for best results.
⸻
Real Example (BTC/USD 1H Chart):
• After a rally, price retraced into the 50%-61.8% zone.
• Bullish candles appeared showing price respecting the zone.
• This was an excellent opportunity to plan a long entry with Fibonacci guidance.
⸻
Final Words:
• Fibonacci is not only for “professional” traders — anyone can learn it.
• AutoFibGauge makes using Fibonacci simple and automatic, even if you’re just starting out.
• If you respect the levels, wait for confirmation, and follow a disciplined plan, Fibonacci becomes one of your best trading tools.
⸻
Found this helpful? Tap LIKE ❤ & FOLLOW ➕ for more beginner-to-advanced trading guides every week!
⸻
#Fibonacci #AutoFibGauge #FibonacciRetracement #TechnicalAnalysis #PriceAction #TradingTools #LearnTrading #CryptoTrading #ForexStrategy #SwingTrading #BeginnersGuide
Database in trading SQL remains a fundamental tool for querying and managing data. SQL's simplicity and power make it accessible to both beginners and experts. In trading systems, SQL enables efficient data retrieval and manipulation. Users can write SQL queries to analyze market trends and execute trading strategies.
Postgres is an open-source production-ready database with lots of use cases. Mongo is a NoSQL alternative that can sometimes be much faster than SQL databases. Arctic is built upon Mongo to make it even more helpful for those who work with market data, as Arctic supports pandas dataframes and NumPy arrays by default.

Classic Double Correction PatternThis is a classic example of Double correction (Double three) in HDFCLIFE.
Marked in the first box, we can see Flat Correction where wave B is retraced to the 81% level. We are fulfilling the minimum requirement (61.8%) of wave B. Here in wave C, we see three waves. This is the first hint of an upcoming complex correction. The whole wave is marked as W here.
In the second box, there is a perfect Zig-zag pattern. Wave B is retraced to 50% here. Also, we can see three waves in wave C, which gives us wave Y.
These two waves are connected by wave X which is retraced to 111%.
This is the best example of Double correction.
This analysis is for educational purposes only.
This analysis is based on Elliott Wave theory and Fibonacci analysis.

Gold - Bookish example for Morning/Evening StarA typical example of Morning Star and Evening Star in the same chart. Its a good time to consolidate Gold
Evening Star
Evening star patterns are associated with the top of a price uptrend, signifying that the uptrend is nearing its end
The first day consists of a large white candle signifying a continued rise in prices.
The second day consists of a smaller candle that shows a more modest increase in price.
The third day shows a large red candle that opens at a price below the previous day and then closes near the middle of the first day
Morning Star
The Morning Star pattern is a classic bullish reversal pattern in technical analysis. The pattern consists of three candlesticks: two large ones with different directions and a smaller candlestick between them.

Classical example of Elliott waveClassical example of Elliott wave.
Wave 2 retraced to 61.8% forming Flat correction.
Wave 3 extended to 161.8% forming a normal or trending impulse.
Then wave 4 retraced to 23.6% in Zig-zag form. (This fulfilled the Rule of Alternation)
Wave 5 retraced exactly to its minimum target of 127% retracement. Where cluster of 200% extension was also there. Wave 5 formed in typical Ending diagonal format.
Here bigger wave 1 completed.
Now fall will come in NUVAMA forming bigger wave 2.

Bitcoin Crash Incoming? | Elliott Wave Theory Market ForecastGreetings, fellow traders,
In this post, I employ "Elliott Wave Theory" to analyze and predict Bitcoin's price movements. The decision to utilize this theory stems from its robust framework for interpreting market cycles, which is essential for precise forecasting in the volatile cryptocurrency market.
1️⃣ The value of an asset directly reflects the sentiment of investors participating in the market.
2️⃣ When investors are optimistic, increased demand naturally drives prices up, while fear among investors leads to price declines.
3️⃣ Prices are a direct representation of investor sentiment, and the "Elliott Wave Theory" is a framework that patterns these price movements.
✅ Conclusion
By applying the "Elliott Wave Theory," it is possible to anticipate Bitcoin's next move.
Therefore, let's now dive deep into the "Elliott Wave Theory" to both predict Bitcoin's next movements and gain a thorough understanding of this theory.
—
✔️BTCUSDT.P / BINANCE / 8H
This chart review covers the period from January 24, 2024, to March 14, 2024.
During this timeframe, a rare "Double Extended Impulse Wave" pattern appeared, characterized by an extended 5th wave.
The supporting evidence for this pattern is as follows:
1️⃣ A breakout from the 1-3 trendline.
2️⃣ The 3rd wave extended beyond 1.618 times the length of the 1st wave.
3️⃣ The 5th wave extended beyond 1.618 times the length of the 3rd wave.
4️⃣ The 4th wave took longer to develop compared to the 2nd wave.
I will explore these points in greater detail with the accompanying chart analysis below.
—
✔️BTCUSDT.P / BINANCE / 8H
This chart includes the evidence discussed earlier, specifically the first point mentioned. (Reference: 1️⃣)
In wave analysis, trendlines play a crucial role. A break in the trendline often signifies the end of a wave or highlights the unique characteristics of that wave.
In this post, we'll focus on the waves marked on the chart, so please pay close attention to the attached chart.
The extension of the 5th wave is significantly influenced by the trendline connecting the peaks of the 1st and 3rd waves.
This trendline is especially important in the context of a "Double Extended Impulse Wave."
A "Double Extended Impulse Wave" indicates a strong buying momentum in a bull market or a strong selling momentum in a bear market.
Therefore, it is expected that the upper trendline (the 1-3 trendline) would be breached as the wave progresses.
(leading to a sharp rise in a bull market or a steep fall in a bear market).
Please refer to the chart provided above.
There are five instances of "Over shooting" , indicating a strong bullish market.
This example shows how a single trendline can help identify the market's strength, weakness, and the type of wave pattern in play.
Now, let's move on to the next chart.
—
✔️BTCUSDT.P / BINANCE / 8H
This chart includes the evidence discussed earlier, specifically the second and third points mentioned.
(Reference: 2️⃣3️⃣)
Additionally, this chart illustrates the internal Fibonacci ratios of the extended impulse wave.
The characteristics of the internal Fibonacci ratios for an extended 5th wave in an impulse wave are as follows: (Satisfied: ✔️ / Not Satisfied: ✖️)
✔️ The 3rd wave rises between 100% and 261.8% of the length of the 1st wave.
✔️ The 5th wave rises 161.8% of the (0-3) length, measured from the end of the 4th wave. (It should be shorter than 261.8%.)
✔️ The 5th wave is longer than the shorter of 100% of the (0-3) length and 161.8% of the 3rd wave.
Since this wave satisfies all the above conditions, it is highly likely to be a Double Extended Impulse Wave with an extended 5th wave.
—
✔️BTCUSDT.P / BINANCE / 8H
This chart represents the external Fibonacci ratios of the extended impulse wave.
(For an impulse wave with an extended 5th wave, the external ratios are considered more reliable than the internal ratios.)
The characteristics of the external Fibonacci ratios for an extended 5th wave in an impulse wave are as follows:
(Satisfied: ✔️ / Not Satisfied: ✖️)
✔️ The length of the 5th wave, measured from the end of the 3rd wave, forms at 100%, 161.8%, or 261.8% of the (0-3) length.
Since this wave satisfies all the conditions, it is highly likely to be a "Double Extended Impulse Wave" with an extended 5th wave.
(The author also considers the external ratios to be highly reliable.)
—
✔️BTCUSDT.P / BINANCE / 8H
This chart includes the fourth piece of evidence mentioned earlier (Reference: 4️⃣).
One of the most essential concepts in "Elliott Wave Theory" is "The Rule of Alternation."
This principle is foundational to understanding market movements and is critical to the rules governing wave progression. Without it, Elliott Wave Theory would lose much of its practical value.
"The Rule of Alternation" is most clearly demonstrated in the period of corrective waves.
In the chart provided above, you’ll notice a comparison between the length of the 2nd wave and the 4th wave.
Typically, before an extended wave appears, the market tends to undergo a longer or deeper correction. In this case, the 4th wave is noticeably longer than the 2nd wave, which satisfies this condition.
This observation significantly increases the reliability of the wave pattern.
—
✔️BTCUSDT.P / BINANCE / 1D
Now, let's discuss the potential future direction.
If the low point of the 5th wave within the extended impulse wave breaks, it is likely that this impulse wave marks the final wave of a larger wave pattern.
In simpler terms, the 5-wave extended impulse wave we've discussed so far may represent the last wave of the current upward trend.
To put it even more clearly, if the price falls below the $50,922.5 level, there is a high probability that the market has transitioned into a downtrend.
Please refer to the following chart for further details.
—
✔️BTCUSDT.P / BINANCE / 1D
Based on the assumption that the market has transitioned into a downtrend, I’ve constructed the following scenario.
It appears that a Corrective Wave (Flat) has already occurred, and the market is currently experiencing a correction in response to this wave (indicated by the red dotted line).
According to this scenario, even if the price experiences an upward movement, it is likely to be a technical rebound within the broader context of a continuing downtrend.
—
Conclusion
Today, we applied the Elliott Wave Theory to the actual Bitcoin chart to analyze the market.
I made every effort to maintain an objective perspective.
I am aware that many traders and investors are anticipating a continued upward trend. However, my intent in presenting a bearish scenario was not to gain attention, but rather to analyze the market as objectively as possible.
It’s important to approach the market rationally, rather than simply calling for a rise without substantial evidence.
I encourage you all to remain wise traders and investors who do not succumb to 'FOMO' (Fear of Missing Out) and always maintain an objective view of the market.
Thank you for taking the time to read this post.
If you found this analysis helpful, I would greatly appreciate it if you could give it a "boost." Should there be significant interest in this post, I'll consider creating follow-up analyses.

Right approach for current market and FibonacciRight approach for current market and Correct Fibonacci retracement

Falling Knife stocks-How to identify them?I have discussed in previous post about what exactly falling knife stock is with a case study.
The next question would be how would an investor know that stock is a part of falling knife category?
To identify such stocks, I feel you should know about 2 concepts/indicators which are Moving averages and Fibonacci retracement. I will try to make you understand these concepts and also the levels where averaging/investing can be started.
1. Fibonacci(Fib) is a mathematical concept which governs the entire universe, even our stock markets. I can't explain the entire scientific concept here so just sticking to stock market.
Fib retracements help investors identify support and resistance for stock. There are 2 golden ratios which every investor must know, 38.2%(0.382) and 61.8%(0.618).
When a stock is in uptrend, 38.2% is the level where most stocks retrace upto. 61.8% is considered as last ray of hope for bounce in retracement. Any stock which has fallen below 61.8% is considered weak.
2. Moving averages(MA) are indicators which are continuously changing with moving stock market. These are an average of prices over a time period, hence Time frame is important.
There are many types of moving average, we use mostly simple and exponential.
When I say 20 Day EMA, it is Exponential average of 20 days of closing price of stock or when I say 200 week SMA, it is simple average of 200 weeks closing price.
Exponential is more used than Simple moving average which has scientific reason behind it so if you are curious, you can search for it.
200 Week moving average is considered as last ray of hope for investment. A fall below 200 Week moving average or 50 Month EMA indicates strong bearishness.
3. I have seen stocks reach from top to bottom and top again. Tata motors, HDFCAMC being few famous examples. Even, Most of real estate, PSU banks stocks are reversing. So, equity is beautiful, wild and highly unpredictable. However, A stuck investor should wait for monthly closing above 61.8% to start averaging in such stocks. Also, a closing above 200 Week EMA will slightly indicate return of bullishness and that's where reversal traders should think of investing
I feel this much knowledge is enough for now. If you have got some enlightenment from above information, lets apply this knowledge on one stock where I know many many investors are stuck, Rajesh Exports.
How do I know? I saw the shareholding pattern and that's where I was shocked to see the number of shareholders increase from 45000 odd to over 2 lakhs in the past 9 months!
Starting with fundamentals, Rajesh Exports Ltd is 4 decade old manufacturer of Gold and Gold Products available at a PE of around 9 and sales growth of 20% in last 3 years. All the ratios feel nice to me except the operating margin which is below 2% consistently which has led to drop in EPS which is major concern in the stock.
Technically, stock had a 52 week high of 1030 in Feb 2023 and it is now available at 360 odd which is more than 60% wealth destroyed. And as I said, the number of shareholders have grown 5x in the same time. (Note that FII, DII holding has reduced in same period).
If i see now from a non-investors perspective(psychology explains that investor can never see the bearishness), the stock has formed a beautiful double top and broken its neckline which was 61.8% of fib retracement all ready for a further fall and I see no support till 270-300 zone(sorry investors). It is also below 200 week moving average-red wavy line(if you check monthly chart, it is below 200 month moving average as well). A perfect example of Falling knife.
What next? If I were an investor, My last SL would have been 525 which is 50% retracement. Since, the stock is below 61.8% retracement , there is no chance of averaging at this moment. Hence, I feel investors should wait & watch until stock moves above 440 before averaging/entering. Don't jump in it. Wait for a big bullish monthly candle before averaging.
Also....
As promised,, I am sharing you names of stock which i have identified to be part of this unloved category. As an homework, do check fundamentals and reversal levels based on what we have discussed above.
The stocks are GRINFRA, TCNSClothing, Metropolis, Luxindustries, Polyplex, HLEGlasscoat, Deltacorp, Barbequenation.
If you are a curious investor, even you can find such stocks and do let me know in the comments below.
I would like to discuss any doubts regarding the concepts, idea or anything related to stock market so feel free to comment.
Keep investing, keep minting. India has a very big future ahead so these are the best few years to invest in India.Be a smart investor because it is important that you choose the right stock to meet your financial goals.

Trading journal 🥲 20 trades posted for you guys
4 of them got SL❌ hit without reaching TP 1✅.
That's not the end of my trading 😅 ,no one is 100% accurate in any field.
80% win rate is satisfied for me to be a profitable trader as we can see some of them never touched SL and still keeps growing which is also a very good thing about this journey.
Always trust your plans 👍 ,
Psychology tip:-Don't let FOMO interact your mind or trading plan. Sl tp entry always remain same..never change them once u have set. Just forget after getting into the trade..either hit tp or sl.. don't bring sl to more down and increase your losses or tp to more up to increase your risk of hitting it.

Viewing Deep Preview on Fibonaccisjust now
Hey Everyone,
Today we are again with a lot of information and a bunch of topics, so consider following us for regular ideas and market updates
Let's go Strictly into the idea
So In the last idea we covered an overview but now lets cover a detailed view and even learn about Fibonacci Extensions, Fibonacci Number and Lines and more and more.
What Are Fibonacci Retracement Levels ?
Fibonacci retracement levels are horizontal lines that indicating where support and resistance can take place . Each level is having their own percentage. The Fibonacci retracement levels are 78.6% , 61.8% , 23.6% and 38.2% . But the most working levels of a Fibonacci are 38.2%, 61.8% and 78.6% . The indicator is very useful because it can be drawn easily and it can tell you many thing such as support and resistance . It can be drawn between high and low where the lines form is your support and resistances .
What Are Fibonacci Extensions ?
Fibonacci extensions is a tool that can be used to target Profit or approximate how far a price should travel after a pullback ends . Extension levels are also the areas where the price may reverse
These levels are based on Fibonacci ratios . Common Fibonacci extension levels are 261.8% , 200% ,161.8% , 100% , and 61.8% .
What Is the Fibonacci Number and Lines ?
The Fibonacci Numbers and Lines the sequence of numbers , is a slowly increasing series where every number is the equal to sum of the preceding two numbers .
We will meet you very soon so consider following you can unfollow us any time
Thanks for reading it and giving it your time
Bye 😁

'SWING' your losses into profits with 'SWING' trading strategiesIn prior posts, we have covered some great teachings about the market and,
in this post, we will elaborately cover the swing trading strategies. Let's start !!
->Definition of swing trading -: Swing trading is generally referred to as a trade carried out for a short time. Swing traders do not wait
till the price action opposes their direction, they are known for their prior moves.
They are good at identifying the shifts in market trends with the help of various techniques which are explained throughout this idea.
Swing trading strategies include the use of Fibonacci, Bollinger Bands, Channel Trading, Moving Average, MACD crossover, and better
understanding of chart patterns like Head & Shoulder, Flag, and Triangle Patterns.
We will discuss chart patterns, later on, now let's focus on the indicator strategies.
- >Swing trading strategies -:
->Fibonacci Retracement: The stock price tends to retrace, and swing traders use this retracement as an opportunity to enter a trend.
The retracement levels could be identified using Fibonacci Retracement, all you need is to identify the prior trend and if the price retraces to the 0.618 level and
again resumes the trend jump on it and ride the position till it reaches 0.236 level.
->Bollinger Bands : Most probably, the stock price tries to move in the Bollinger band, which is used by swing traders to initiate and terminate their position.
Firstly you need to identify the major trend, let's suppose it's bearish than when the price reaches the upper bound and there is a formation of a bearish candle
you could initiate a short position also when a bearish candle is formed at the median, there also you can initiate a short position.
->Channel Trading: Sometimes, stock price trades in a channel now this channel is used by swing traders i.e. when the trend is bullish they try to take long
position at the lower range of channel and book partial profits on median and wait for the price to reach the upper end.
->Moving Average: Here traders identify the major trend and take position according to it, with help of crossovers they generally prefer 10DEMA crosses 20DEMA.
->MACD : This is a simple strategy where the trades are initiated when there is MACD crossover but the cross should correlate with the trend.
My Observation-: These strategies could be more accurate if used to trade with the trend, i.e. if the stock is in an uptrend only take positions for a positive signal and just avoid negative signals.
Another basic strategy is to take a position when a script moves above the swing high or below the swing low, here the only thing to ponder is to manage your risk. Don't take over positions understand your risk appetite then take positions.

You Might Have Heard A Lot About This Hey Everyone,
Today we are again with a lot of information and a bunch of topics, so consider following us for regular ideas and market updates
Let's go Strictly into the idea
So What is a Fib Retracement ?
Now You might think it is just making lines and deciding on support or resistance but it's way too far, as shown in the thumbnail " The Major Levels " it means the levels that can be a support or resistance and can be found easily as shown.
So Now we have learned What is Fibonacci Retracement, Now Let's Know How to use It ?
To use fib retracememts we need to first find a low and a high level and then set 1.000 and 0 and then just seek at The Major Levels to Trade.
This was just an overview if you want a more detailed idea in which we will discuss Fibonacci Extensions , Fibonacci Number and Lines tell me in the comments and i will do for sure
Thanks
Bye - Bye

What is Fibonacci extension?Hey everyone! 👋
Last time we explained some of the basics to know when it comes to understanding the Fibonacci retracement tool. If you haven’t read that post, be sure to check it out here:
In this post, we are going to look at the Fibonacci extension along with a few exhibits that may help you solidify your understanding of this unique trading tool.
Please remember this is an educational post to help everyone better understand investing and trading tools. In no way are we trying to promote a particular style of trading!
Table of Contents:
1. What are Fibonacci extension levels?
2. What is the significance of extension levels?
3. How to find extension levels?
4. Difference between the Fibonacci retracement and Fibonacci extension
Without further ado, let’s jump in!
What are Fibonacci extension levels?
A Fibonacci extension is a tool that can be used to find price targets or estimate how far a price may move after the retracement/pullback is over.
Extension levels are also possible areas of interest where the price may stall or reverse.
It can be used to find projected areas of support or resistance when the price is moving into an area where other methods of finding support or resistance are not applicable or evident.
Fibonacci extension levels can be calculated to give the trader ideas on profit targets.
Significance of Fibonacci extension levels
Different traders use this tool differently but the most common usage is as follows:
Fibonacci extensions can be used for any timeframe and in any market- stocks, commodities, cryptocurrencies, etc.
Fibonacci extension levels indicate a price area that will be significant for the stock after the pullback/correction is over.
Extension levels can be drawn on different price waves over time. When levels from these different waves converge at one price, that could be a very important area.
For example , A stock may be in an uptrend. After a move up, it retraces to the 61.8% level. Then, it starts to go up again. In this case, the extension tool can be used to find the optimal targets after the price moves above the swing high level (100% level).
How to find Fibonacci extension levels?
In order to find the Fibonacci extension levels, you have to find the recent significant swing high and swing low and then plot the Fibonacci extension accordingly.
For uptrend: First, select the swing low and then the swing high. Then go to the Fibonacci settings and select reverse.
For downtrend: First, select the swing high and then the swing low. Then go to the Fibonacci settings and select reverse.
Exhibit: Fibonacci extension in an uptrend
Exhibit: Fibonacci extension in a downtrend
Difference Between Fibonacci Retracements and Fibonacci Extensions
Fibonacci retracements provide levels for a pullback whereas Fibonacci extensions provide levels in the direction of the existing trend.
For instance, a stock goes from 50 to 100 and then falls back to 75. The move from 100 to 75 is a retracement. If the price starts rallying again and goes to 150, that is an extension because the price moved past the previous swing high which is 100 in this case.
Conclusion:
Adding Fibonacci analysis with other common methods of technical analysis can be useful for adding confluence to a trade.
Thanks for reading! Hope this was helpful!
See you all next week. 🙂
– Team TradingView
Feel free to check us out on Twitter and Instagram for more awesome content! 💘

What is Fibonacci retracement?If you have been in the market for some time, you may have heard of “Fibonacci retracements” . Today we are going to share an informative write-up along with a few exhibits that may help you solidify your understanding of this concept.
Table of Contents:
1. What are Fibonacci levels?
2. What is the significance of retracement levels?
3. How to find retracement levels?
4. How to use the retracement levels?
Without further ado, let’s jump in!
What are Fibonacci Retracement levels?
The retracement levels are horizontal lines that indicate areas where the price could stall or reverse.
These horizontal levels can act as potential support or resistance levels.
They are based on Fibonacci numbers. Each level is associated with a percentage which means how much of a prior move the price has retraced.
The retracement levels are 23.6%, 38.2%, 61.8%, and 78.6%.
While 50% is not a pure Fibonacci ratio, it is still used as a support and resistance. This is because people regard it as an important level.
The price won’t always bounce from these levels. They should be looked at as areas of interest. Hence, the Fibonacci retracement should be used as a confirmation tool.
Significance of Fibonacci Retracement levels
Different traders use this tool differently but the most common usage is as follows:
Place entry orders
Determine stop-loss levels
Set price targets
For example, A stock may be in an uptrend. After a move up, it retraces to the 61.8% level. Then, it starts to go up again. Since the bounce occurred at a retracement level during an uptrend, long positions can be initiated with an optimal stop loss.
Finding Fibonacci Retracement levels
In order to find the retracement levels, you have to identify the recent significant swing high and swing low and then plot the Fibonacci accordingly.
For uptrend: First, select the swing low and then the swing high.
For downtrend: First, select the swing high and then the swing low.
Exhibit: Fibonacci retracement in an uptrend
Exhibit: Fibonacci retracement in a downtrend
How to use the retracement levels?
If the price is approaching a Fibonacci level, you should look out for the following things at the point of interaction or in the vicinity of the level.
Reversal candlestick patterns
Rising volumes
Moving average
RSI divergence
Previous support/resistance level
Conclusion:
Adding Fibonacci analysis with other common methods of technical analysis can be useful for adding confluence to a trade.
Thanks for reading! Hope this was helpful!
See you all next week. 🙂
– Team TradingView
Feel free to check us out on Twitter and Instagram for more awesome content! 💘

Can you predict such falls? Fibonacci Retracements - (bad audio)Market fall may have taken few by surprise, but followers of price action techniques should have this scenario in their plan. Trend analysis (or Elliot wave analysis) along with Fib Retracements could be of enormous help if used in tandem with price action. They at least give you minimum target and levels, so that you are able to ride the trend and also do not make impulsive entry decisions.
(Disclaimer: the audio quality is really bad. Somehow the system is not allowing external mic and using internal mic which is capturing lot of noise. Tried typical methods but not working. If you have solution let me know)
