USOil mini breakout in 15 mins time frameReason for crude movement towards upside direction : 15 Mins triangle pattern breakout and achieved first target
Trianglepattren

US Crude Oil 15 mins triangle pattern formationAs per 20/07/2020 US crude oil forms Triangle pattern in 15 mins Time Frame. Based on breakout either you can go for a long or short after 5 mins candle confirmation


Triangle Breakout!!TRADING PSYCHOLOGY : The stock forms a triangle pattern when the tug of war between BULLS and BEARS is at the end stage where one is bound to give up.
AC line will act as resistance line.
BD line will act as support line.
when to trade : The candlestick has to break the support/resistance line with increasing volume to confirm the direction.
STOP LOSS: If the breakout is upwards then support line will act as stop loss.
If the breakout is downwards then resistance will act as stop loss.
PS : This is 15 minute candlestick chart so the targets are most likely to achieve in 1-2 days.
The accuracy of this strategy is 80%.

Watchout ICICIBANKThe stock is currently in 375 range, which it has faced resistance many times in the past. If it crosses 380 zone with good amount of volume , we can consider long in this. Levels have been mentioned in the graph.
This is as per my analysis.
Happy Trading.
Currently, I am learning fundamental and technical analysis of the stocks. Please feel free to comment on the post, if I did any mistake in Analysis.

TVS Motor will be a BUY only if (Stock for 7th July 2020)The RSI is also in the overbought (>70) zone and hence once it rechecks the marked level in the chart one can easily take a BUY call.
Target : 3%
Risk : 1%
Risk : Reward : 1:3.
Will keep updated here. Do follow to keep motivating you !
Also you can follow me on Quora (Jago Niveshak )where I will explain the whole setup and levels to BUY for two stocks for 7th July 2020

# 16 Long Whirlpool for a Target of 2700 and 2850.NSE:WHIRLPOOL
Reason Being:
1. Formation of Triangle pattern and Expected Upper Breakout.
2. Stock is Forming Higher High Pattern in Daily Time Frame
3. The stock has faced Resistance in the zone of 2125 - 2170 and has been tested multiple times.
Every Price Action Pattern after breakout provides some Target Range and according to Triangle:
Entry Price: Above 2200+
Target Price: 2700 and then 2850
View Negated Below: 2060 in Closing Basis.
#Disclaimer: I'm not a SEBI Registered Research Analyst, These are my views, please consult your Investment Advisor before buying and selling any position. This is just for Education Purpose.

BHARTI AIRTEL has broken out the triangle pattern Please refer the image as I have given the levels of retests and rules. Follow them for a successfull trade.

TATA MOTORS is going to be a Positive stock (Monday)I have added all the necessary points in the chart , please refer and ask any doubts apart from that.
Regards,
-Abhishek


A beautiful triangle patternAn diminishing triangle pattern has formed between the trend line (in orange) and the support line (again in orange) at 75.2.
75.2 is a strong support and has supported the scrip 4-5 times since 8th June. I am betting slightly higher on the breakout happening on the downside. The second wave has led to serious outflow of USD to other currencies (EUR, YEN, CNY).
Let's see what happens.


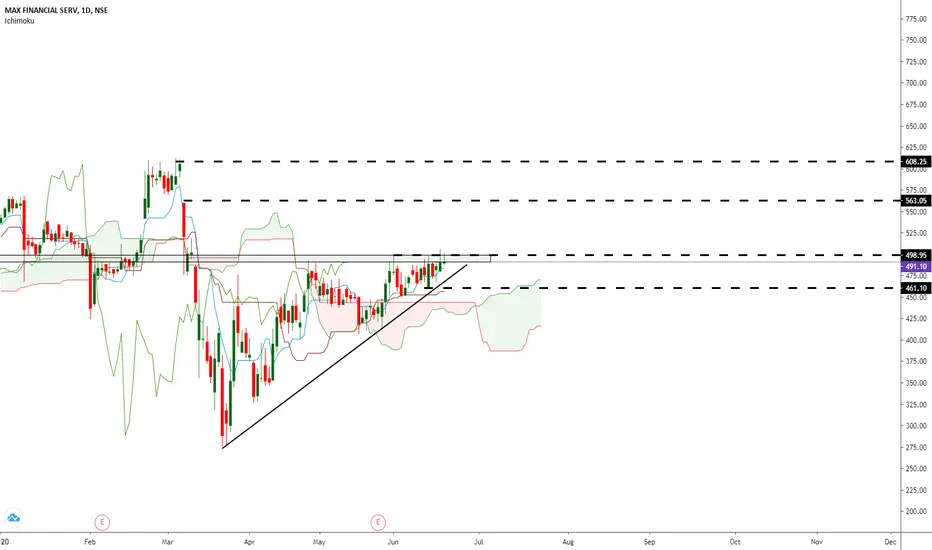
LONG MFSLNSE:MFSL
#MFSL Triangle BO possible, Ichimoku Bullish, Cup Handle
CHART BY HarmonicTrading™
Godrej Consumer Products : Triangle Pattern -BreakoutGodrej Consumer Products has broken out from a triangle pattern on 15 mins time frame.
Initiate long.
Target : 675
Stop Loss : 650


AUD WITH ASSCENDING WEDGE PATTERN FORMATIONWe can see a clear ASSCENDING WEDGE PATTERN FORMATION on AUDCHF Currency Pair In D1 Chart which may result in breakout either side, our prediction is that it might break downside itself because it has just now retested a heavy resistance 3 times which can even be considered as a TRIPPLE TOP FORMATION, But take your trades based on breakouts and enjoy with a minimum of 250 pips either side
ALL THE BEST TRADERS

Manappuram Finance - Breakout - Triangle PatternManappuram finance has given a breakout from an ascending triangle pattern on Hourly chart.
Buy for the targets of 138/140
Stoploss: 112

[Positional] PVR nested inside barsWait for a candle to close outside the triangle on long or short side and next day, buy when that particular candle is broken.
Target and SL will be posted when trade triggers

SHORT IT , in shortLooks like Reliance large investors have found pattern working for them . simple patter for swing trading , open to hear your thoughts

CHOLAHLDNG BULLISH - TRIANGLE PATTERNCHOLAHLDNG with high percentage of delivery (82% last eight days). Needs more volume to be meaningfully indicative.
