On the 1H chart, $BNB is forming a Head & ShouldersOn the 1H chart, CRYPTOCAP:BNB is forming a Head & Shoulders after a strong sell-off from the 900+ region.
Left Shoulder: ~785–790
Head: ~728 (marked low on chart)
Right Shoulder: ~770–775
Neckline / Supply Zone: 780–785
Current price is trading below the neckline, which keeps the structure
Crypto market

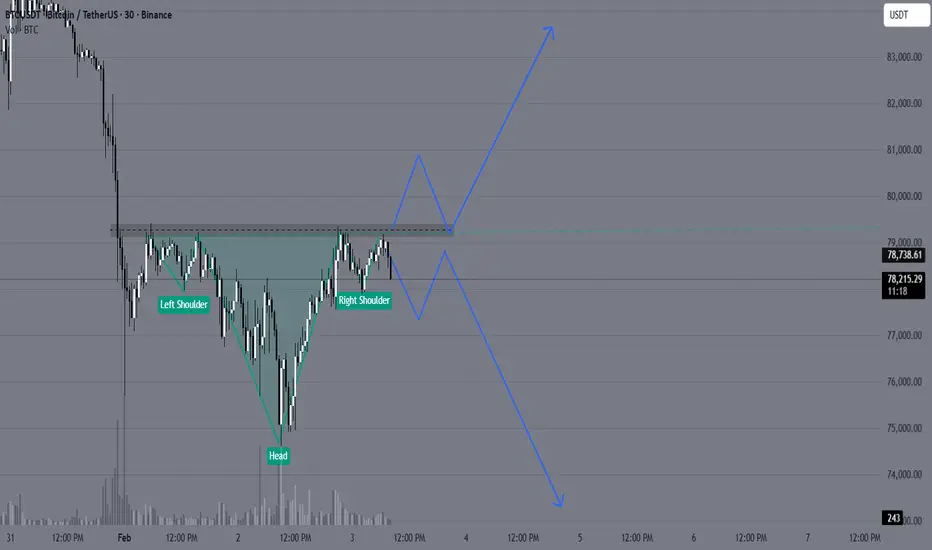
BTCUSD might give Structure Shift Now✅ Pattern: Potential Inverse Head & Shoulders
Look closely:
Left dip → around 76.8k
Deep dip (Head) → around 75k
Right dip → higher low near 76.5k
Now price is pushing back up
This is a classic reversal structure.
✅ Important Level: Neckline Resistance
The dotted zone you marked around:
79,
Why Bitcoin’s Stability Is a Warning, Not StrengthBitcoin’s inability to participate in the recent “debasement trade” is not a sign of hidden strength — it’s a sign of waning relevance in the current macro cycle.
While gold and silver surged during the final euphoric phase, Bitcoin’s stagnation near $82,000 suggests that capital actively chose har

ETHUSD SHOWING A GOOD DOWN MOVE WITH 1:8 RISK REWARDETHUSD SHOWING A GOOD DOWN MOVE WITH 1:8 RISK REWARD
DUE TO THESE REASON
A. its following a rectangle pattern that stocked the market
which preventing the market to move any one direction now it trying to break the strong resistant lable
B. after the break of this rectangle it will boost the mark

The Ugly Truth Behind Cathie Wood's $1.5M Bitcoin Prediction⚠️ The Ugly Truth Behind Cathie Wood's $1.5M Bitcoin Prediction Nobody Talks About (The $1M Bitcoin Trap Exposed)
Cathie Wood Just Predicted $1.5M Bitcoin By 2030. Before You Get Excited, Let Me Show You Something Important.
Her Prediction Track Record:
1️⃣ November 2020: Target: $400K-$500K
2️⃣

BTCUSD/BITCOIN SELL PROJECTION 03.02.26BTCUSD SELL PROJECTION | Market Breakdown Explained
“Let’s break down the current BTCUSD market structure and why the sell bias is still valid.
Bitcoin is clearly trading inside a parallel downtrend channel, showing strong bearish continuation. After a strong impulsive drop, price attempted a pull

BTCUSD Reacts From Demand Zone After Strong Bearish MoveBTCUSD has shown a sharp fall from the upper resistance area near 90,500–91,500, where sellers clearly dominated and price failed to hold higher levels. This rejection led to a strong bearish move, confirming a short-term downtrend with consistent lower highs and lower lows. The descending trendline

Btc power house Despite the current downturn, institutional forecasts for the remainder of 2026 remain highly varied but generally optimistic for the long term:

ETH Reversal or just a pullback?CRYPTO:ETHUSD
Looking at the 4hr TF of ETH. it looks taking a minor pullback from the downward trend.
Yet it has to close Above $2620 to break the character of the current downtrend.
Highly likely it will chase this number successfully as more people are coming in with sentiment of buying the

Bitcoin Bybit chart analysis FEBURARY 2Hello
It's a Bitcoin Guide.
If you "follow"
You can receive real-time movement paths and comment notifications on major sections.
If my analysis was helpful,
Please click the booster button at the bottom.
This is Bitcoin's 30-minute chart.
The Nasdaq indicators will be released shortly at 12:0

See all popular ideas
Community trends
Crypto collections
Frequently Asked Questions
Cryptocurrency is a type of digital currency that relies on cryptography for security, making it hard to duplicate or manipulate. It operates on blockchain technology — a shared ledger managed by a network of computers. Unlike traditional currencies, cryptocurrencies aren't controlled by central entities like governments or banks, allowing them to function independently which helped cryptocurrencies find a huge popularity among users worldwide.
Crypto mining is the process of verifying transactions on a blockchain and adding them to a decentralized ledger. It prevents double-spending and keeps the network secure.
Miners use specialized hardware and software to solve complex cryptographic problems. When successful, they earn newly created coins as a reward.
While mining is often linked to coin creation, it also plays a vital role in maintaining the security and functionality of the entire blockchain system.
Miners use specialized hardware and software to solve complex cryptographic problems. When successful, they earn newly created coins as a reward.
While mining is often linked to coin creation, it also plays a vital role in maintaining the security and functionality of the entire blockchain system.
Markets can be highly volatile — and crypto leads the pack. Prices can swing dramatically, often triggered by seemingly minor events, making it tricky to decide which coin to buy. That's why a well-rounded analysis is key.
Here's how to make smarter crypto decisions:
- Chart the price with Supercharts: apply indicators and drawing tools, leave notes and highlight trends
- Spot opportunities with tools like the Crypto Coins Screener and Heatmap
- Explore crypto trading ideas for strategies and insights
Here's how to make smarter crypto decisions:
- Chart the price with Supercharts: apply indicators and drawing tools, leave notes and highlight trends
- Spot opportunities with tools like the Crypto Coins Screener and Heatmap
- Explore crypto trading ideas for strategies and insights
Staking in crypto is when a coin holder locks up their assets for a set period to help support the blockchain's operations, such as validating transactions. In return, they earn rewards — making staking a popular way to generate passive income from crypto holdings.
The safest choice when buying cryptocurrency is to go to a well-known crypto exchange. Some of the popular names are Binance, Coinbase, Kraken. But you'll have to find a reliable broker and create an account first. You can trade crypto right from TradingView charts — just choose a broker and connect to your account.
Before you trade, it's essential to do your research:
- Analyze the chart using technical indicators
- Stay updated with the latest market news
- Evaluate risks and test your strategy
- Be prepared for all outcomes — smart preparation leads to smarter trading
Before you trade, it's essential to do your research:
- Analyze the chart using technical indicators
- Stay updated with the latest market news
- Evaluate risks and test your strategy
- Be prepared for all outcomes — smart preparation leads to smarter trading
The largest cryptocurrencies by market capitalization are Bitcoin (1.48 T USD), Ethereum (256.78 B USD), and Tether USDt (185.44 B USD).
A coin's market capitalization is its price multiplied by the total number of coins in circulation. Watch detailed market cap charts to stay ahead of market trends.
TVL (Total Value Locked) measures the total amount of cryptocurrency held within a token's protocol. A higher TVL often signals stronger security, deeper liquidity, and greater trust from the community.
Explore the full list of coins ranked by TVL to make smarter trading decisions.
Explore the full list of coins ranked by TVL to make smarter trading decisions.
Today, coins with the biggest price growth are Humanity Protocol (13.97%), ZORA (9.26%), and River (8.97%). Check out the full list of crypto market gainers to spot market trends.
Today, coins with the biggest price loss are Zilliqa (13.10%), Irys (10.39%), and Kamino Finance (8.93%). Check out the full list of crypto market losers to spot market trends.
In crypto, dominance refers to a coin's market cap relative to the total market cap of the broader crypto market. It shows how much influence a coin has compared to the rest.
On TradingView, crypto dominance is calculated by dividing a coin's market cap by the combined market cap of the top 125 coins, then multiplying by 100. It's a useful metric to gauge a coin's relative strength and market position.
On TradingView, crypto dominance is calculated by dividing a coin's market cap by the combined market cap of the top 125 coins, then multiplying by 100. It's a useful metric to gauge a coin's relative strength and market position.
Before jumping into live crypto markets, it's smart to test your trading skills. With Paper Trading on TradingView, you can practice strategies in real time without risking real money — just click the Paper Trading icon in the trading panel.
Want to sharpen your edge even more? Try Bar Replay to simulate past price action and fine-tune your approach.
Want to sharpen your edge even more? Try Bar Replay to simulate past price action and fine-tune your approach.
Crypto prices are shaped by many of the same factors as stocks — but with a unique twist. Market sentiment is especially powerful: news about regulations, mainstream adoption, or tech upgrades can send prices soaring or crashing. For example, tweets from figures like Elon Musk have caused spikes in Bitcoin and Dogecoin, while events like China's crypto crackdown triggered sharp sell-offs.
Other key drivers include:
- Demand for a specific coin
- Technological upgrades (e.g., network forks or improvements)
- Market liquidity
- Broader economic trends like inflation or shifting interest rates
To stay ahead, use these tools to track crypto markets and spot changes early:
- Crypto Coin Screener and Heatmap
- DEX and CEX Screeners
- Latest crypto market news