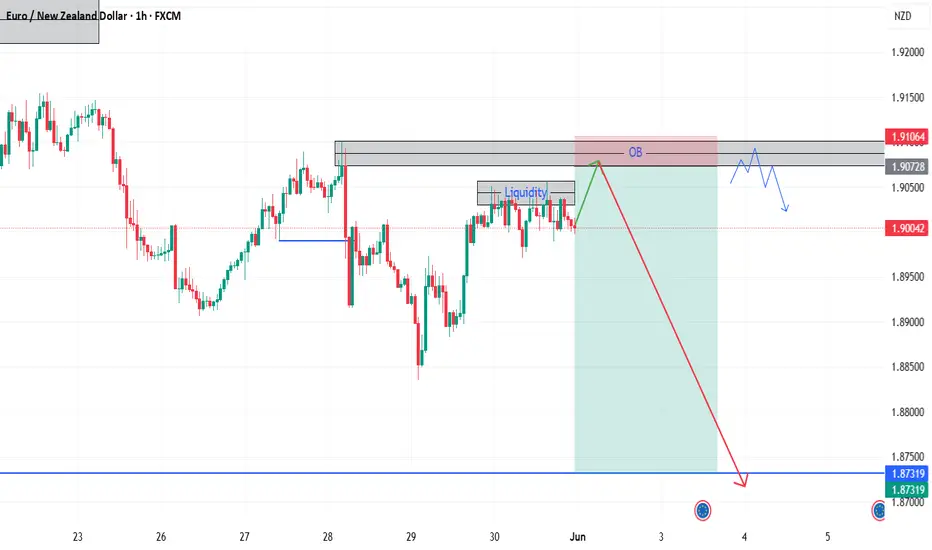
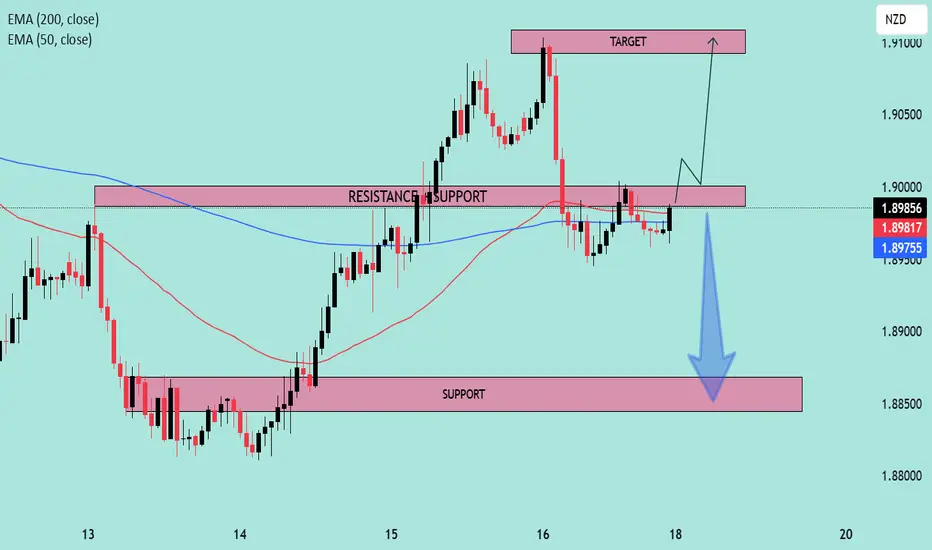
Descending Triangle Chart Pattern📘 Overview
This chart highlights a Descending Triangle pattern forming at a strong support zone.
The structure reflects ongoing selling pressure through lower highs, while buyers continue to defend the same support level.
⸻⸻⸻⸻⸻⸻⸻⸻⸻
📉 Key Price Action
• Price is forming consistent lower highs,
Euro / New Zealand Dollar
No trades
About Euro / New Zealand Dollar
The Euro vs. the New Zealand Dollar. The New Zealand dollar had performed well against the Euro recently because it is often considered to be a proxy for the Chinese growth. Eurozone weakness may limit any significant reversal if concerns about Chinese growth occurs as the country shifts from export lead growth. The NZD has benefited from the recent Euro-zone difficulties due to idle cash efforts to find strong, secure yields.
Related currencies
EURNZD MULTI TIME FRAME ANALYSISHello traders , here is the full multi time frame analysis for this stock , let me know in the comment section below if you have any questions , the position will be taken only if all rules of the strategies will be satisfied. wait for more price action to develop before taking any position. I sugge
EURNZDPrice action has been strongly bullish, with an impulsive push to the upside that took out a weekly high. That may have completed the price objective, which is why I’m now expecting a potential drop. A structure shift has already occurred and an entry was available, though I didn’t take it.
For now
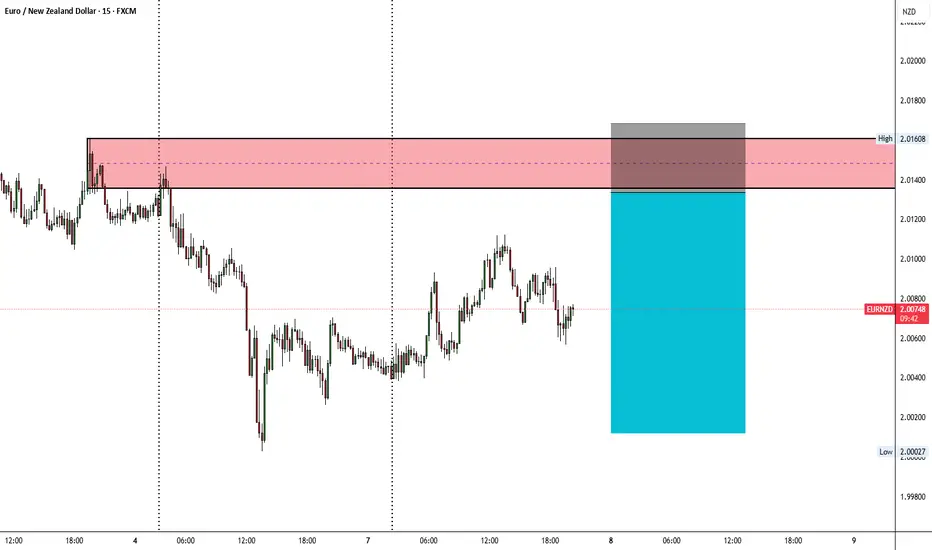
SELL ENTRY - EURNZD🔻 SELL ENTRY - EURNZD 🔻
Price has tapped into a major supply zone after a clear bearish structure.
Expecting rejection from this premium area for a continuation to the downside.
📊 Timeframe: 15 Min
📈 Setup Type: Supply Zone / Trend Continuation
🎯 Direction: SELL
⚙️ Confirmation: Bearish engulfing
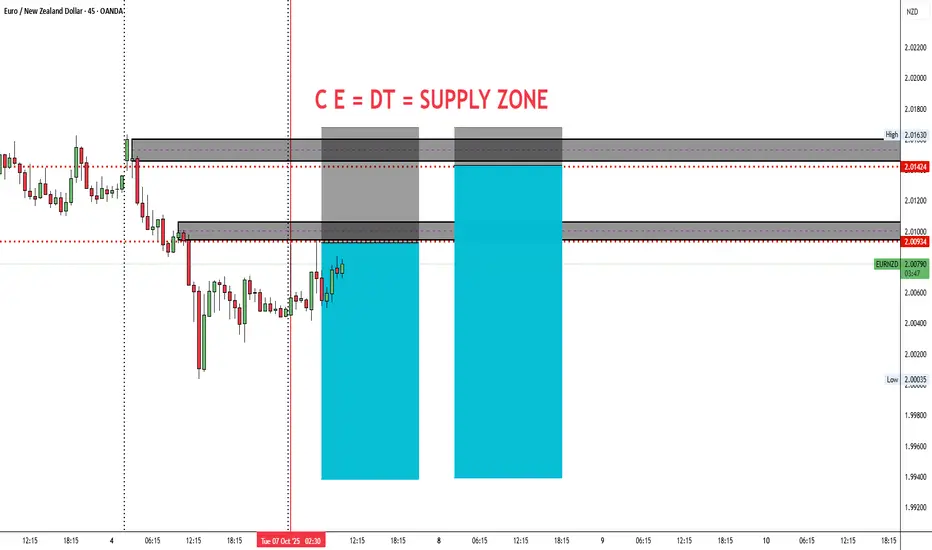
EURNZD SELL ENTRY - SUPPLY ZONE TRADE SETUP🔻 EURNZD SELL ENTRY - SUPPLY ZONE TRADE SETUP
📊 Timeframe: 45 Minutes
💡 Concept: CE = DT = Supply Zone
Price has reached the strong supply zone, where previous double top structure (DT) and change of character (CE) confirm potential bearish pressure.
Currently, price is testing the supply zone — e
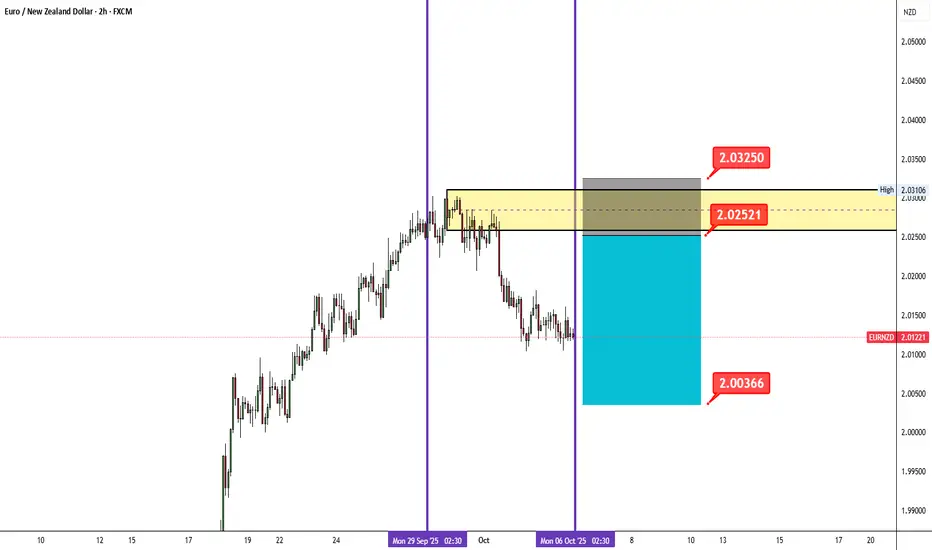
EURNZD – Bearish Setup (H2 Chart)📊 EURNZD – Bearish Setup (H2 Chart)
Pair: EURNZD
Timeframe: 2H
Bias: Short Position
🔎 Market Context:
Price recently rejected from the 2.02521 – 2.03250 resistance zone.
Sellers appear to be stepping in as bullish momentum weakens.
Structure points to a possible continuation lower if rejection
EURNZDEURNZD Market Outlook
The price on EURNZD has recently approached the 4H Supply Zone around the 1.96000 level and has flipped the short-term bearish structure, indicating potential bullish momentum. However, given the presence of supply, I'm monitoring the possibility of a retracement from this zon
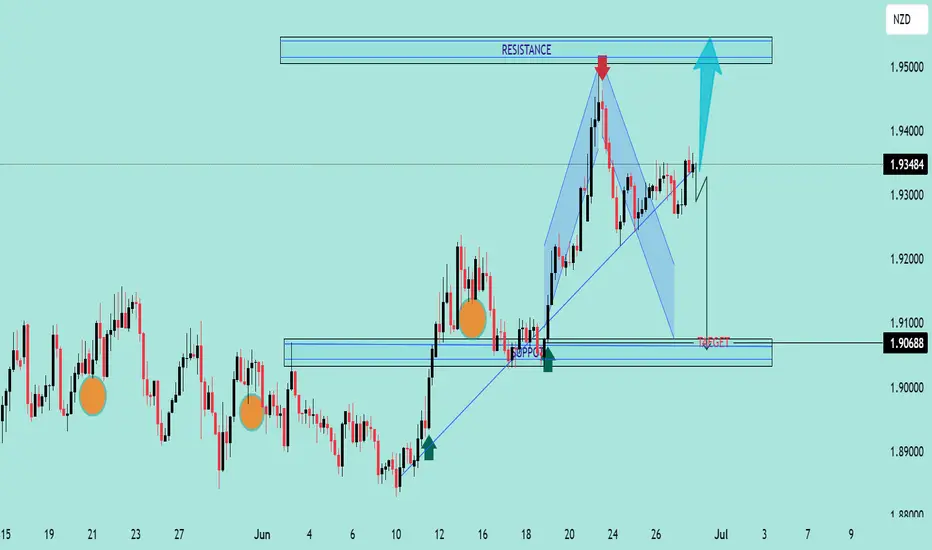
EURNZD Potential Breakout or Reversal? | Technical Analysis EURNZD Potential Breakout or Reversal? | Technical Analysis 🚀🔄
The chart illustrates a key technical setup on the EURNZD pair with both bullish and bearish possibilities depending on price action near critical zones.
🔍 Technical Highlights:
Bearish Harmonic Pattern Completed 📉
A harmonic structur
See all ideas
Summarizing what the indicators are suggesting.
Oscillators
Neutral
SellBuy
Strong sellStrong buy
Strong sellSellNeutralBuyStrong buy
Oscillators
Neutral
SellBuy
Strong sellStrong buy
Strong sellSellNeutralBuyStrong buy
Summary
Neutral
SellBuy
Strong sellStrong buy
Strong sellSellNeutralBuyStrong buy
Summary
Neutral
SellBuy
Strong sellStrong buy
Strong sellSellNeutralBuyStrong buy
Summary
Neutral
SellBuy
Strong sellStrong buy
Strong sellSellNeutralBuyStrong buy
Moving Averages
Neutral
SellBuy
Strong sellStrong buy
Strong sellSellNeutralBuyStrong buy
Moving Averages
Neutral
SellBuy
Strong sellStrong buy
Strong sellSellNeutralBuyStrong buy
Displays a symbol's price movements over previous years to identify recurring trends.
Frequently asked questions
The current rate of EURNZD is 1.983240 NZD — it has decreased by −0.14% in the past 24 hours. See more of EURNZD rate dynamics on the detailed chart.
The value of the EURNZD pair is quoted as 1 EUR per x NZD. For example, if the pair is trading at 1.50, it means it takes 1.5 NZD to buy 1 EUR.
The term volatility describes the risk related to the changes in an asset's value. EURNZD has the volatility rating of 0.52%. Track all currencies' changes with our live Forex Heatmap and prepare for markets volatility.
The EURNZD showed a 0.71% rise over the past week, the month change is a −0.55% fall, and over the last year it has increased by 4.18%. Track live rate changes on the EURNZD chart.
Learn how you can make money on rate changes in numerous trading ideas created by our community.
EURNZD is a minor currency pair, i.e. a popular pair that is not associated with USD. Such pairs are also called cross currency pairs.
Currencies are usually traded through forex brokers — choose the one that suits your needs and go ahead. You can trade EURNZD right from TradingView charts — just log in to you broker account. Check out the list of our integrated brokers and find the best one for your needs and strategy.
When deciding to buy or sell currency one should keep in mind many factors including current geopolitical situation, interest rates, and other. But before plunging into a deep research, you can start with EURNZD technical analysis. The technical rating for the pair is sell today, but don't forget that markets can be very unstable, so don't stop here. According to our 1 week rating the EURNZD shows the sell signal, and 1 month rating is buy. See more of EURNZD technicals for a more comprehensive analysis.