Tanla Platforms : Inverted Head & Shoulder in making Tanla Platforms is forming a inverted head and Shoulder pattern right shoulder . On Friday last week , the stock is just around the neckline .
The Stock just started holding above 50 and 200 DMA.
RSI daily reading is above 70 indicating a positive momentum.
Need to be watchful in next week , i

The best trades require research, then commitment.
Get started for free$0 forever, no credit card needed

Scott "Kidd" PoteetThe unlikely astronaut

Where the world does markets
Join 100 million traders and investors taking the future into their own hands.
Major indices

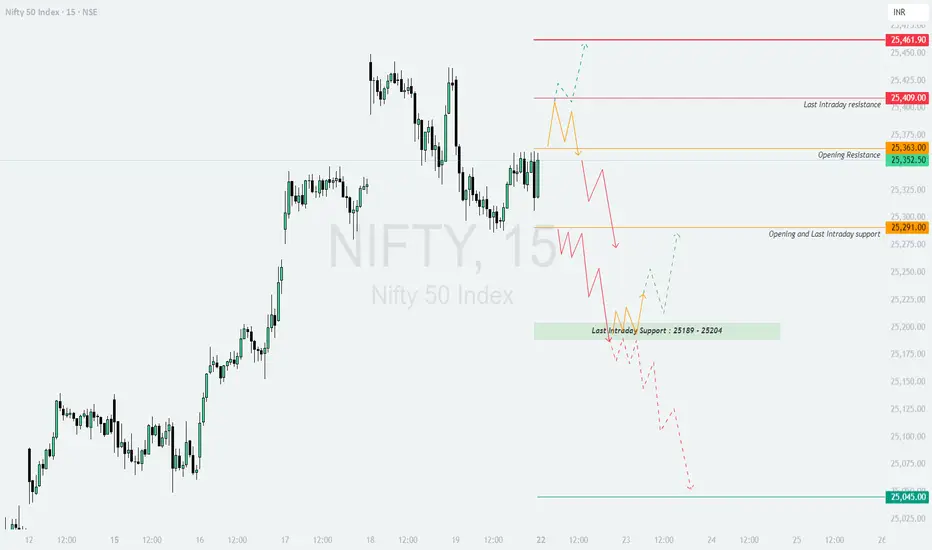
NIFTY : Trading levels and Plan for 22-Sep-2025NIFTY TRADING PLAN – 22-Sep-2025
The index closed around 25,352, with immediate opening resistance at 25,363, and higher hurdles near 25,409 (last intraday resistance) and 25,461. On the downside, supports are placed at 25,291 (opening/last intraday support) and the 25,189–25,204 zone. The critica
Positive moves on beaten down stock(Adani Green)Posititive news has come for the adani group from higher court. Adani Green is beaten down stock(may be not because of news flows but because of valuation). But now buying is there from the lower levels.
Valuations have come down in last 2-3 years(however still expensive valuation). But may be this

Sigachi’s Technical Surge: Next Resistance in SightOver the past month, Sigachi traded within a well-defined consolidation range, reflecting a period of equilibrium between buyers and sellers. However, in the most recent week, the stock decisively broke out above this consolidation zone on increased trading volume a classic signal of renewed bulli

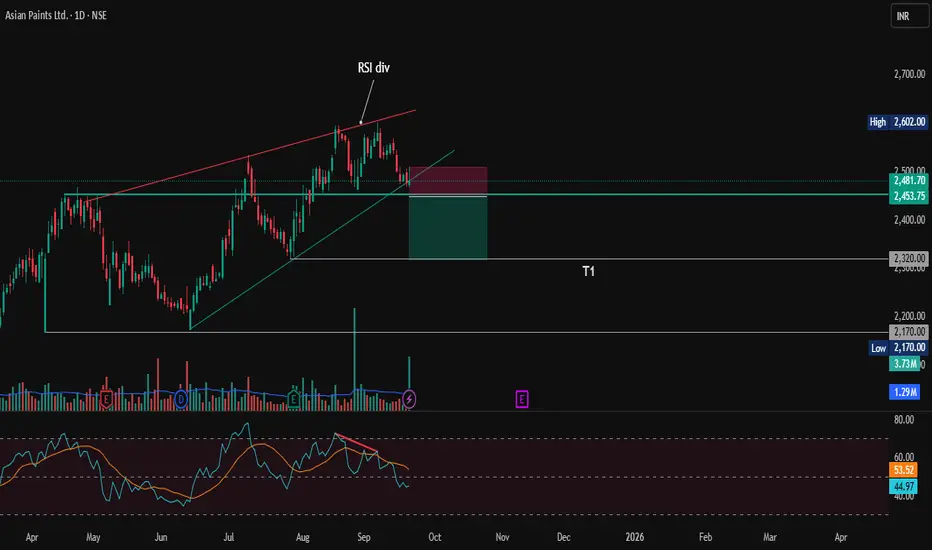
Asian Paints: Short Setup — Bearish Reversal SignalAsian Paints shows signs of a potential short opportunity after forming a bearish reversal pattern (Rising wedge) on the daily chart. The stock failed to sustain above the resistance near 2600, Formed a Double top pattern. The RSI is showing bearish divergence, signaling weakening momentum. hinting
Market Cycles I have made efforts in Explaining How Markets work in cyclical basis
once The bull Run completes , Market ideally enters in Price & Time Corrections
which enter in one of two know phases
01) Deep Price Corrections
02) Bracketed Market Price corrections
This is education content if you have

JSWSTEEL TRENDLINE BREAKOUTJSWsteel breaking trendline resistance weekly basis
good volume last few weeks
bullish RSI above 60
trading at al time high
can reach to target 1250 soon
NO BUY/SELL RECOMENDATION

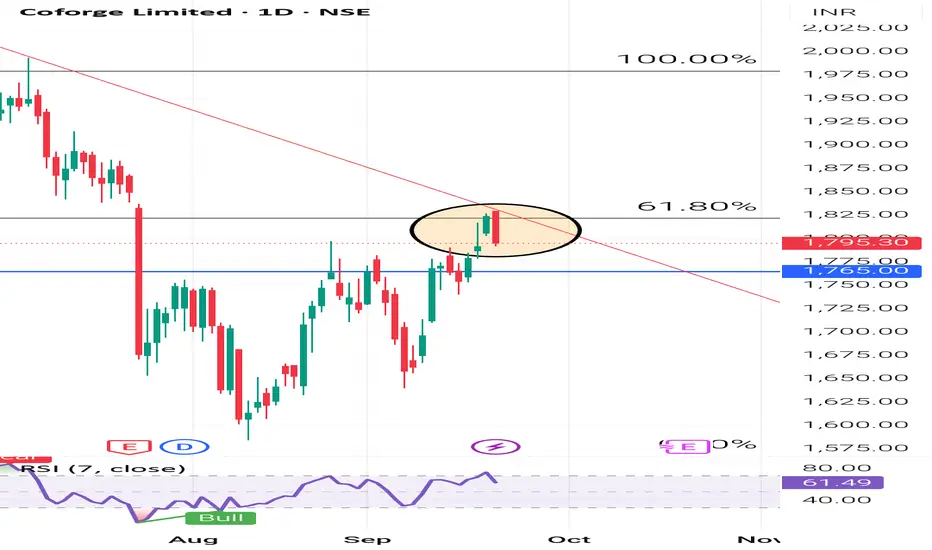
COFORGE LIMITED ( 1D ) 🔑 KEY LEVELS 🔑
✔ Fibonacci Retracement 61.80%
✔ Trend Line Act As Resistance.
✔ RSI Also Overbought Zone.
🎯 TRADING PLAN 🎯
✔ Near the key levels , Bearish Engulfing
Candlestick Pattern has formed.
✔ The Entry Point is Below @ 1792.10
✔ The Stopl
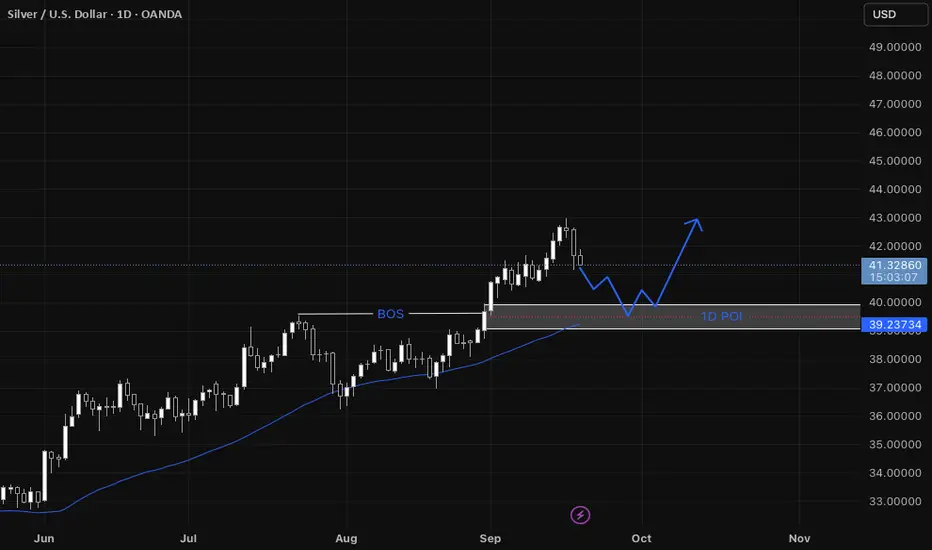
XAGUSD Step-by-step entry plan for XAGUSD
1. We have our Daily Point of Interest (POI)
- On the daily a zone that contains:
* a fair value gap (FVG),
* a break of structure (BOS) that previously acted as resistance and is now expected
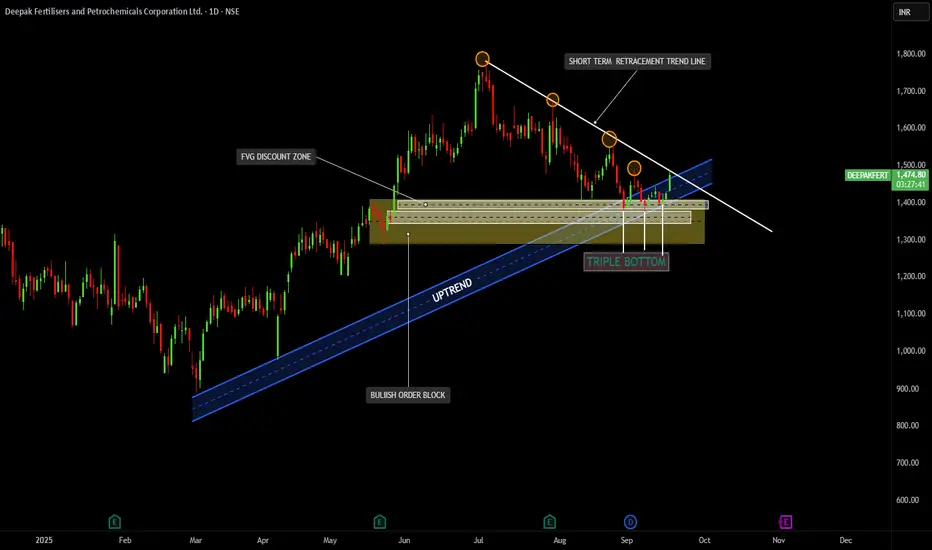
DEEPAK FERTILIZERTrend Structure:
The stock has been in a primary uptrend (marked with the blue ascending channel).
Recently, it went into a short-term retracement with a downward sloping trendline (white).
Support & Demand Zones:
Strong Bullish Order Block and FVG Discount Zone around the ₹1350 – ₹1400 level, w
See all editors' picks ideas
FiniteStateMachine🟩 OVERVIEW
A flexible framework for creating, testing and implementing a Finite State Machine (FSM) in your script. FSMs use rules to control how states change in response to events.
This is the first Finite State Machine library on TradingView and it's quite a different way to think about your

Trading Activity Index (Zeiierman)█ Overview
Trading Activity Index (Zeiierman) is a volume-based market activity meter that transforms dollar-volume into a smooth, normalized “activity index.”
It highlights when market participation is unusually low or high with a dynamic color gradient:
Light Blue → Low Activity (thin p

Expected Value Monte CarloI created this indicator after noticing that there was no Expected Value indicator here on TradingView.
The EVMC provides statistical Expected Value to what might happen in the future regarding the asset you are analyzing.
It uses 2 quantitative methods:
Historical Backtest to ground your anal

Bar Index & TimeLibrary to convert a bar index to a timestamp and vice versa.
Utilizes runtime memory to store the 𝚝𝚒𝚖𝚎 and 𝚝𝚒𝚖𝚎_𝚌𝚕𝚘𝚜𝚎 values of every bar on the chart (and optional future bars), with the ability of storing additional custom values for every chart bar.
█ PREFACE
This library aims to tackle s

Liquidity Void Detector (Zeiierman)█ Overview
Liquidity Void Detector (Zeiierman) is an oscillator highlighting inefficient price displacements under low participation. It measures the most recent price move (standardized return) and amplifies it only when volume is below its own trend.
Positive readings ⇒ strong up-move

DeltaFlow Volume Profile [BigBeluga]🔵 OVERVIEW
The DeltaFlow Volume Profile builds a compact volume profile next to price and enriches every bin with flow context : bullish vs. bearish participation (%), a per-bin Delta % , an optional Delta Heat Map , and a PoC band with the bin’s absolute volume. This lets you see not just

Volume by Time [LuxAlgo]The Volume by Time indicator collects volume data for every point in time over the day and displays the average volume of the specific dataset collected at each respective bar.
The indicator overlays the current volume and the historical average to allow for better comparisons.
🔶 USAGE
Thr

FlowScope [Hapharmonic]FlowScope: Uncover the Market's True Intent 🔬
Ever wished you could look inside the candles and see where the real action is happening? FlowScope is your microscope for the market's flow, designed to give you a powerful edge by revealing the volume distribution that price action alone can't sh

VWAP Price ChannelVWAP Price Channel cuts the crust off of a traditional price channel (Donchian Channel) by anchoring VWAPs at the highs and lows. By doing this, the flat levels, characteristic of traditional Donchian Channels, are no more!
Author's Note: This indicator is formed with no inherent use, and serves

Fibonacci Sequence Circles [BigBeluga]🔵 Overview
The Fibonacci Sequence Circles is a unique and visually intuitive indicator designed for the TradingView platform. It combines the principles of the Fibonacci sequence with geometric circles to help traders identify potential support and resistance levels, as well as price expansio

See all indicators and strategies
Community trends
Sigachi’s Technical Surge: Next Resistance in SightOver the past month, Sigachi traded within a well-defined consolidation range, reflecting a period of equilibrium between buyers and sellers. However, in the most recent week, the stock decisively broke out above this consolidation zone on increased trading volume a classic signal of renewed bulli
Positive moves on beaten down stock(Adani Green)Posititive news has come for the adani group from higher court. Adani Green is beaten down stock(may be not because of news flows but because of valuation). But now buying is there from the lower levels.
Valuations have come down in last 2-3 years(however still expensive valuation). But may be this
Tanla Platforms : Inverted Head & Shoulder in making Tanla Platforms is forming a inverted head and Shoulder pattern right shoulder . On Friday last week , the stock is just around the neckline .
The Stock just started holding above 50 and 200 DMA.
RSI daily reading is above 70 indicating a positive momentum.
Need to be watchful in next week , i
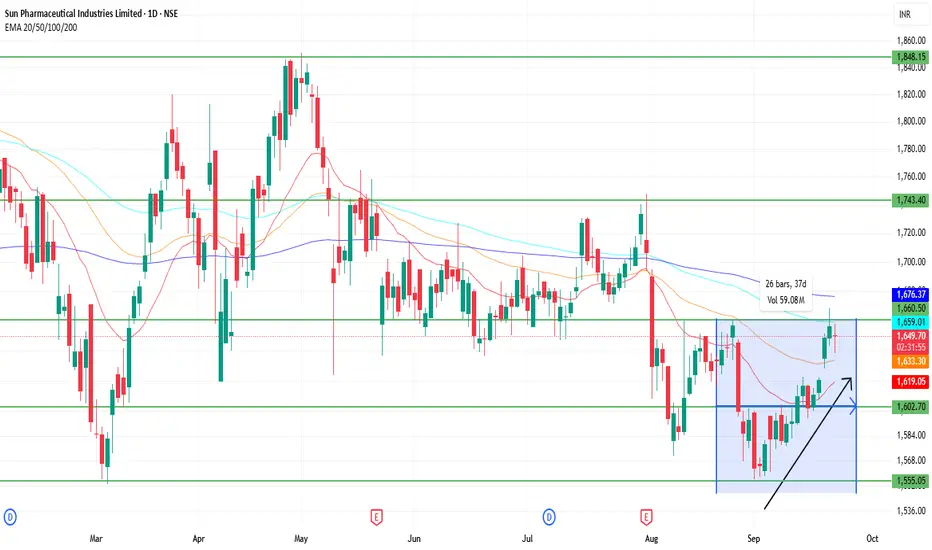
SUNPHARMA 1D Time frame🔍 Current Price
Approximately ₹1,646 – ₹1,650
🧮 Strategy / Trade Ideas
Long Setup:
If price holds above ₹1,630 – ₹1,620 and shows reversal signals (bullish candle etc.), opportunity to go long.
Target zones: first towards ₹1,655 – ₹1,660, then potentially ₹1,675 – ₹1,680.
Stop-loss could be ju
KOTAKBANK 1 Day View📈 Daily Technical Analysis (1-Day Time Frame)
Moving Averages: The stock exhibits a Strong Buy signal based on moving averages, with 10 buy signals and 2 sell signals.
Oscillators: Technical indicators suggest a Neutral stance, with no buy or sell signals.
Relative Strength Index (RSI): The 14-d

Buy, Sell, or Skip? Multi Timeframe Support ZonesUncover how support levels across multiple timeframes help clarify key buy/sell decisions—purely for technical education.
Chart used is 3 months old for educational purposes only.

small Correction This one will take some Gap down & Sharp move might occur
The stock remain Positive Out Look but one has to make sure it bounce back before
entering or Looking to Trade ,
This is again pattern that is produced during Chaos of Market
This is education content
Good luck
Asian Paints: Short Setup — Bearish Reversal SignalAsian Paints shows signs of a potential short opportunity after forming a bearish reversal pattern (Rising wedge) on the daily chart. The stock failed to sustain above the resistance near 2600, Formed a Double top pattern. The RSI is showing bearish divergence, signaling weakening momentum. hinting
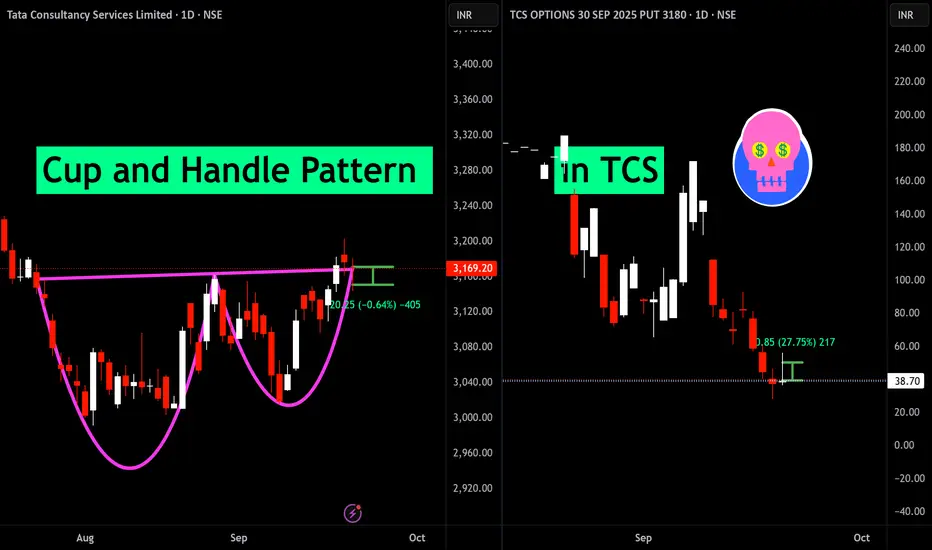
Cup and Handle Pattern failed in TCSThe cup and handle pattern has formed, but the anticipated breakout has not materialized. This failed breakout may indicate the potential for further downside movement in the stock
KPI Green - 200EMA upmoveLike Waaree KPI Green too is flirting with the 200EMA.
The management has given a strong guidance of 50-70% for this financial year.
Cross of the 200EMA could be a good entry point (Somewhere between 485 and 490) with a stoploss below 469.
If the stock moves a further addition can be made abov

See all stocks ideas
No scheduled reports
Community trends
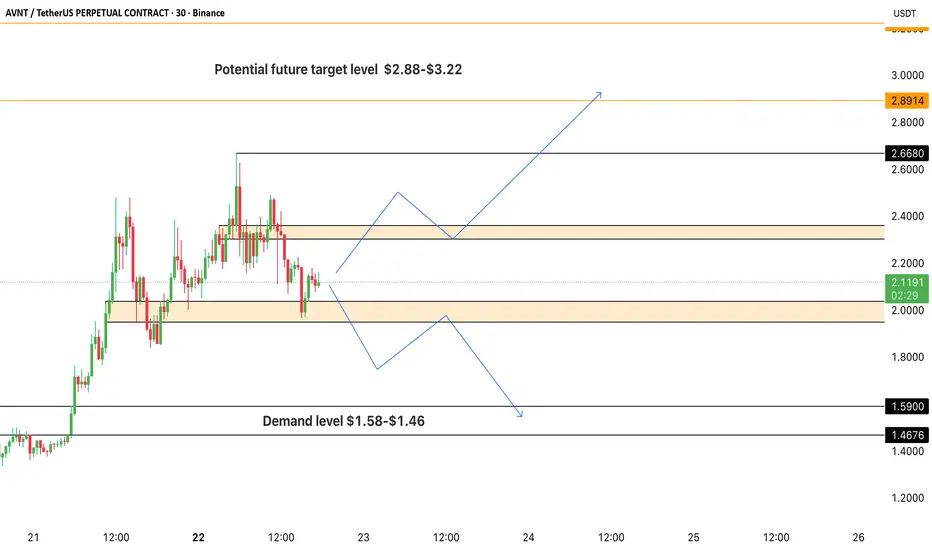
AVNT FUTURE TARGET ?!🔥 Quick Take:
After a strong rally, AVNT is consolidating near $2.00 – a key line in the sand. The next few candles could define whether bulls push higher or bears take control.
🗝 Key Levels:
• Support: $2.00 | $1.58–$1.46
• Resistance: $2.40 | $2.67 | $2.88
📉 Bias:
• Neutral → Bearish if $2.00
BTC/USD (Short Cycles)Namaskaram Everyone
BTC is in uptrend but going down in Medium cycle.
currently risk reward is not much favourable, for that you need to wait for short term cycle retracement.
If you need shorter degree chart i will update it, reply in comments.
Intraday Gear 3
Intraday Gear 2
L

A bullish outlookWaves 1, 2, and 3: The chart shows a completed impulse sequence with a long and strong Wave 3, which followed a Bull Flag continuation pattern.
Wave 4 Correction: Gold is currently believed to be in a corrective Wave 4. This correction is taking the shape of an Ascending Broadening Wedge, a pattern

Ethereum 1 Week View📊 Weekly Timeframe Technical Overview
On the weekly chart, ETH has recently achieved its highest weekly close in four years, signaling strong bullish momentum.
🔄 Key Support and Resistance Levels
Support Levels: The primary support zone lies between $4,150 and $4,200, with additional support arou

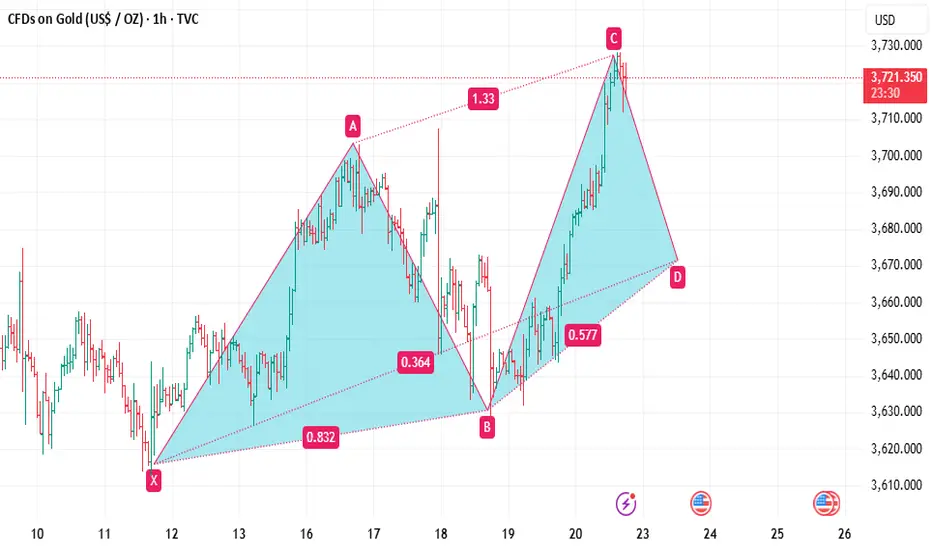
One Last Move This pattern is ideal to understand where price is increasing making higher low
when seen on Graphically representation it looks more like ending diagonal which is popular in the Financial Markets as Pattern suggest the end of ongoing momentum
I have also marked momentum indicator indicating the

ETH again in trap Zone ETH has fallen as expected in last analysis, but now it is stuck in no trade zone or trap Zone, if we plan long at fibonacci 50% retracement we can expect a short good move ,or it we only can go up after trendline breakout
Disclaimer. This idea is only for education purpose only not for trading loss

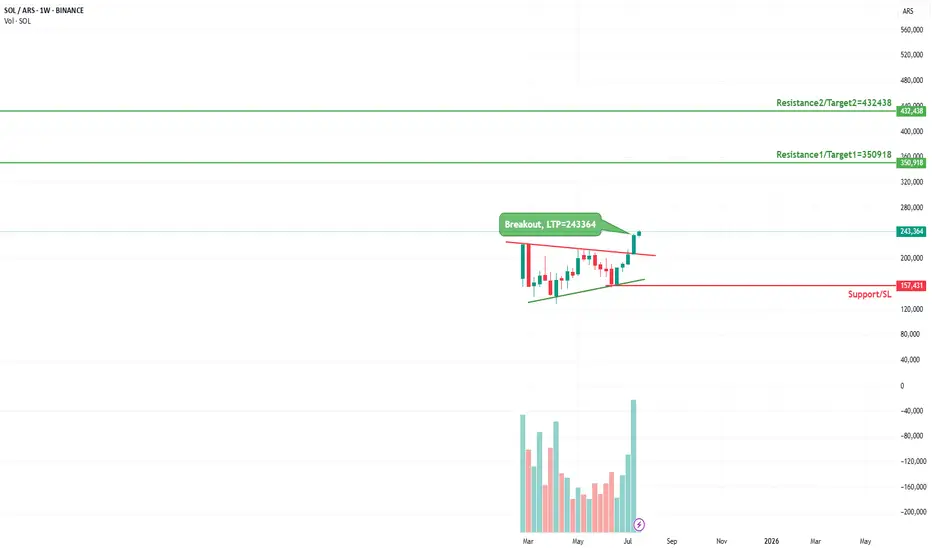
SOLARS - Breakout SetupBINANCE:SOLARS
Charts are self-explanatory. Levels of breakout, possible up-moves (where stock may find resistances) and support (close below which, setup will be invalidated) are clearly defined.

DOGEUSD SHOWING A GOOD DOWN MOVE WITH 1:6 RISK REWARDDOGEUSD SHOWING A GOOD DOWN MOVE WITH 1:6 RISK REWARD DUE TO THESE REASON
A. its following a rectangle pattern that stocked the marketwhich preventing the market to move any one direction now it trying to break the strong resistant lable
B. after the break of this rectangle it will boost the marke

BTCUSDT – Possible Bounce Back Zone Ahead?Title:
🚀 BTCUSDT – Possible Bounce Back Zone Ahead?
Description / Note:
Bitcoin is at a decisive point. If price loses the Bull Market Support Band, the next key area of interest may be the 50-week SMA, currently lining up near the $100K region.
Why it matters:
📌 The 50-week SMA has been a reliable

See all crypto ideas
GOLD WEEKPLAN: UP FIRST DOWN AFTEROANDA:XAUUSD Footprint Analysis
The Footprint chart provides a more detailed view of the order flow. Here are some key points:
Price Pullback: The recent candles show a decrease in buying pressure (green) and an increase in selling pressure (red).
Volume Footprint: The trading volume (Total) a

gold spot today will down close as per chart petterngold today will close down from friday closing . as per chart pettern
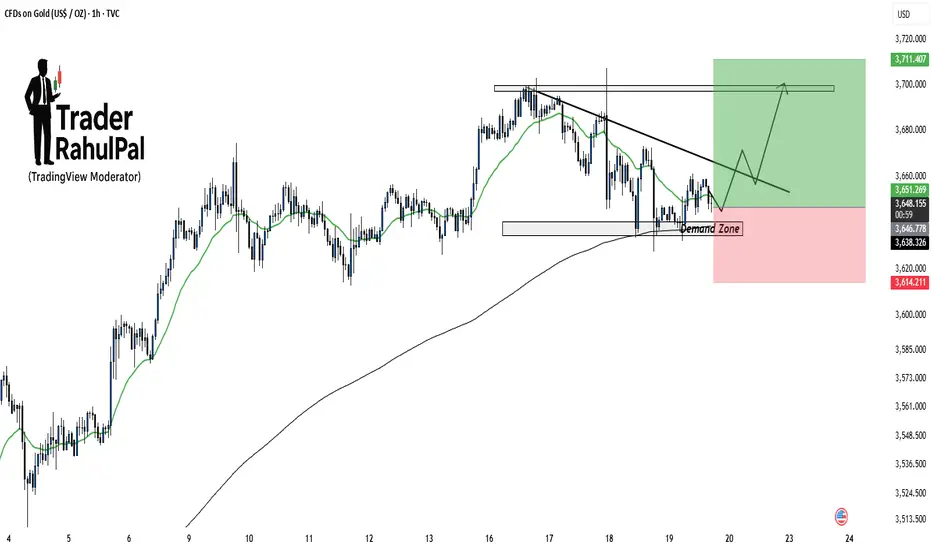
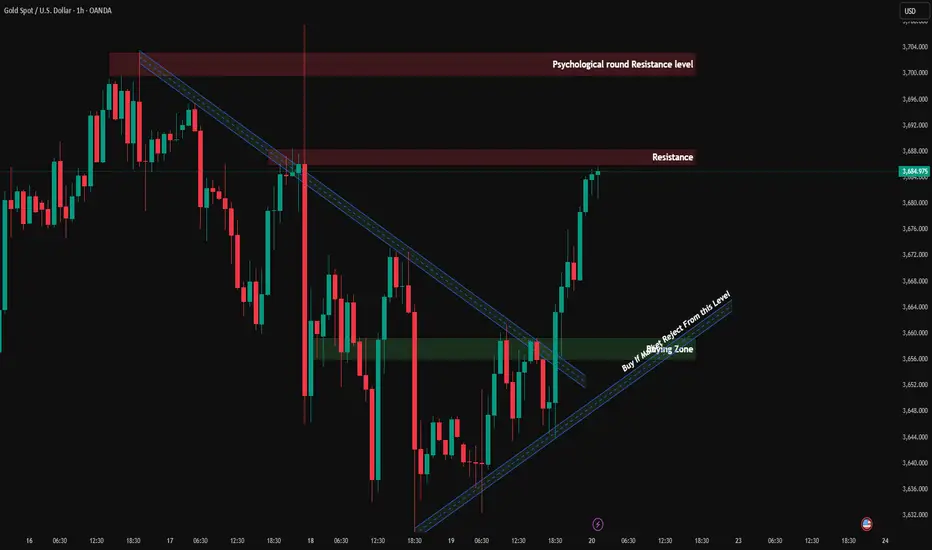
Gold Demand Zone Holding – Upside Potential Toward 3710!Gold is currently testing a demand zone around 3640–3650 , which aligns well with moving average support. As long as this zone holds, price action favors a potential bounce toward the falling trendline and eventually the key resistance area near 3710 . Short-term buyers may look for confirmation i
LiamTrading – XAUUSD Trading Scenario for TodayGold continues its robust upward momentum and is now approaching the critical resistance zone around 3,697 – 3,700. This is a confluence point with the Fibonacci extension level and also a zone where sellers might re-enter strongly.
Technical Analysis
On the H1 chart, the price has tested the resi

XAU/USD Technical Analysis: Major Levels, Market Structure, and 🔎 Current Snapshot
Price now: ~$3,684.98 per ounce.
Investing.com
Today’s trading range: ~$3,632.28 → $3,686.33.
Investing.com
Technical indicators (on sites like Investing.com) are showing a Strong Buy bias. Many moving averages & oscillators are in bullish territory.
⚙ Updated Key Levels (Su
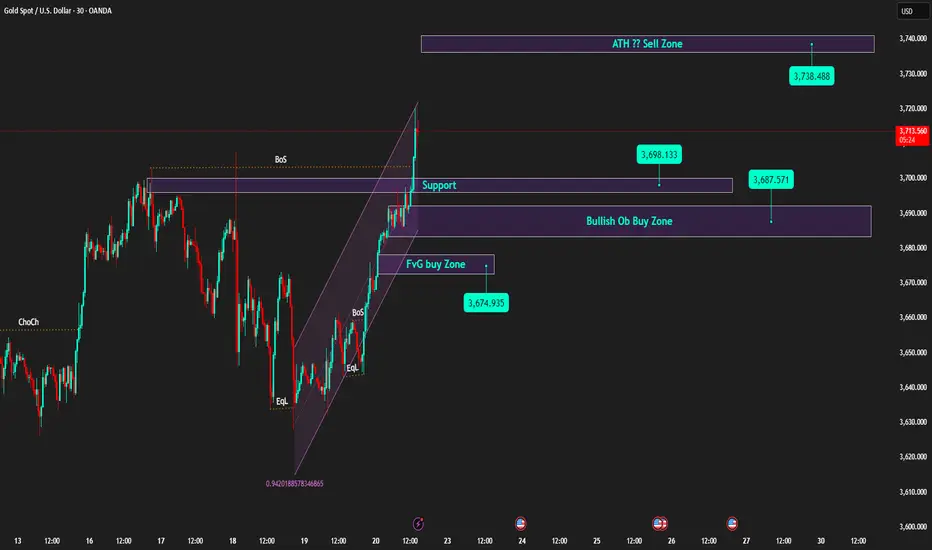
Gold Consolidating Near All-Time HighLast week Gold made a new all-time high around the 3707 level, and we have seen minor pullback after this high, leading to a pullback towards the 3620 -30 area. From there, the price bounced back strongly and is now trading close to the 3700 mark again. Currently, the market seems to be consolidatin

Weekly Candle Closes High | Prioritise Buying on Pullback to Sup🟡 XAU/USD – 22/09 | Captain Vincent ⚓
🔎 Captain’s Log – Quick Overview
Last week, gold closed around 3,685, paving the way for further advancement and a new ATH.
After the FED cut 25bps, Powell's 'brake' remarks slowed the rise, but the larger trend remains bullish.
This morning, prices surged t
XAUUSD – The Decisive Zone and Trading ScenariosTechnical Analysis
Gold prices on the H4 chart are in a recovery phase after retesting the support at 3,661–3,662. The latest candle has rebounded strongly to the 3,684 zone, yet the structure still indicates a clear tug-of-war.
The upward trendline was breached in the previous decline, and curren

XAUUSD-UPCOMING PROBALBE DIRECTIONAL ANALYSIS1. We can see a retracement in XAUUSD upto retesting area.
2. Also the move take more time as compaired to previous uptrend, means we can't see clear downtrend here.
3. The lines marked at chart are the characters of the trend, means we can see a bit candle which cross the line.
4. The characters ar

Natural Gas longWe can plan natural Gas long position for a short term with very small Stoploss and small target
But risk reward ratio is high
Disclaimer; for education purpose only

See all futures ideas
GBP/AUD WEEKPLAN: Best Sell Zone Short StoplossFootprint Analysis OANDA:GBPAUD
Previous Trend: The candles before the 18th showed an uptrend. Specifically, the candle on the 17th had a strong positive Delta (+5.24K), with the buy volume (green) dominating the sell volume (red) at most price levels. This confirms that buyers were in control a

EURAUD Bearish SetupIf we look at H4 chart of ICMARKETS:EURAUD , it made a great reversal and formed a bearish Engulf at 70% Fib Level.
The H4 timeframe is forming a slid rationality to be bearish on H1 timeframe. The targets may take a week or so to hit while the SL may hit within a few days.
On H1 timeframe the MAC

EURO - PLAN FOR TODAYMIL:EURO - I am bearish on D - tf but currently i am looking for a quick retracement during UK Open to fill some upper limits.

AUDNZD Trading Idea – Momentum & Liquidity OutlookThe pair has been in a clear expansion phase, showing strength after multiple structure breaks. Momentum has favored the upside, while recent consolidation reflects market participants taking profits and rebalancing orders.
A corrective wave appears to be unfolding, which is typical after strong im

You going to lossI need daily candle close on the black Box.. then I am looking for sell if I get my entry signals

GBPUSD – Intraday Buy Setup on 15mMarket Context
Daily: Still bearish, overall higher-timeframe pressure is down.
4H: Price reacted and bounced from a clear Bullish Order Block (OB).
1H + 15m: Both showing bullish momentum and structure shift.
Trade Plan
We are looking for a day trade buy opportunity aligned with the short-term bull

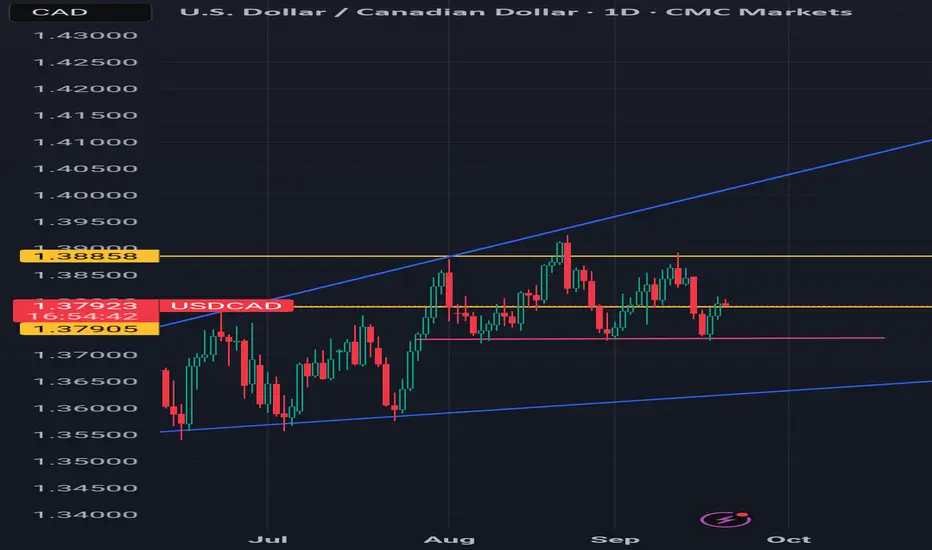
USD CAD 3 top head and shoulders pattern on daily candle A valid fair value gap detected and price is now continuously pusing downwards
selling Eurusddaily time frame market is bullish
4hr = bearish
1hr = bearish
entry at 50% area of 1hr timeframe

See all forex ideas
| - | - | - | - | - | - | - | - | ||
| - | - | - | - | - | - | - | - | ||
| - | - | - | - | - | - | - | - | ||
| - | - | - | - | - | - | - | - | ||
| - | - | - | - | - | - | - | - | ||
| - | - | - | - | - | - | - | - | ||
| - | - | - | - | - | - | - | - | ||
| - | - | - | - | - | - | - | - | ||
| - | - | - | - | - | - | - | - |
Trade directly on the supercharts through our supported, fully-verified and user-reviewed brokers.


