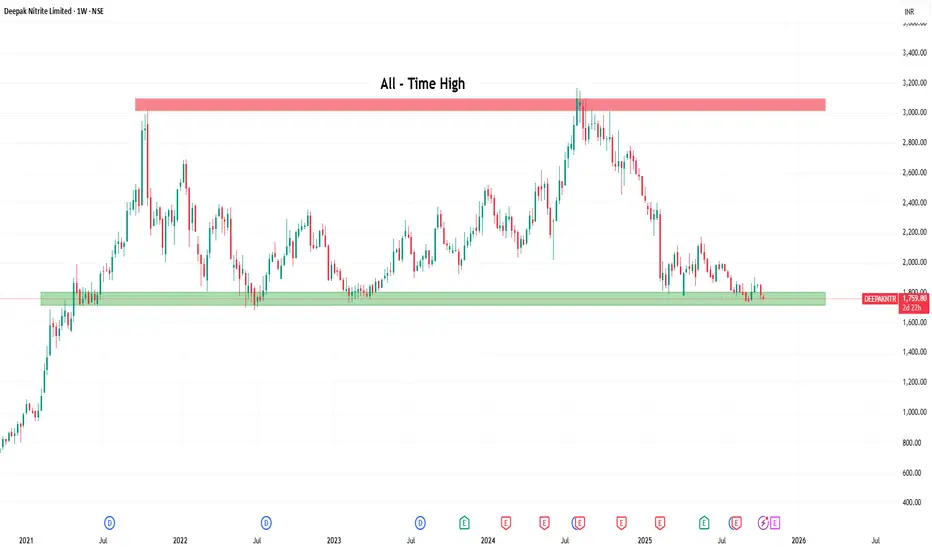
Deepak Nitrite Ltd: At a Crossroad After a Decade-long Rally🔍 Technical Analysis
Deepak Nitrite has experienced an extraordinary rally over the past decade—from below ₹100 to a peak near ₹3,000 in October 2021. The ₹3,000–₹3,200 zone has repeatedly acted as resistance, while the ₹1,700–₹1,800 range has served as a strong support zone. Currently, the stock

The best trades require research, then commitment.
Get started for free$0 forever, no credit card needed

Scott "Kidd" PoteetThe unlikely astronaut

Where the world does markets
Join 100 million traders and investors taking the future into their own hands.
Major indices
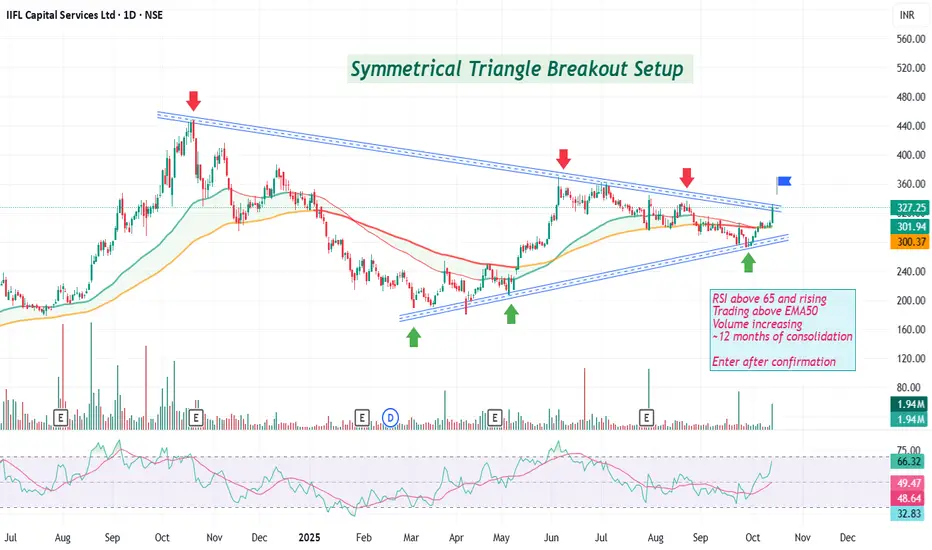
Keep IIFL Capital Service on your watchlist Symmetrical Triangle Breakout Setup
RSI above 65 and rising
Trading above EMA50
Volume increasing
~12 months of consolidation
Enter after confirmation
Disc: For study, not a recommendation. DYOR
Daily Analysis NIFTY: 13/10/25The range of 25220 to 25185 is the range where bulls and bears will decide the next set of plans.
I have explained in detail how and why prices will take a turn; hence, it will be more of a casual analysis with in-depth levels of Nifty.

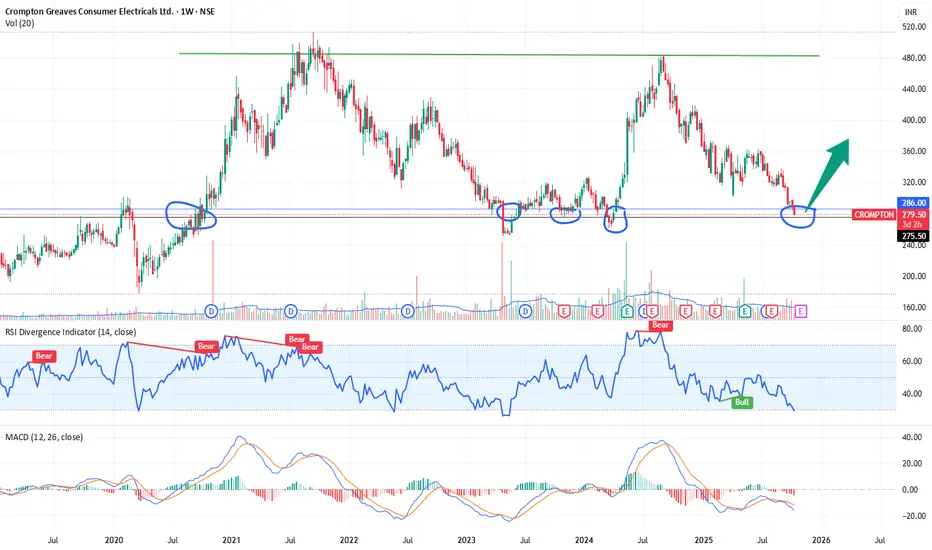
Crompton 52-Week Low Reversal Setup – Oversold Swing Trade1. Price Action
The stock is trading around ₹279–₹286, which is exactly at its 52-week low and a historical support zone from mid-2022.
Previous rebounds from this same area have led to 30–40% upside swings, indicating it’s a well-tested demand zone.
2. RSI (Relative Strength Index)
RSI at 23.8 → c
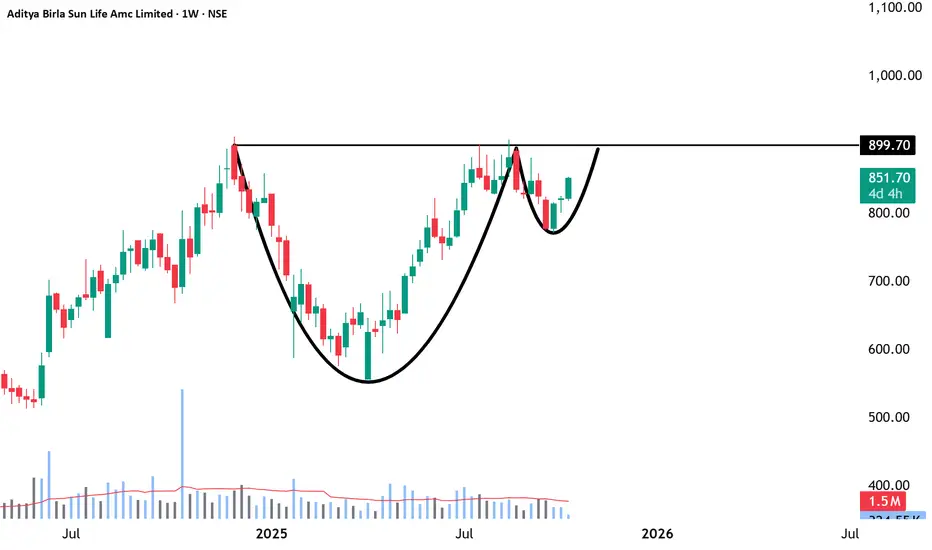
Aditya Birla Sun Life AMC-Built to Compound, Poised to BreakoutNSE:ABSLAMC
🔹 Fundamental Overview
Business Strength—One of India’s leading asset management companies, part of the Aditya Birla Group; operates across mutual funds, PMS, and AIF segments.
Financial Health – Debt-free balance sheet with excellent profitability and high cash reserves.
Profitab
VBL Looking Bearish??!!!VBL - On Weekly timeframe,
Inverted cup&handle pattern and a breakdown visible!!! (shown below)
On Dailytimeframe,
VBL is travelling inside a Descending channel pattern making highs and lowerhighs...lows and lowerlows...
SL & Target levels shown @ chart!!!
Let's wait & watch!!!
Thank you

PGEL: Suggest Momentum ShiftPG Electroplast Ltd. (PGEL) has recently shown signs of emerging strength after a prolonged phase of consolidation. Over the last two trading sessions, the stock has demonstrated upward momentum, suggesting a possible attempt to break out of its range-bound structure. This observation is supported

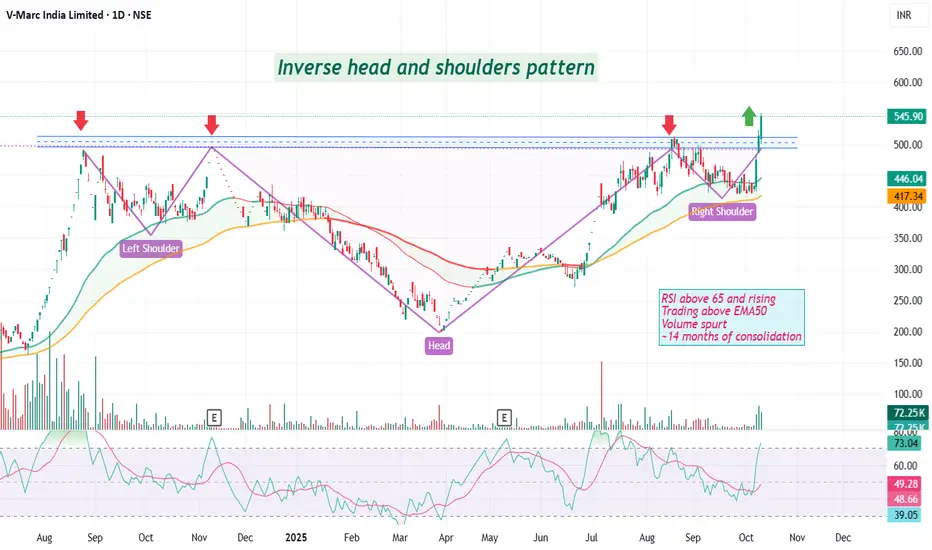
Breakout in V-Marc IndiaInverse head and shoulders pattern
RSI above 65 and rising
Trading above EMA50
Volume spurt
near14 months of consolidation
Disc: for study, not a recommendation. DYOR
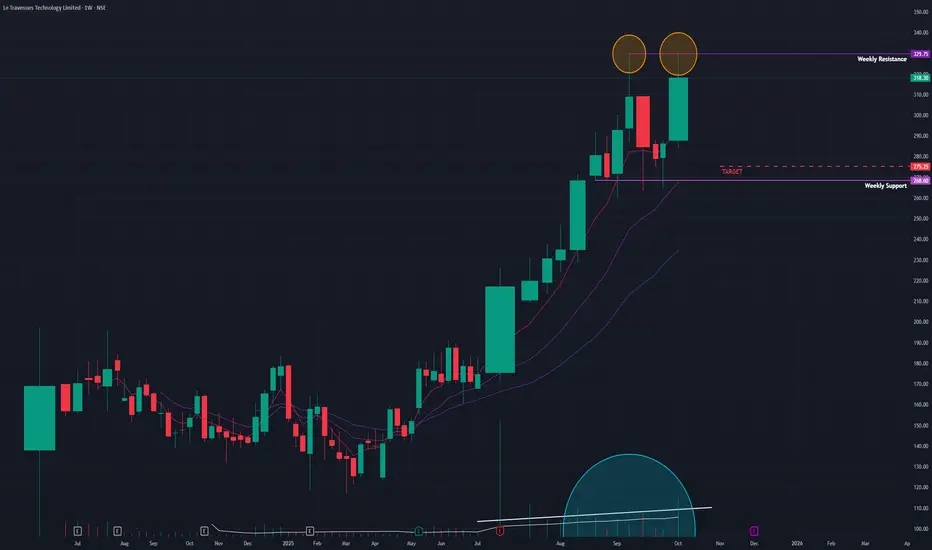
Ixigo (W) - At a Crossroad: Bullish Trend vs. Bearish PatternAfter a spectacular run-up, Ixigo (Le Travenues Technology Ltd) has entered a sideways consolidation phase. The current price action presents conflicting technical signals, placing the stock at a critical inflection point where it could either be pausing before another surge or forming a major top
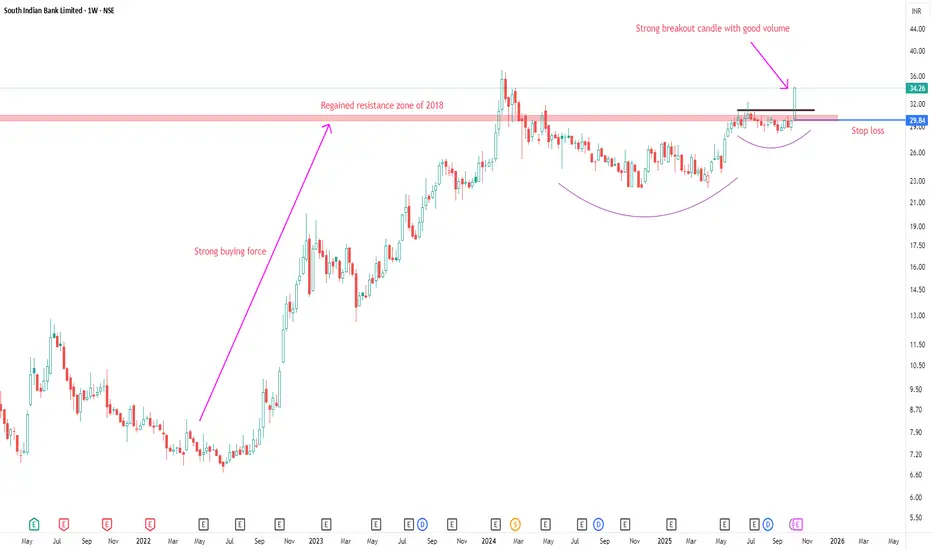
SOUTH INDIAN BANK LTD ANALYSISFOR LEARNING PURPOSE
SOUTH INDIAN BANK LTD- The current price of SOUTH INDIAN BANK is 34.26 rupees
I am going to buy this stock because of the reasons as follows-
1. Its making 52W high with some good volume (sign of strength)
2. It got a great buying force and moved up by 440% in 2022-2023
See all editors' picks ideas
Dynamic Equity Allocation Model"Cash is Trash"? Not Always. Here's Why Science Beats Guesswork.
Every retail trader knows the frustration: you draw support and resistance lines, you spot patterns, you follow market gurus on social media—and still, when the next bear market hits, your portfolio bleeds red. Meanwhile, institution

First Passage Time - Distribution AnalysisThe First Passage Time (FPT) Distribution Analysis indicator is a sophisticated probabilistic tool that answers one of the most critical questions in trading: "How long will it take for price to reach my target, and what are the odds of getting there first?"
Unlike traditional technical indicators

PongExperience PONG! The classic arcade game, now on your charts!
With this indicator, you can finally achieve your lifelong dream of beating the Markets. . . at PONG!
Pong is jam-packed with features! Such as:
2 Paddles
A moving dot
Floating numbers
The idea of a net
This indicator is solel

Options Max Pain Calculator [BackQuant]Options Max Pain Calculator
A visualization tool that models option expiry dynamics by calculating "max pain" levels, displaying synthetic open interest curves, gamma exposure profiles, and pin-risk zones to help identify where market makers have the least payout exposure.
What is Max Pain?
Max

Volume Profile 3D (Zeiierman)█ Overview
Volume Profile 3D (Zeiierman) is a next-generation volume profile that renders market participation as a 3D-style profile directly on your chart. Instead of flat histograms, you get a depth-aware profile with parallax, gradient transparency, and bull/bear separation, so you can see w

RiskMetrics█ OVERVIEW
This library is a tool for Pine programmers that provides functions for calculating risk-adjusted performance metrics on periodic price returns. The calculations used by this library's functions closely mirror those the Broker Emulator uses to calculate strategy performance metrics (

Simple Decesion Matrix Classification Algorithm [SS]Hello everyone,
It has been a while since I posted an indicator, so thought I would share this project I did for fun.
This indicator is an attempt to develop a pseudo Random Forest classification decision matrix model for Pinescript.
This is not a full, robust Random Forest model by any stretch o

Tick CVD [Kioseff Trading]Hello!
This script "Tick CVD" employs live tick data to calculate CVD and volume delta! No tick chart required.
Features
Live price ticks are recorded
CVD calculated using live ticks
Delta calculated using live ticks
Tick-based HMA, WMA, EMA, or SMA for CVD and price
Key tick levels (S

analytics_tablesLibrary "analytics_tables"
📝 Description
This library provides the implementation of several performance-related statistics and metrics, presented in the form of tables.
The metrics shown in the afforementioned tables where developed during the past years of my in-depth analalysis of various str

Adaptive Trend Classification: Moving Averages [InvestorUnknown]Adaptive Trend Classification: Moving Averages
Overview
The Adaptive Trend Classification (ATC) Moving Averages indicator is a robust and adaptable investing tool designed to provide dynamic signals based on various types of moving averages and their lengths. This indicator incorporates multipl

See all indicators and strategies
Community trends
Deepak Nitrite Ltd: At a Crossroad After a Decade-long Rally🔍 Technical Analysis
Deepak Nitrite has experienced an extraordinary rally over the past decade—from below ₹100 to a peak near ₹3,000 in October 2021. The ₹3,000–₹3,200 zone has repeatedly acted as resistance, while the ₹1,700–₹1,800 range has served as a strong support zone. Currently, the stock
Crompton 52-Week Low Reversal Setup – Oversold Swing Trade1. Price Action
The stock is trading around ₹279–₹286, which is exactly at its 52-week low and a historical support zone from mid-2022.
Previous rebounds from this same area have led to 30–40% upside swings, indicating it’s a well-tested demand zone.
2. RSI (Relative Strength Index)
RSI at 23.8 → c
MAP MY INDIA Looks like a trend reversal, supported by good volumes.
Any weekly close above 2200 confirms it.
Keep it in your watch list.

BUY TODAY SELL TOMORROW for 5%DON’T HAVE TIME TO MANAGE YOUR TRADES?
- Take BTST trades at 3:25 pm every day
- Try to exit by taking 4-7% profit of each trade
- SL can also be maintained as closing below the low of the breakout candle
Now, why do I prefer BTST over swing trades? The primary reason is that I have observed that

Keep IIFL Capital Service on your watchlist Symmetrical Triangle Breakout Setup
RSI above 65 and rising
Trading above EMA50
Volume increasing
~12 months of consolidation
Enter after confirmation
Disc: For study, not a recommendation. DYOR
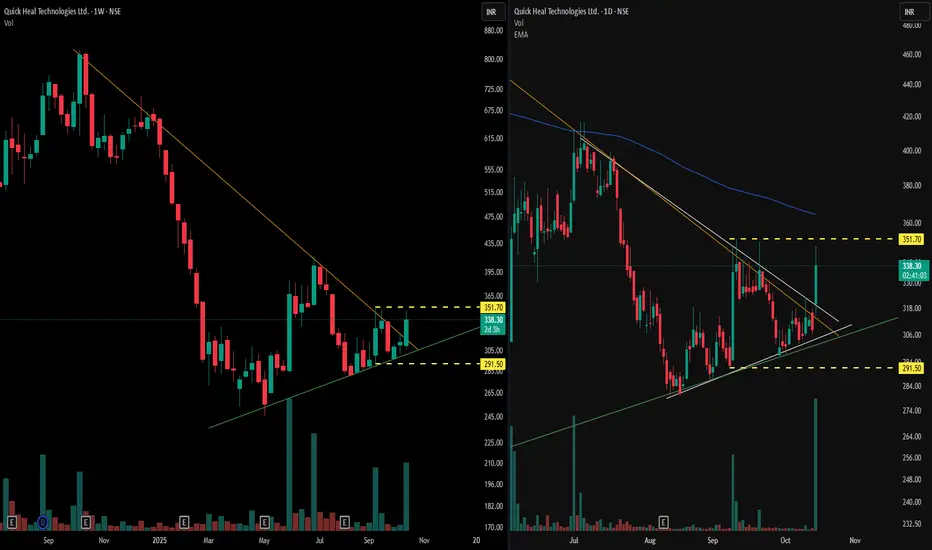
Multi-Timeframe VCP Observations📊 Weekly Time Frame Observations (left panel)
- It displays a visible pattern contraction structure, specifically a Volatility Contraction Pattern (VCP), formed over multiple months
- An orange trendline marking the descending resistance, and a green line depicting the rising support, which togethe
Don’t Miss This Rare MCX Setup Breakout + Retest= Big Move AheadHello Traders!
Today’s analysis is on MCX Ltd., where we just spotted a powerful Descending Triangle Breakout . After weeks of consolidation, the price has finally broken the falling resistance and even retested the breakout zone. This setup often leads to a strong trending move.
Why this setup i

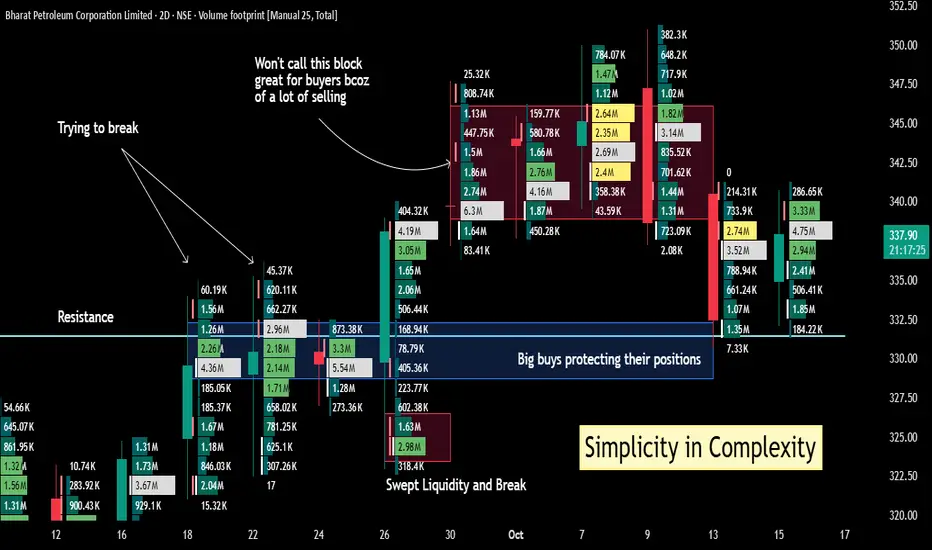
Simple Interpretation of Volume Footprint ChartsVolume footprint charts can be called as 'the eyes and ears' of the market. They truly reveal where the big orders are getting executed, the outcome of those orders and the possible future course of action.
To keep things simple, we may breakdown volume footprint charts with just two interpretation
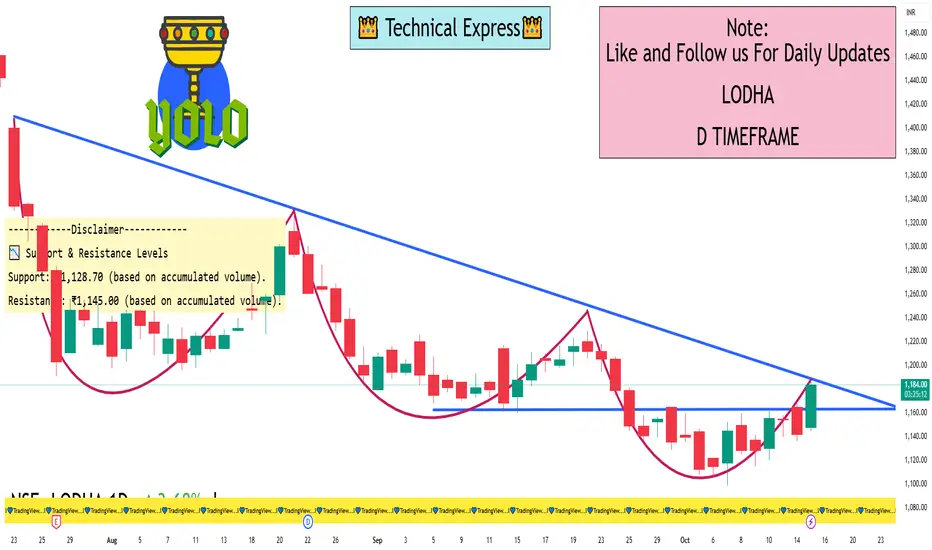
LODHA 1 Day View 📈 Current Price & Trend
Current Price: ₹1,184.90
Day's Range: ₹1,136.50 – ₹1,168.00
Previous Close: ₹1,142.00
Price Change: +₹42.90 (+3.77%)
The stock has shown a positive movement today, indicating a potential short-term bullish trend.
🔍 Technical Indicators
RSI (14-day): Approximately 51, s
#CARRARO - Large Base BreakOut Script: CARRARO
Key highlights: 💡⚡
📈 VCP BreakOut in Daily Time Frame
📈 Volume spike during Breakout
📈 Large Base BreakOut
📈 MACD Bounce
📈 Can go for a swing trade
BUY ONLY ABOVE 514 DCB
⏱️ C.M.P 📑💰- 507
🟢 Target 🎯🏆 – 24%
⚠️ Stoploss ☠️🚫 – 12%
⚠️ Important: Market conditions are Okish, Positi

See all stocks ideas
Tomorrow
WIPROWipro Limited
Actual
—
Estimate
3.14
INR
Tomorrow
INFYInfosys Limited
Actual
—
Estimate
17.47
INR
Tomorrow
DBCORPDB Corp. Ltd.
Actual
—
Estimate
—
Tomorrow
WAAREEENERWAAREE Energies Limited
Actual
—
Estimate
30.40
INR
Tomorrow
KIRLPNUKirloskar Pneumatic Co. Ltd.
Actual
—
Estimate
11.60
INR
Tomorrow
CIEINDIACIE Automotive India Ltd
Actual
—
Estimate
2.70
INR
Tomorrow
SHAKTIPUMPShakti Pumps (India) Limited
Actual
—
Estimate
—
Tomorrow
AURUMAurum Proptech Limited
Actual
—
Estimate
−1.30
INR
See more events
Community trends
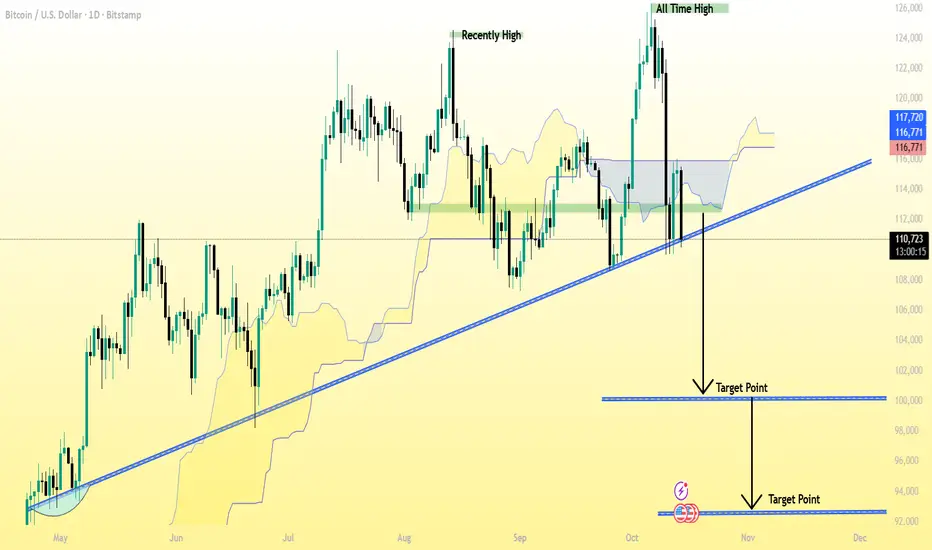
BTC/USD (Bitcoin) 1D (Daily) chart Pattern.BTC/USD (Bitcoin) 1D (Daily) chart 👇
✅ Current Price: around $110,685
✅ Trend: Bearish breakdown — price has clearly broken below the long-term ascending trendline.
✅ Market structure: After rejecting near $117,000, BTC dropped below both the Ichimoku cloud and the trendline — confirming downside p
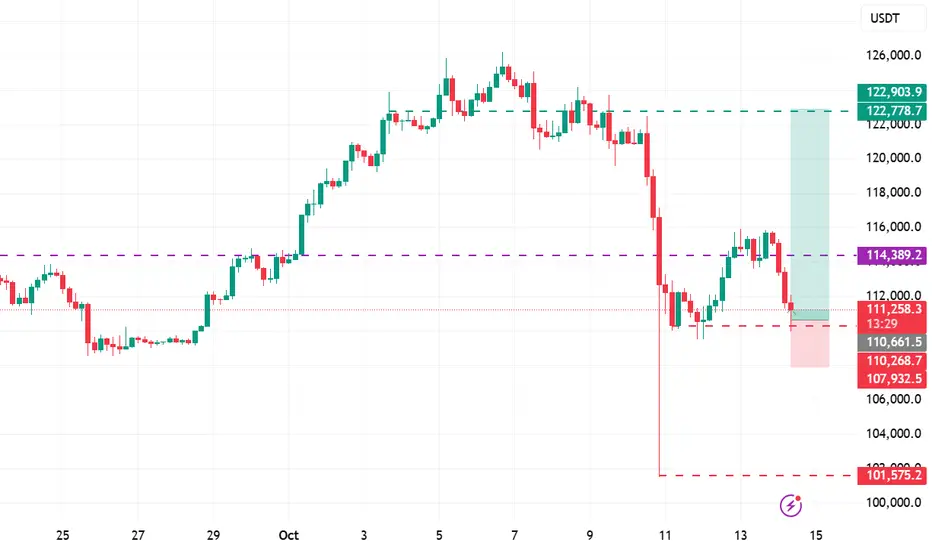
Bitcoin LTF Analysis & Market OutlookBitcoin LTF Analysis & Market Outlook
#Bitcoin still doesn’t look strong on LTF, and I’m expecting some more downside movement in the coming days. So if you’re holding high leverage longs, manage them carefully and always use strict stop loss.
Here’s the key structure to watch:
Resistance 1: $116

[SeoVereign] BITCOIN BEARISH Outlook – October 13, 2025As of October 13th, I would like to share my bearish outlook on Bitcoin.
The first basis is the Shark pattern within the 1.13–1.414 range.
The Shark pattern, established by Scott Carney, is a modified harmonic pattern that defines its PRZ (Potential Reversal Zone) within the 1.13–1.414 XA extension

BTC Major Support Around 75kBitcoin has been on a Non Stop Rally and its time to cool down.
Around 100k - Phsycological support.
Around 75k - Major Support / Bottom

bitcoin to retest back for FVGBitcoin reversal pattern after a massive sell showing an upward trendtogo cover the FVG.
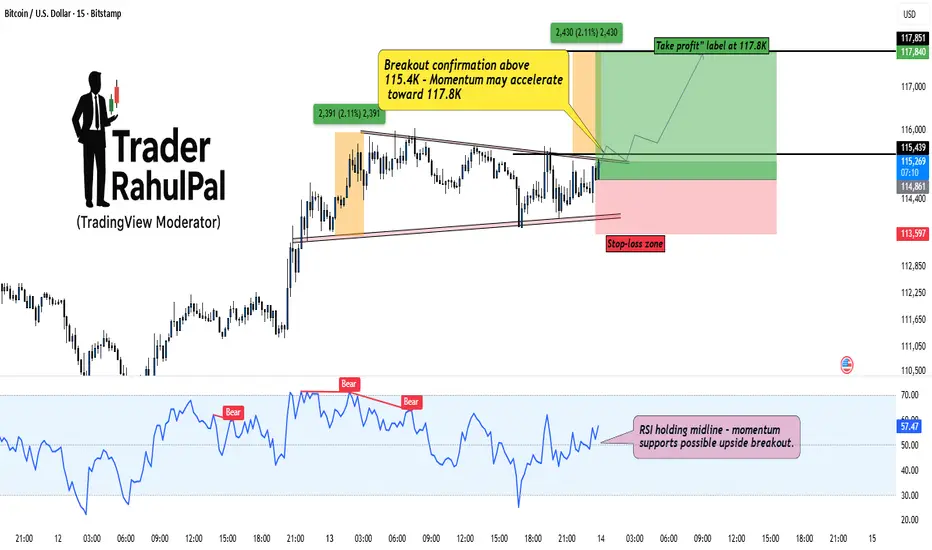
BTC – Building Discounted Longs Before the Breakout?Bitcoin (BTCUSD) is currently consolidating within a tight compression zone, showing signs of accumulation near 114.8K–115.4K . The market is coiling up right under resistance, hinting that a potential breakout could be around the corner.
As seen on the chart, structure remains bullish with a we
BTC HOURLY SUPPORT/RESISTANCE FOR THE DAY ONLYThere is plot of two GANN FAN.
I marked here support and resistance in red and green color you can follow if interested this is my analysis on the basis of chart .
here a table is drawn in which cordinates of fans are mentioned so that you can plot it easily on your chart.
Note:- If support get

BTCUSD SELL LIMIT TRADE PLAN Trade Setup: BTCUSD – Sell Limit*
I'm looking to short BTCUSD around the **$111,800 – $112,000** zone. Price is reacting off a descending trendline and rejecting from the **0.5–0.618 fib retracement** of the last leg down — showing signs of weakening bullish momentum.
*Reason for Entry*
Strong do

ZECUSDT - HOLDING STRONG AMID MARKET WIDE LIQUIDATIONSSymbol - ZECUSDT
CMP - 267.18
ZECUSDT has demonstrated notable resilience amid the broader cryptocurrency market downturn, which triggered over $10 billion in long position liquidations. Even in such an environment, certain assets have managed to withstand the selling pressure.
The cryptocurrency

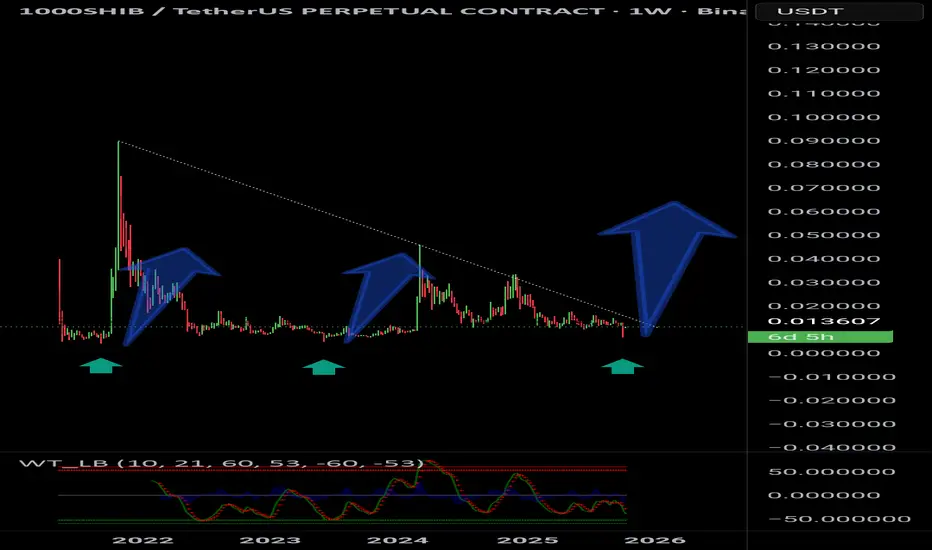
SHIBUSDT – History Repeats Itself? Big Move Incoming📈 SHIBUSDT – History Repeats Itself? Big Move Incoming! 🚀
Target 🎯: 0.1000
Stop Loss 🛑: 0.0062
🔍 On the weekly chart, every flash crash marked with a green arrow has historically led to a massive pump in SHIB – and it's happened not once, but twice before. The pattern is clear:
Crash ➡ Consolidat
See all crypto ideas
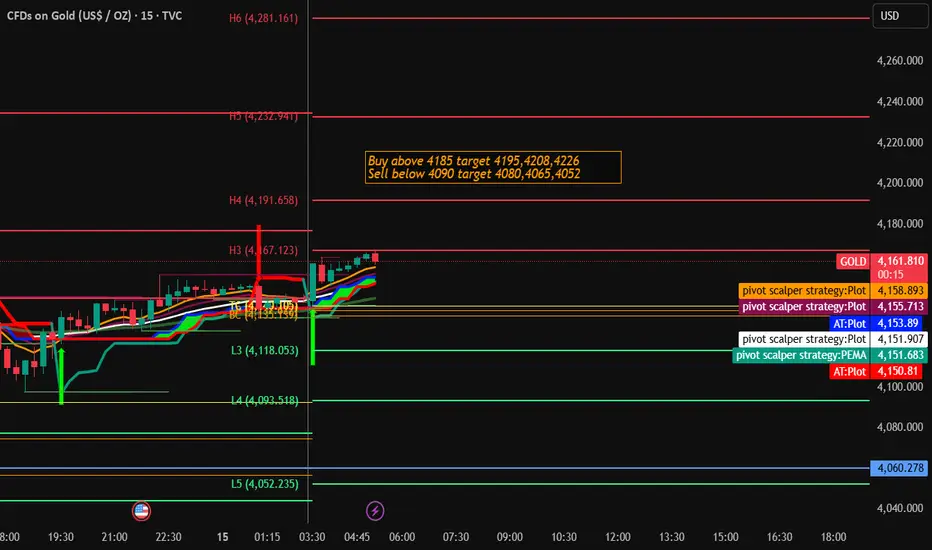
Gold Trading Strategy for 15th October 2025📊 GOLD INTRADAY TRADE PLAN
💰 Buy Setup
🔹 Entry: Buy above the high of 15-min candle if it closes above $4185
🎯 Targets:
$4195
$4208
$4226
🛑 Stop Loss: Low of the breakout candle or as per risk appetite
📉 Sell Setup
🔹 Entry: Sell below the low of 15-min candle if it closes below $4090
🎯 Targets:
$4
Elliott Wave Analysis – XAUUSD | October 14, 2025📊
________________________________________
🔹 1. Momentum
D1:
Daily momentum has started to turn upward from the oversold zone, suggesting that the bullish pressure may continue throughout the week.
H4:
On the H4 chart, momentum is stuck together in the overbought zone, indicating that a reversal co

Crude Oil FallImpact of fresh tarriff imposition on China by US has led to further fall in crude oil. Quoting below 200 EMA. If breaks the suppport then further fall can be seen this week.

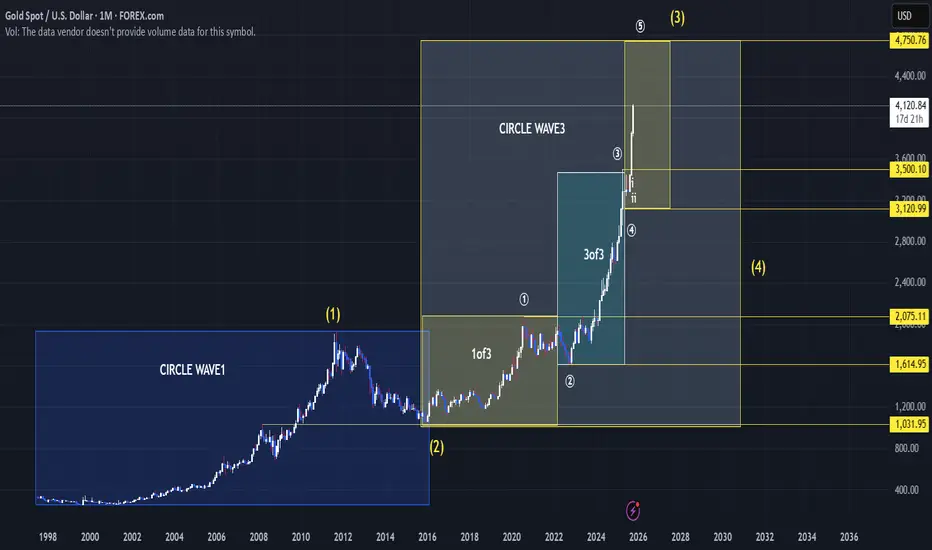
Elliot wave Gold price predictionIn my opinion that gold can hit 4700+ in next few months, as you can see my chart that circle wave 3 is going on and we are in 3 of 3rd wave right now so may be possible price will take pull back after hit 4230 or nearest it and wave 4of 3 will unfold after correction price will take bounce back nea
GOLD hits a new all-time high at $4,200 for the first time ever.🚨JUST IN: GOLD hits a new all-time high at $4,200 for the first time ever.
Now here’s the real question:
Will Gold retrace back to the $3,000–$2,500 zone soon?
That region aligns perfectly with the 0.382 Fibonacci retracement, a level where Gold has historically cooled off before launching its nex

GOLD AT ATH! $4,200 BATTLE – Which Fibo Zone Fires First?Gold is fiercely battling the $4,200 mark after hitting a new All-Time High near $4,220. Bulls are pausing, but macro risks (geopolitics, trade war warnings) keep the trend Long. Our focus: Sniping the Reaction Zones.
🎯 THE FIBO ACTION ZONES (H1/M30)
1. STRATEGIC BUY ZONE (Optimal Long Entry):
Zon

Gold Rallies to $4218 As Bulls Eyeing for $4250-$4300Gold continues to establish new record high as the prevailing bullish rally maintains sequential Higher High-Higher Low structure as all stars seem to be in collusion to boost Gold prices in a seemingly unstoppable rally until initial signs of exhaustion begin to appear.
Asian session began with str

Steven-GoldTrading – XAUUSD: All-Time Highs Emerge Steven-GoldTrading – XAUUSD: All-Time Highs Emerge, Navigating Volatility with Precision
Hello Trading Community,
Gold (XAUUSD) has absolutely demolished expectations, officially breaching the $4,200/ounce mark and setting a massive new All-Time High (ATH)! Although we see profit-taking, the overa

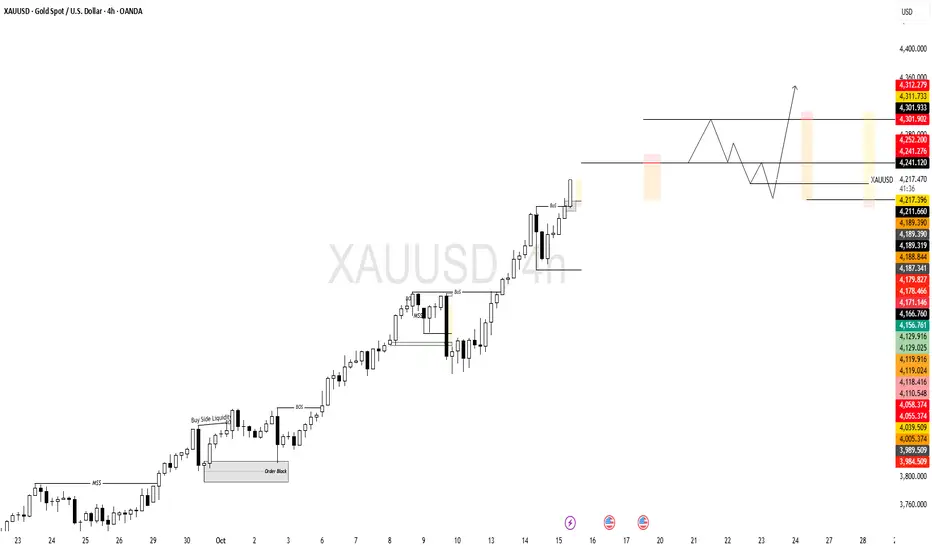
This is a technical analysis chart for Gold (XAUUSD) on a 4-hourChart Analysis
Bullish Trend: The market is in a clear uptrend. This is shown by the series of "BOS" or Break of Structure points, where the price consistently breaks above previous highs, creating higher highs and higher lows.
Liquidity Sweep: The label "Buy Side Liquidity" points to a previous hi
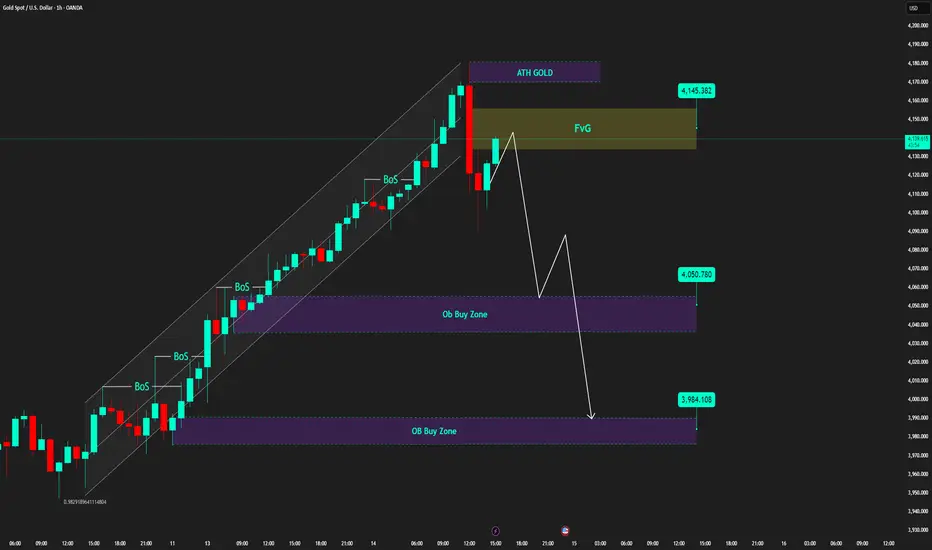
m15 timeframe sees gold drop sharply by 50 points 🔍 Market Context
Gold prices have just reached an all-time high (ATH GOLD) around the 4,180 USD mark, following a steep upward rally over several sessions.
Immediately after, the market witnessed the first break of structure (BoS) – a sign that the upward momentum is weakening .
Currently,
See all futures ideas
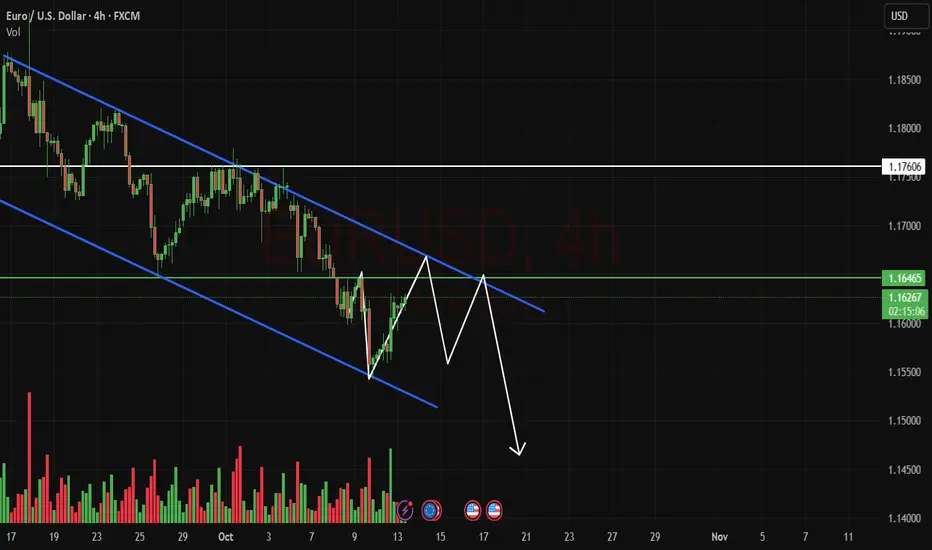
EURUSD - BEARS BACK IN CONTROL?Symbol - EURUSD
EURUSD continues to extend its downward trajectory, maintaining a locally bearish market structure. A decisive breakdown of the nearest support level could accelerate the sell-off, paving the way for fresh lows.
The US dollar remains firm, while the pair shifts its medium-term dire


Sell Trade - EUR/USDGreetings to everyone!
You can place a sell trade on EUR/USD and check out my chart for the ideal entry, stop-loss & target placement.
Remember :-
* Move your SL to breakeven once the trade reaches 1:1 R.
* Aim for a minimum reward of 1:1.5 R.
* Don't risk more than 3% of your total margin.

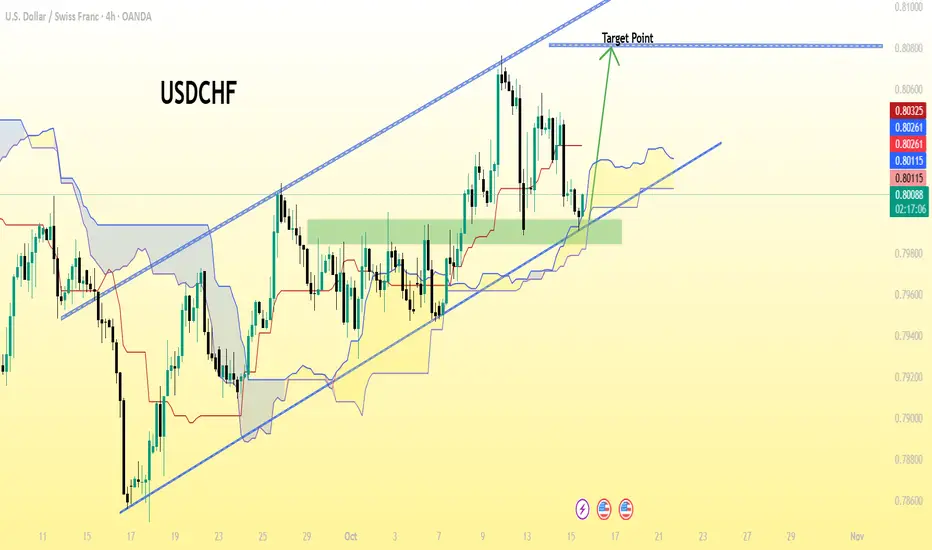
USD/CHF (U.S. Dollar vs. Swiss Franc) on the 4-hour timeframe...USD/CHF (U.S. Dollar vs. Swiss Franc) on the 4-hour timeframe.
From my chart :
The price is moving in an ascending channel.
A green support zone has been marked near 0.8000 – 0.8020.
The upper trendline of the channel is marked as the “Target Point.”
That line aligns approximately with 0.8080 –
EURUSD Outlook: Dollar Dominance Extends as Euro WeakensThe EURUSD pair remains under downward pressure as investors continue favoring the U.S. dollar amid global economic uncertainty. The Federal Reserve’s consistent stance on keeping interest rates higher for longer has reinforced the dollar’s appeal, while weak Eurozone data — including sluggish indus

FXHUNTER GBPUSDGBPUSD symbol analysis: This symbol is currently bullish due to the previous high being broken, and don't forget to use capital management to enter a trade.

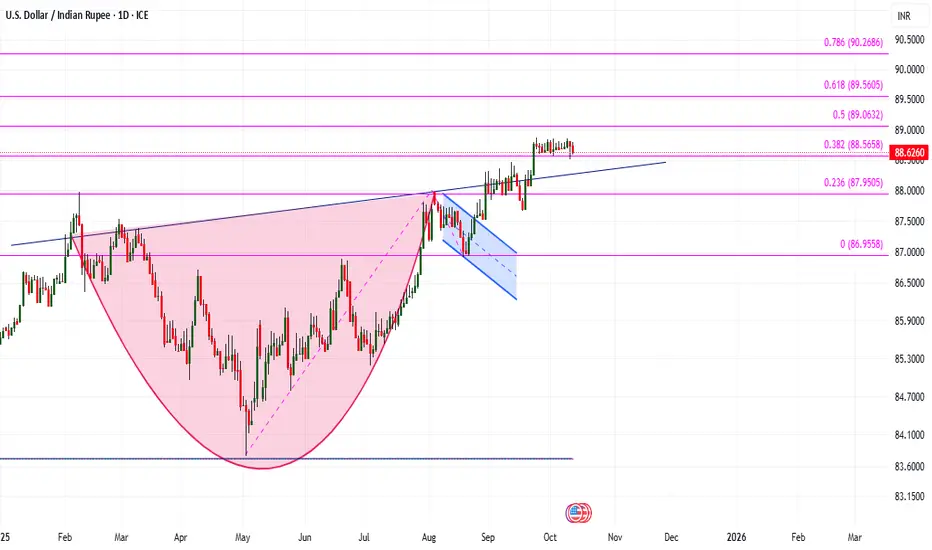
USDINR Breakout: What next ?USDINR gave a 'Cup & Handle' breakout on 23/09/25 and currently in consolidation around 88.5658 levels. Buy on dip seems the way if the support of 88.2667 and hurdle/resistance/target of 89.0632.
The reward-to-risk ratio is approximately 1.66 : 1 ✅
📉 Risk (Stop Loss) = 0.2991
📈 Reward (Target) =
AUDUSD 15M IDEAFOREXCOM:AUDUSD
Hello traders , here is the full multi time frame analysis for this pair, let me know in the comment section below if you have any questions, the entry will be taken only if all rules of the strategies will be satisfied. wait for more Smart Money to develop before taking any po

AUDJPY – SELL SETUP (2H TIMEFRAME)AUDJPY – SELL SETUP (2H TIMEFRAME)
📉 Bias: Bearish Rejection Zone Formed
Price made a strong downside move after a sharp drop and is now pulling back into a major supply zone (100.370 – 100.992).
This area aligns with previous structure highs and imbalance, making it a high-probability reversal zo

See all forex ideas
| - | - | - | - | - | - | - | - | ||
| - | - | - | - | - | - | - | - | ||
| - | - | - | - | - | - | - | - | ||
| - | - | - | - | - | - | - | - | ||
| - | - | - | - | - | - | - | - | ||
| - | - | - | - | - | - | - | - | ||
| - | - | - | - | - | - | - | - | ||
| - | - | - | - | - | - | - | - | ||
| - | - | - | - | - | - | - | - |
Trade directly on the supercharts through our supported, fully-verified and user-reviewed brokers.


