KAZIA THERAPEUTICS LTD SPONSORED ADRKZIA made double bottom with divergence with good volume and breakout at $4.45 with first target of $22.5, if and second target of $41.7 and with can expect strong resistance at $41.7 and reverse might happen. If KZIA did breakout at this level we can expect rally till $79.
Analysis is made on week

Cyber Monday
The greatest deal of the year is in its final orbit.Secure this offer before it's gone.

Crude is ready for CRAZY upsideCurrently Crude is at 58/59
Crude is making Diametric pattern on a weekly timeframe, Where we can see crude has made 2 complex pattern which is (ABCDE-XYZ-ABCDE)
This is the last wave of Diametric pattern, so if Crude gives breakout around 72 which is very liekly
we can see 91/92 levels in comi

BANK OF BARODA @290Not a SEBI registered, just sharing idea. BOB on the verge of breakout from rounding bottom formation. Before breakout consolidating near range. If breakout happen then it blast like federal bank or canara bank.

ICICIBANK - Inverted Head & Shoulder suggests 1450ICICI Bank has completed a clean Inverted Head and Shoulders pattern on the 4H chart, signalling a possible trend reversal after the recent downtrend. The left shoulder formed near 1360 , the head at 1317 , and the right shoulder at 1354 . All three points reflect stronger structure and consisten

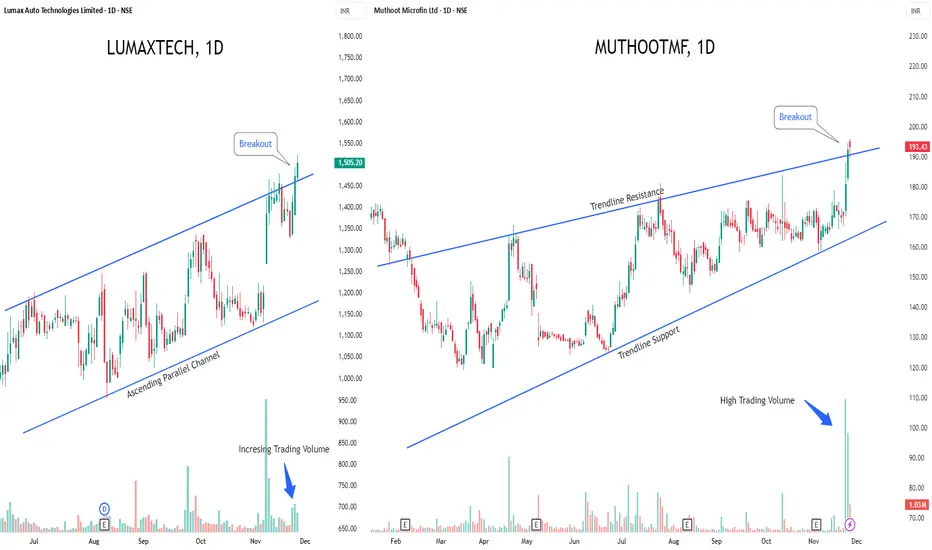
LUMAXTECH & MUTHOOTMF - Breakout Stocks to Watch This Week!1️⃣ Lumax Auto Technologies NSE:LUMAXTECH — Fresh Breakout Alert
Lumax is riding a strong uptrend and has cleanly broken above the upper boundary of its ascending parallel channel.
If this breakout sustains, the stock could see a sharp upside rally ahead.
Rising volumes are confirming strong
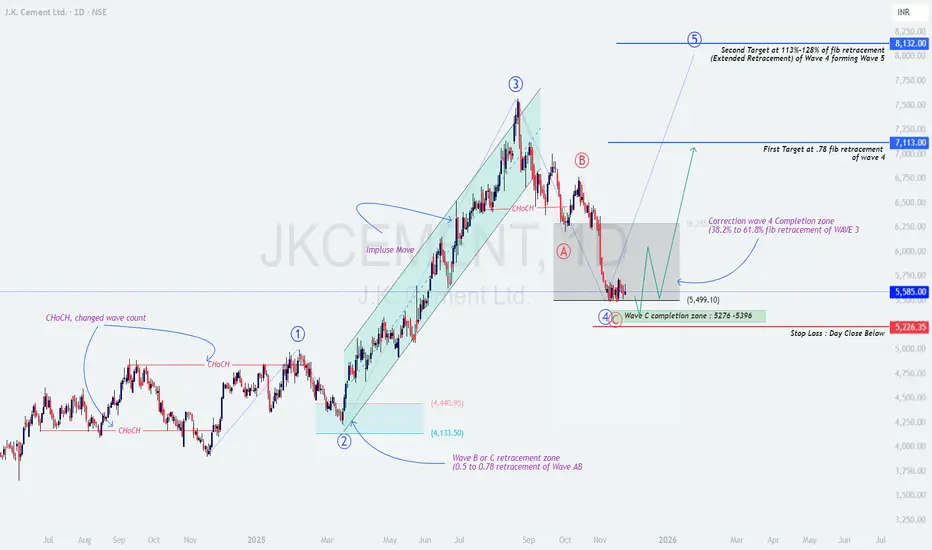
JKCEMENT at Demand Zone – Is Wave 5 About to Start?⚡ JK CEMENT – Wave 4 Correction Completing | Wave 5 Blast Loading?
🧠 Overall Market Structure
JK Cement is showing a textbook Elliott Wave progression, and price has now entered the crucial Wave 4 → Wave C completion zone (₹5276–₹5396).
This zone aligns with 38.2% to 61.8% retracement of Wave 3
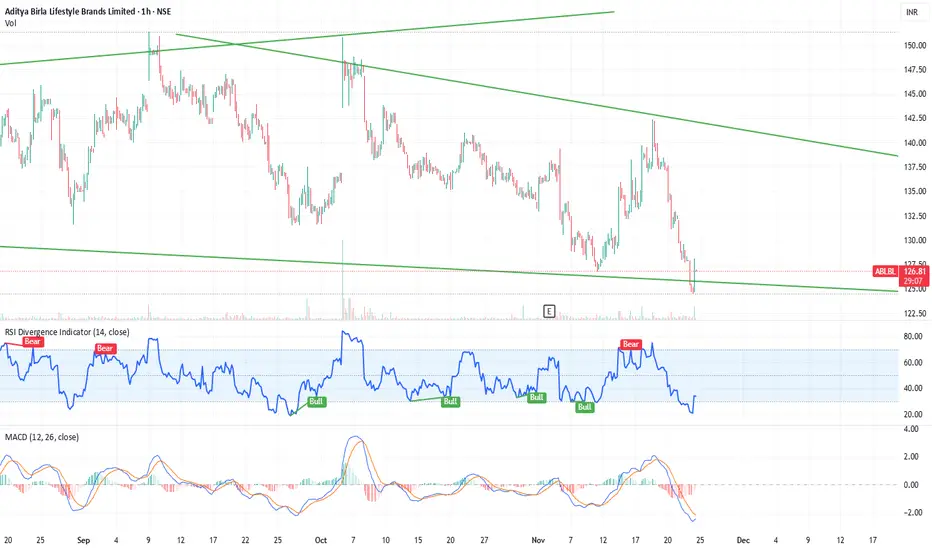
Falling Wedge Pattern (Bullish Setup) | Re-Opportunityit did give an opportunity last week, then fell, and is again at an opportunity zone now.
RSI Analysis
Your RSI shows:
RSI near 37–38
This is close to oversold, which is usually where reversals happen
Earlier, RSI bounced from similar levels
➡️ Supports a bounce possibility.
MACD Analysis
MACD is
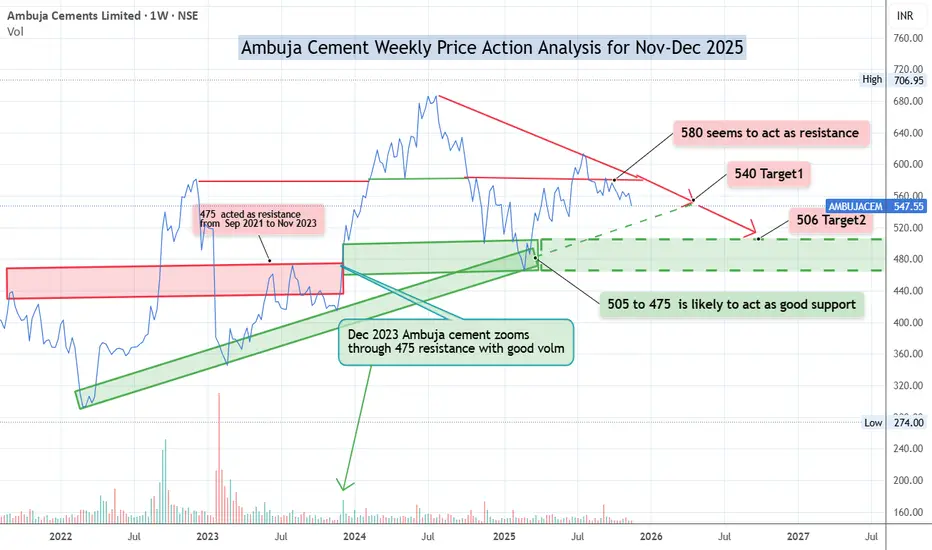
Ambuja Cement Weekly Price Action Analysis for Nov-Dec 2025On Weekly chart Ambuja Cement has closed at 547 on 20-Nov-25
Recent price action indicates the stock is struggling to go past 575-580 area.
It is likely to continue going down till its support major region of 505-475.
One can sell/short sell whenever the stock comes near 570 region. Keeping SL of 5
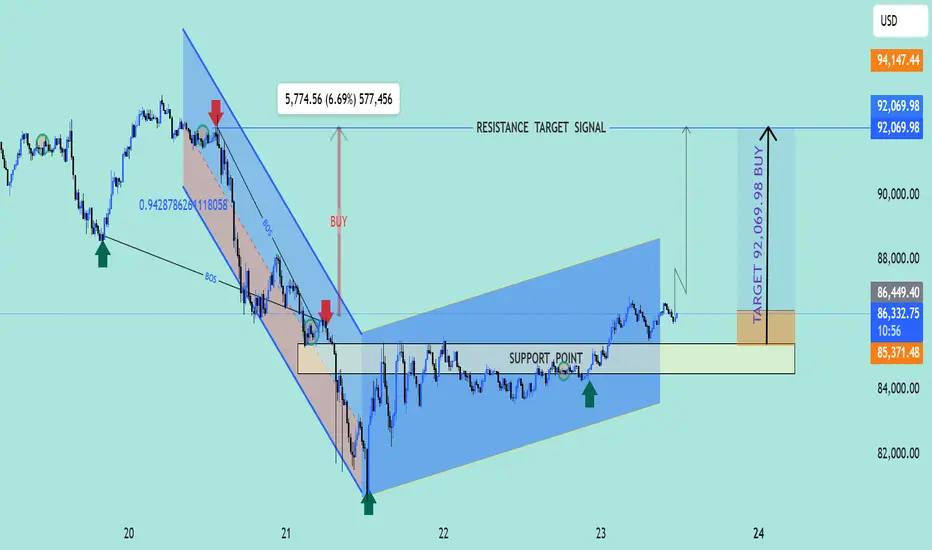
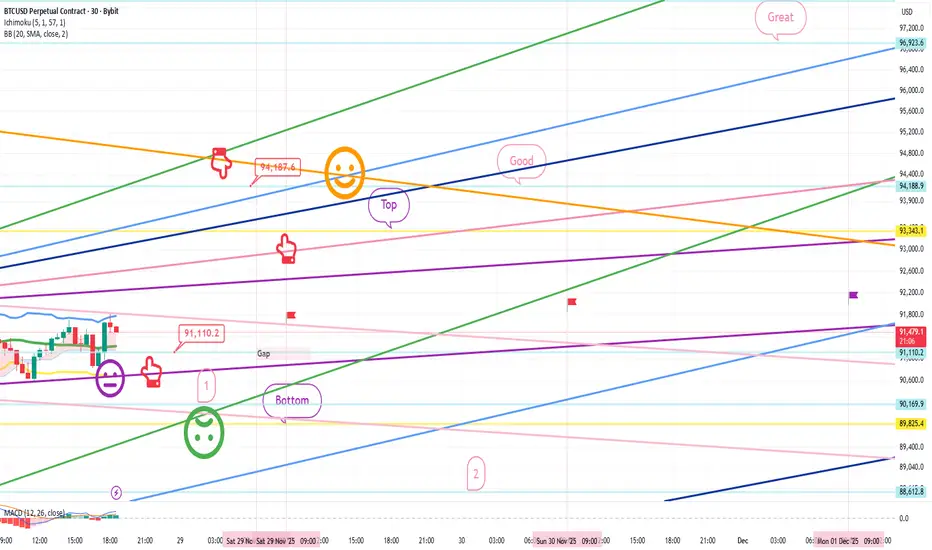
4. Price Action Analysis with Target at 92K1. Market Structure
The chart shows that the market was previously in a downtrend, but price has now created a bullish structure shift.
This shift is confirmed by a Break of Structure (BOS) to the upside, meaning buyers have taken control.
---
2. Support Zone
Price reacted strongly from the sup
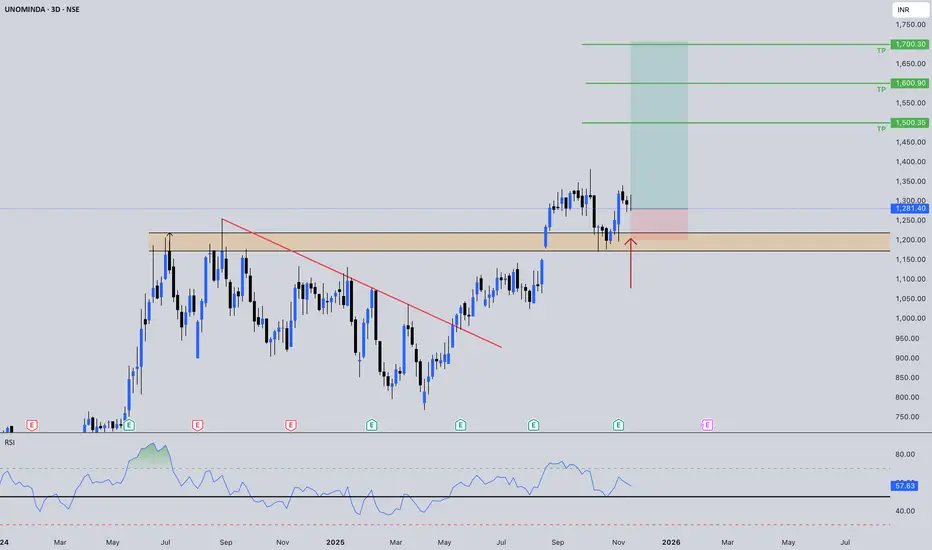
UNOMINDA: Post-Breakout Retest - Setting Up For Wave 2
Price shows a text-book breakout and retest of a multi-month consolidation high, signaling a potential acceleration phase in the Auto Components space.
🔍 Technical Snapshot (3-Day Chart)
Metric: Breakout Zone
Value: ₹1,180–₹1,250
Interpretation: Critical horizontal resistance flipped to suppo
See all editors' picks ideas
Match Finder [theUltimator5]Match Finder is the dating app of indicators. It takes your current ticker and finds the most compatible match over a recent time period. The match may not be Mr. right, but it is Mr. right now. It doesn't forecast future connection, but it tells you current compatibility for today.
Jokes aside,

Trend Line Methods (TLM)Trend Line Methods (TLM)
Overview
Trend Line Methods (TLM) is a visual study designed to help traders explore trend structure using two complementary, auto-drawn trend channels. The script focuses on how price interacts with rising or falling boundaries over time. It does not generate trade sign

Breakouts & Pullbacks [Trendoscope®]🎲 Breakouts & Pullbacks - All-Time High Breakout Analyzer
Probability-Based Post-Breakout Behavior Statistics | Real-Time Pullback & Runup Tracker
A professional-grade Pine Script v6 indicator designed specifically for analyzing the historical and real-time behavior of price after strong All-Ti

Count█ OVERVIEW
A library of functions for counting the number of times (frequency) that elements occur in an array or matrix.
█ USAGE
Import the Count library.
import joebaus/count/1 as c
Create an array or matrix that is a `float`, `int`, `string`, or `bool` type to count elements from, t

Holographic Market Microstructure | AlphaNattHolographic Market Microstructure | AlphaNatt
A multidimensional, holographically-rendered framework designed to expose the invisible forces shaping every candle — liquidity voids, smart money footprints, order flow imbalances, and structural evolution — in real time.
---
📘 Overview
The Hol

PriceFormatLibrary for automatically converting price values to formatted strings
matching the same format that TradingView uses to display open/high/low/close prices on the chart.
█ OVERVIEW
This library is intended for Pine Coders who are authors of scripts that display numbers onto a user's charts. T

LogNormalLibrary "LogNormal"
A collection of functions used to model skewed distributions as log-normal.
Prices are commonly modeled using log-normal distributions (ie. Black-Scholes) because they exhibit multiplicative changes with long tails; skewed exponential growth and high variance. This approach i

Range Oscillator (Zeiierman)█ Overview
Range Oscillator (Zeiierman) is a dynamic market oscillator designed to visualize how far the price is trading relative to its equilibrium range. Instead of relying on traditional overbought/oversold thresholds, it uses adaptive range detection and heatmap coloring to reveal where pri

Volume Surprise [LuxAlgo]The Volume Surprise tool displays the trading volume alongside the expected volume at that time, allowing users to spot unexpected trading activity on the chart easily.
The tool includes an extrapolation of the estimated volume for future periods, allowing forecasting future trading activity.
🔶 U

Smooth Theil-SenI wanted to build a Theil-Sen estimator that could run on more than one bar and produce smoother output than the standard implementation. Theil-Sen regression is a non-parametric method that calculates the median slope between all pairs of points in your dataset, which makes it extremely robust to o

See all indicators and strategies
Community trends
BANK OF BARODA @290Not a SEBI registered, just sharing idea. BOB on the verge of breakout from rounding bottom formation. Before breakout consolidating near range. If breakout happen then it blast like federal bank or canara bank.
KEI Industries Ltd. (KEI)By now, you should understand how important a date candle is in a time cycle, especially if it forms within multiple time cycles or if it's a date candle combined with two cycles. You can see how powerful it is by looking at the Nifty candle of November 11, 2025.
It feels like someone is supporting

BUY TODAY SELL TOMORROW for 5%DON’T HAVE TIME TO MANAGE YOUR TRADES?
- Take BTST trades at 3:25 pm every day
- Try to exit by taking 4-7% profit of each trade
- SL can also be maintained as closing below the low of the breakout candle
Now, why do I prefer BTST over swing trades? The primary reason is that I have observed that

ICICIBANK - Inverted Head & Shoulder suggests 1450ICICI Bank has completed a clean Inverted Head and Shoulders pattern on the 4H chart, signalling a possible trend reversal after the recent downtrend. The left shoulder formed near 1360 , the head at 1317 , and the right shoulder at 1354 . All three points reflect stronger structure and consisten
Bharat Forge: Weekly Long1. Breakout Above Major Resistance (₹1336 Zone)
The price has given a clean breakout above the horizontal resistance near ₹1336–1340 after multiple weeks of consolidation. This level acted as a strong barrier earlier, and breaking above it shows renewed strength in the stock.
2. 10 EMA Crossing 20

TEJAS is BEST # MD >> Avoid FNOHAL CMP 4500
Add on Dips till 4400
SL CLB 4275
Tgt upto 5K & Above
⚠️ Note: Stick to levels, follow discipline & use TSL (Trailing Stop Loss) once target starts approaching.
Let’s stay hopeful that the move continues as per our expectations! 📈
💡 Liked the idea?
Then don’t forget to Boost 🚀 it!
F

Bearish Engulfing Candle: BAJAJ_AUTOToday's low is the support, i.e., 8996, which, if breached, will trigger the bearish engulfing candle.
The reason for publishing a video idea instead of a simple chart idea is to show you an interesting setting in the parallel channel of TradingView, in case you don't know about it.
Target range do

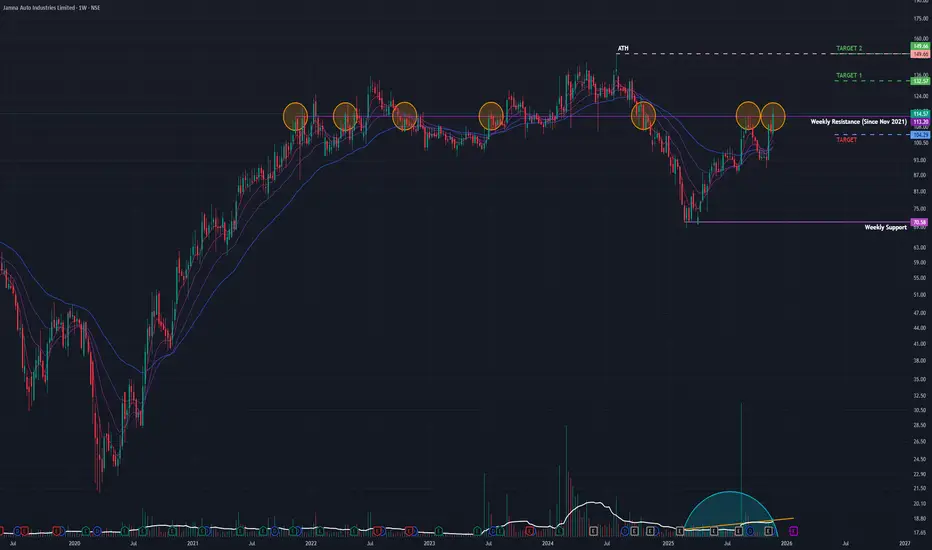
Jamna Auto - Strongly Bullish - Expansion-Driven Breakout(Timeframe: Weekly | Scale: Logarithmic)
The stock has confirmed a decisive breakout from a multi-year resistance zone. This move is supported by a significant capacity expansion announcement, rising volume, and a bullish structural shift.
🚀 1. The Fundamental Catalyst (The "Why")
The breakout
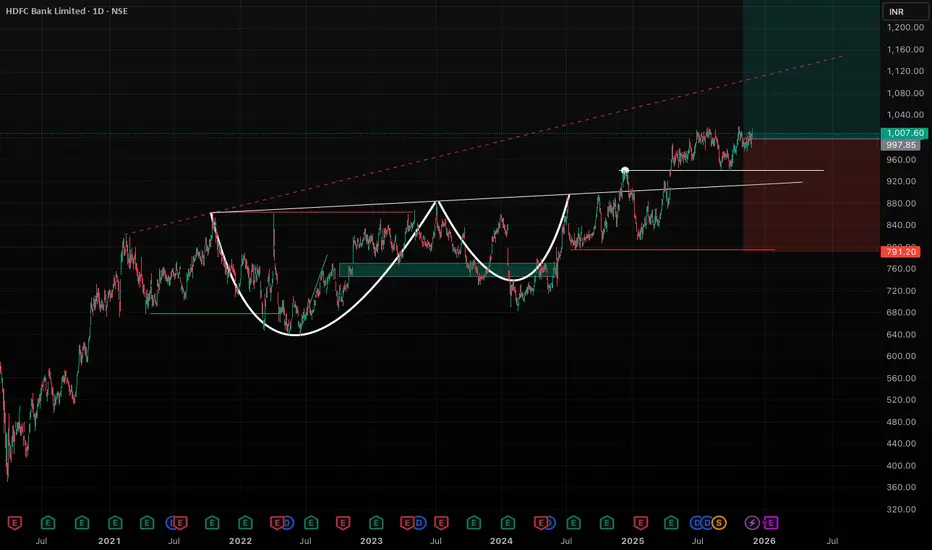
HDFC Bank: Massive Multi-Year Cup-and-Handle BreakoutHDFC Bank is showing a very bullish multi-year Cup-and-Handle breakout. Price has finally broken above the long-term horizontal resistance zone and is now retesting it as support. This stock is also in majority of mutual fund's top holdings, so this makes it a safer bet.
Maruti primed for a liquidity dive — eyes on 15,600.Maruti Suzuki, trading around 15,920, is operating inside the premium zone of the current price range, signaling ideal conditions for Smart Money to initiate distribution. Price is showing early signs of a bearish shift in structure after reacting to a supply zone, suggesting that institutional orde

See all stocks ideas
Dec 3
F
FRMIMother Nutri Foods Limited
Exchange
BSE
Offer price
1.24 - 1.31
USD
Dec 5
C
CMPIPurple Wave Infocom Ltd.
Exchange
BSE
Offer price
1.34 - 1.41
USD
Dec 5
T
TINLogiciel Solutions Ltd.
Exchange
BSE
Offer price
2.05 - 2.16
USD
Dec 8
J
JOCMInvicta Diagnostic limited
Exchange
NSE
Offer price
0.90 - 0.95
USD
Dec 8
C
CHWYClear Secured Services Ltd.
Exchange
NSE
Offer price
1.40 - 1.48
USD
Dec 9
E
EMASHelloji Holidays Ltd.
Exchange
BSE
Offer price
1.23 - 1.32
USD
Dec 9
T
TPVNeochem Bio Solutions Ltd.
Exchange
NSE
Offer price
—
Dec 10
3
320000Meesho Ltd.
Exchange
BSE
Offer price
1.18 - 1.24
USD
See more events
Community trends
Biggest Altseason 10x-20x Loading for 2026?If You're Panicking Right Now, You're About To Miss The Easiest 5x-20x Of Your Life
The Total Market Cap (excluding BTC & ETH) just painted a picture we've seen before...
HISTORICAL CONTEXT:
Last bull run → 1200% pump after breakout & retest
Current situation → Long-term trendline support broken

November 28 Bitcoin Bybit chart analysisHello
It's a Bitcoin Guide.
If you "follow"
You can receive real-time movement paths and comment notifications on major sections.
If my analysis was helpful,
Please click the booster button at the bottom.
This is the Nasdaq 30-minute chart.
Today is an early closing day due to Thanksgiving.
*
zzzHowever, by 2025, this thesis evolved. The "mining boom" strained the domestic grid during dry seasons and failed to generate the anticipated broad-based employment. Consequently, the Ministry of Energy and Mines announced a suspension of electricity supply to mining operations effective early 2026,

ALPH Ready for a Trend Reversal! Weekly Channel Bottom📉ALPH Weekly Chart Update
Alephium has been moving inside a clear falling channel, with price repeatedly respecting both trendlines.
Now it’s approaching a major long-term support at $0.10 a level where buyers have previously shown strength.
A weekly close above the channel could signal the firs

BTCUSD – Demand Zone Reaction & Trendline Reclaim | Bullish Setu📌 Key Highlights
Liquidity grab below previous lows triggered strong bullish momentum.
Clear demand zone reaction with buyers defending the same region multiple times.
Price has reclaimed the ascending trendline, showing a potential shift in short-term structure.
Now sitting in the retest zone,

XAUUSD GOLD Analysis on (27/11/2025)#XAUUSD UPDATEDE
Current price - 4157
Best Buy Area - 4131-4129 (Stop loss -4110)
BUY TARGET - 4175-4191

ETH/USD LONG OPPORTUNITY, BULLISH REVRESALETH/USD 1H Chart: The price action is showing a potential bullish reversal after tapping into a key demand zone (highlighted in purple).
This demand zone successfully held against bearish momentum, leading to a crucial Change of Character (ChoCH) structure break to the upside. The price breaking th


BTCUSD SHOWING A GOOD UP MOVE WITH 1:10 RISK REWARD BTCUSD SHOWING A GOOD UP MOVE WITH 1:10 RISK REWARD
DUE TO THESE REASON
A. its following a rectangle pattern that stocked the market
which preventing the market to move any one direction now it trying to break the strong resistant lable
B. after the break of this rectangle it will boost the market p

BTC/USD – Support Reclaim Signals Potential Bullish ContinuationChart Analysis
1. Key Support Zone (≈ 90,350 – 90,920)
Your chart highlights a strong support zone where price previously reacted.
Price has reclaimed this area, showing that buyers stepped in aggressively.
This support aligns with Fibonacci retracement levels, strengthening its validity.
2. Cur

See all crypto ideas
Crude is ready for CRAZY upsideCurrently Crude is at 58/59
Crude is making Diametric pattern on a weekly timeframe, Where we can see crude has made 2 complex pattern which is (ABCDE-XYZ-ABCDE)
This is the last wave of Diametric pattern, so if Crude gives breakout around 72 which is very liekly
we can see 91/92 levels in comi
Gold (XAUUSD)15-Min Chart Update | Support Zone Holding StronglyHello guys, Gold continues to respect its rising channel structure, moving between the rising support and resistance trendlines. After a minor correction, the price has once again bounced from the rising support trendline, showing strong buying interest near the lower boundary of the channel.
This

silver spot nxt boomer update blwsilver spot made almost triple top near 52.40$ which is facing big hurdle for silver if mkt sustain above 52.50$ or close above than next up side tgt 56--58$ support 51.50$ if blw than some correction till 50--49$--- yes eyes on 52.50$ if unable to hold abv than mkt looks some correction till 53.50

GOLD XAU/USD – Testing Supply Zone! Possible Pullback SetupGold extended its bullish momentum but is now showing signs of exhaustion as it tests the 4190–4200 supply zone, where price has reacted previously.
I’ll be watching for potential short opportunities near 4185, as long as 4194 remains a protective upside barrier.
If sellers step in, possible downs

Gold Trading Strategy for 28th November 2025Trade plan (15-minute close rules)
Long (Buy) Plan 🟢
Entry: place a buy order after a 15-min candle closes above $4170 (you may use a market order on the next candle open or a buy-stop just above the high).
Primary targets:
Target 1: $4182 — partial take profit (TP1). 🎯
Target 2: $4195 — add/scale

Silver continuesly buying recommended now 57.50 and 59.50 targetParameters Data
Reason 🟩 Dovish Fed Bets & Industrial Demand: US Fed rate cuts ki strong expectation aur US Dollar Index (DXY) mein weakness se Silver ko support mil raha hai. Additionally, industrial demand outlook bhi positive hai, driving price towards new highs.
Asset Name Silver COMEX (XAG/USD)

SILVERHello & welcome to this analysis
Silver had a dream run from August to October before going into a sideways correction.
Just like Gold, it too is forming a triangle, now likely into its last leg.
Comex Silver an ascending triangle as long as it does not trade above $54.40 could dip down to $51.50

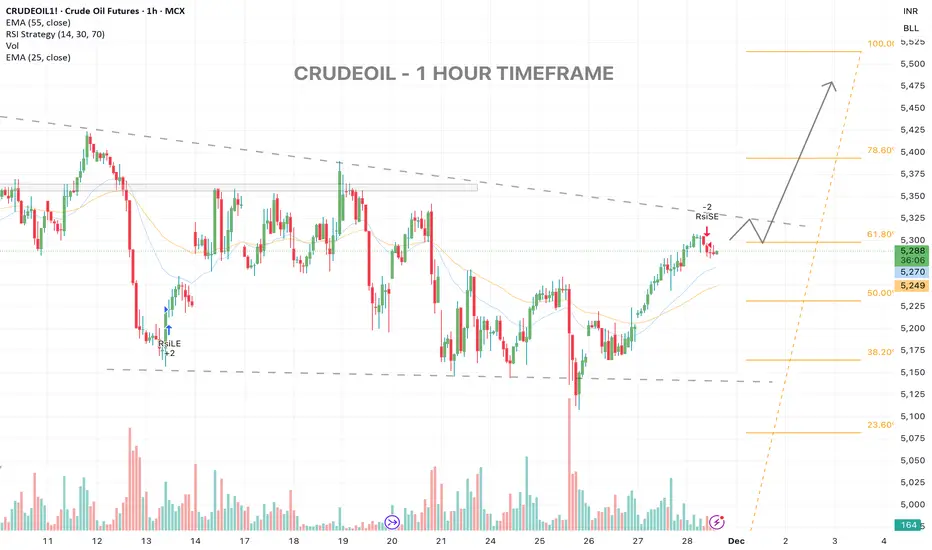
SOON BREAKOUT IN CRUDEOIL ?CRUDEOIL - 1 HOUR TIMEFRAME
Price is retesting the 61.8% zone right under the descending trendline.
A shallow pullback toward 5260–5275 can fuel the next leg toward 5335 / 5385 / 5450.
Overall, structure favors a continuation leg higher once the pullback stabilizes, remains bullish as long as 52
XAUUSD – H2: The Discount Zone Is Formed, Now Waiting for ...XAUUSD – H2: The Discount Zone Is Formed, Now Waiting for Price to Retrace for Continuation Buys
On the H2 timeframe, gold has just made a strong breakout above the 4,180 zone after a period of tight consolidation. Since it is the weekend and also Thanksgiving in the US, I will only prioritise pull

Elliott Wave Analysis XAUUSD – 28/11/2025Hello my friends, let’s update the Elliott Wave analysis on Gold together to see how the wave development may unfold today.
1. Momentum
Momentum D1
D1 momentum is currently contracting. We need to wait for a strong bearish daily close to confirm a momentum reversal. Once confirmed, the market may e

See all futures ideas
CAD/CHF Short term Sell IdeaAs per wave analysis, CAD/CHF looks bearish for short term for an target of 0.56810

GU Weekly Analysis 01/12/2025 - 07/12/2025Namaste Everyone.
Analysing GU I'm seeing that -
1. We are in a weekly bearish fvg with respect to GU
2. We have SMT with DXY
This is giving me a bearish idea, its just an idea remember that, we don't trade mere interpretations of market, we look for our setup to present itself, so we'll wait.
This

CADJPY could keep rising furtherOANDA:CADJPY The market has been on a clear upward trajectory for some time, with each swing reaching higher peaks and forming higher lows. The rising trendline has been the driving force behind this momentum.
Following the recent surge, the price has pulled back slightly, forming a textbook bulli

GBP/USD Signals Trend Shift – Impulsive Upside ExpectedThe chart shows that GBP/USD has completed a full W–X–Y corrective pattern, with the final wave (y) and its C wave forming a clean bottom near the long-term support line. From that low, price has started a strong upward move, which looks like the beginning of a new impulsive Wave 1. The current pull


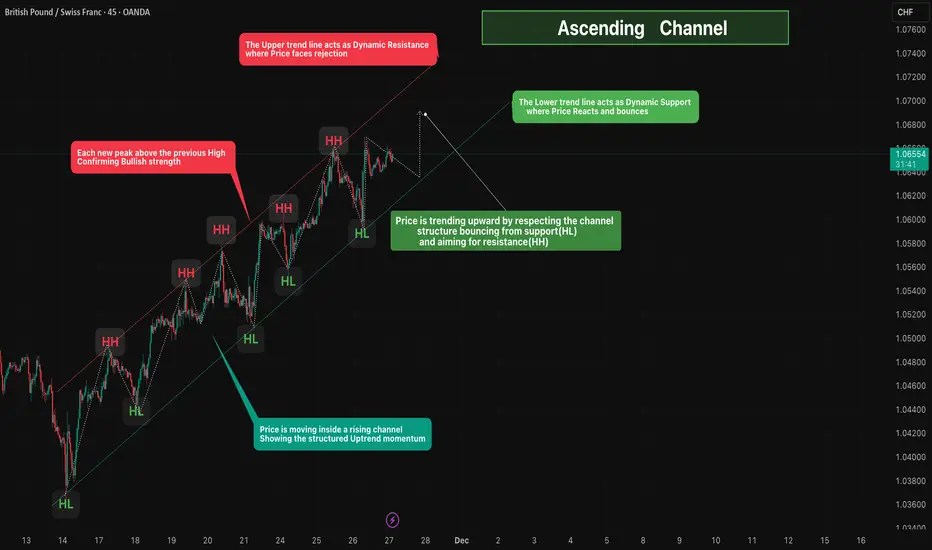
Ascending Channel🔎 Overview
Price is moving inside a well-defined Ascending Channel, showing a strong and structured uptrend.
The market continues to form Higher Highs (HH) and Higher Lows (HL), confirming consistent buying pressure.
The channel provides clear dynamic support and resistance, helping identify
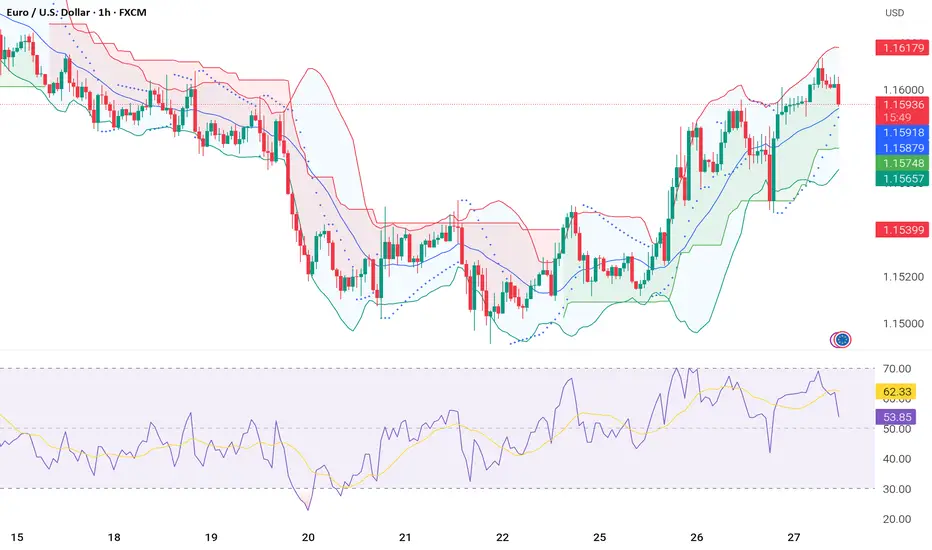
Eurusd technical Analysis EUR/USD is trading in a short-term bullish structure after bouncing from the mid-Bollinger band and holding above the intraday support zone at 1.1575–1.1565. Buyers pushed price toward the upper band, but the pair is now facing strong resistance at 1.1615–1.1620, where recent candles show rejection.
Interesting EURUSD Rebounce w/ chance of BPR and FVG respectedIdea create from FVG 1H respected through US High Impact News. Market interesting with chance of BPR 15m short term and rebounce with OB 5M look like strong effective. Lets risk a bit for SHORT position to see if price can be back at BPR 15m, if right then we looking for BUY position when market ef

USDJPY MULTI TIMEFRAME ANALYSIS Hello traders , here is the full multi time frame analysis for this pair, let me know in the comment section below if you have any questions , the entry will be taken only if all rules of the strategies will be satisfied. wait for more price action to develop before taking any position. I suggest yo

NZDUSD - Mandelbrot Theorem 1:7 RRSome properties of the Mandelbrot set
This section summons some properties of the Mandelbrot set first without proof, then some statements are proved.
Theorem 3 (Symmetry) The Mandelbrot set is symmetric with respect to the real axis. This means, if a complex number $ z$ belongs to the mandelbro

See all forex ideas
| - | - | - | - | - | - | - | - | ||
| - | - | - | - | - | - | - | - | ||
| - | - | - | - | - | - | - | - | ||
| - | - | - | - | - | - | - | - | ||
| - | - | - | - | - | - | - | - | ||
| - | - | - | - | - | - | - | - | ||
| - | - | - | - | - | - | - | - | ||
| - | - | - | - | - | - | - | - | ||
| - | - | - | - | - | - | - | - |
Trade directly on the supercharts through our supported, fully-verified and user-reviewed brokers.


