Tanla Platforms : Inverted Head & Shoulder in making Tanla Platforms is forming a inverted head and Shoulder pattern right shoulder . On Friday last week , the stock is just around the neckline .
The Stock just started holding above 50 and 200 DMA.
RSI daily reading is above 70 indicating a positive momentum.
Need to be watchful in next week , i

The best trades require research, then commitment.
Get started for free$0 forever, no credit card needed

Scott "Kidd" PoteetThe unlikely astronaut

Where the world does markets
Join 100 million traders and investors taking the future into their own hands.
Major indices

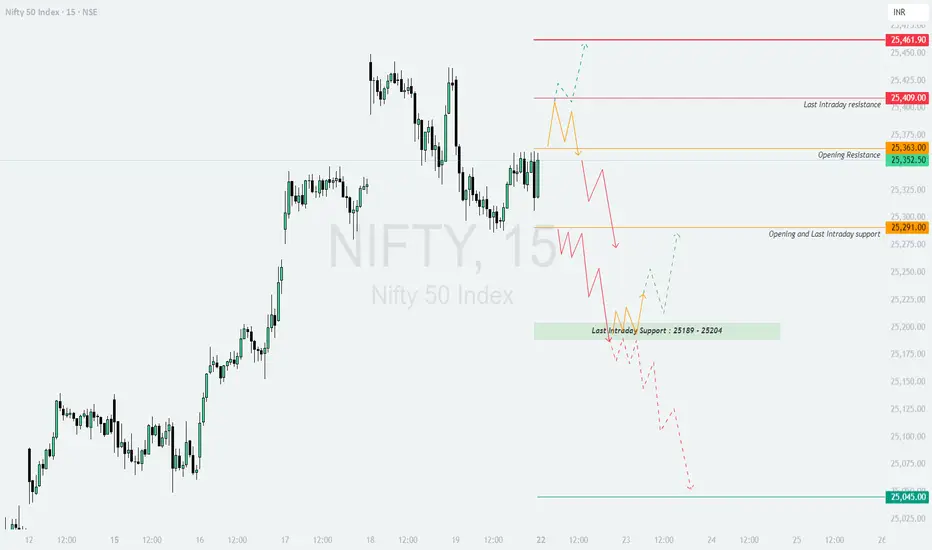
NIFTY : Trading levels and Plan for 22-Sep-2025NIFTY TRADING PLAN – 22-Sep-2025
The index closed around 25,352, with immediate opening resistance at 25,363, and higher hurdles near 25,409 (last intraday resistance) and 25,461. On the downside, supports are placed at 25,291 (opening/last intraday support) and the 25,189–25,204 zone. The critica
Positive moves on beaten down stock(Adani Green)Posititive news has come for the adani group from higher court. Adani Green is beaten down stock(may be not because of news flows but because of valuation). But now buying is there from the lower levels.
Valuations have come down in last 2-3 years(however still expensive valuation). But may be this

Sigachi’s Technical Surge: Next Resistance in SightOver the past month, Sigachi traded within a well-defined consolidation range, reflecting a period of equilibrium between buyers and sellers. However, in the most recent week, the stock decisively broke out above this consolidation zone on increased trading volume a classic signal of renewed bulli

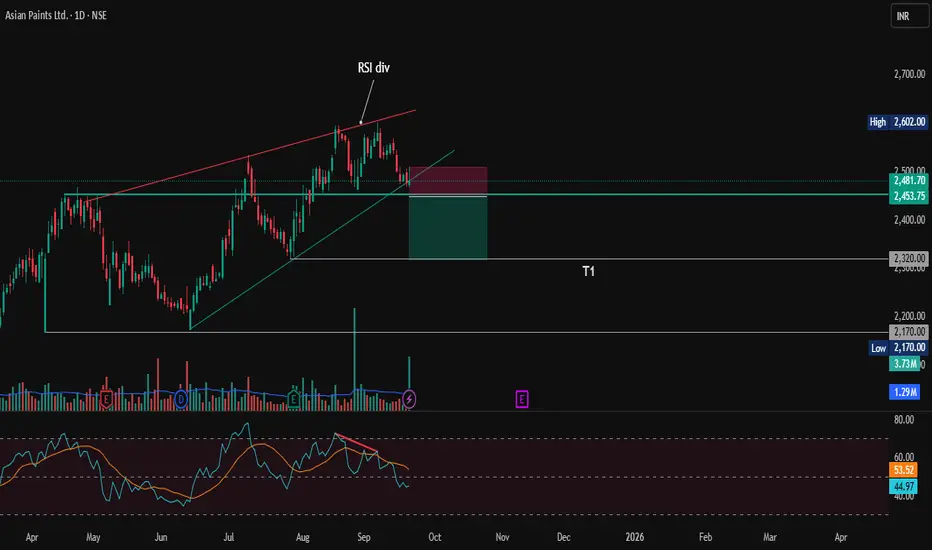
Asian Paints: Short Setup — Bearish Reversal SignalAsian Paints shows signs of a potential short opportunity after forming a bearish reversal pattern (Rising wedge) on the daily chart. The stock failed to sustain above the resistance near 2600, Formed a Double top pattern. The RSI is showing bearish divergence, signaling weakening momentum. hinting
Market Cycles I have made efforts in Explaining How Markets work in cyclical basis
once The bull Run completes , Market ideally enters in Price & Time Corrections
which enter in one of two know phases
01) Deep Price Corrections
02) Bracketed Market Price corrections
This is education content if you have

JSWSTEEL TRENDLINE BREAKOUTJSWsteel breaking trendline resistance weekly basis
good volume last few weeks
bullish RSI above 60
trading at al time high
can reach to target 1250 soon
NO BUY/SELL RECOMENDATION

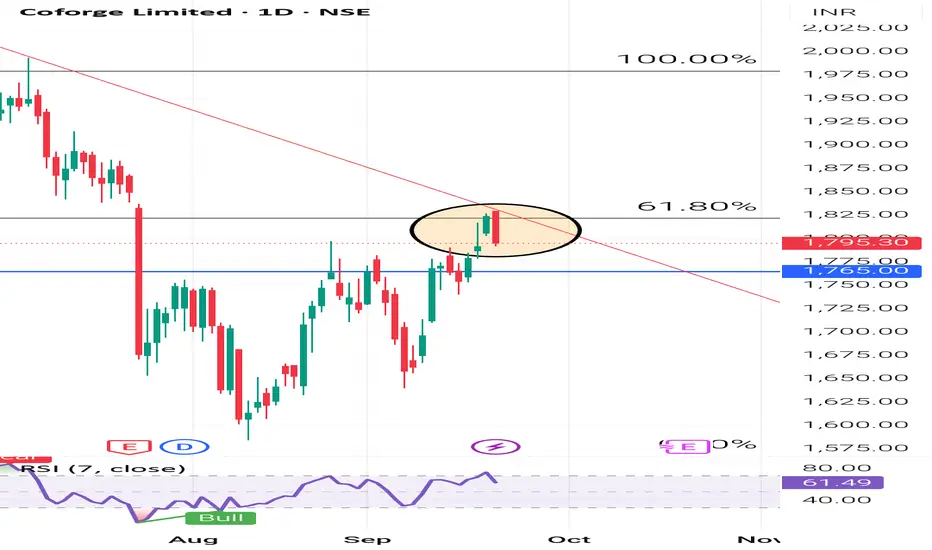
COFORGE LIMITED ( 1D ) 🔑 KEY LEVELS 🔑
✔ Fibonacci Retracement 61.80%
✔ Trend Line Act As Resistance.
✔ RSI Also Overbought Zone.
🎯 TRADING PLAN 🎯
✔ Near the key levels , Bearish Engulfing
Candlestick Pattern has formed.
✔ The Entry Point is Below @ 1792.10
✔ The Stopl
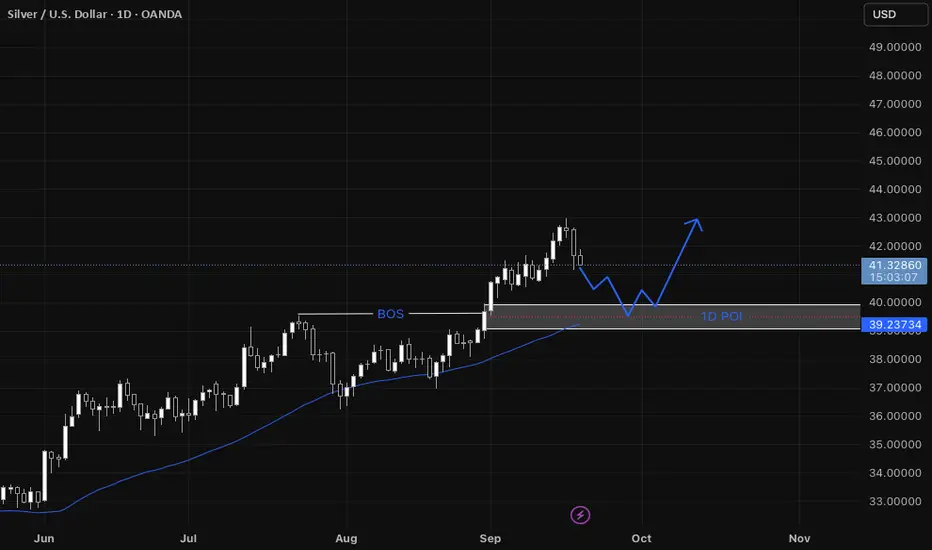
XAGUSD Step-by-step entry plan for XAGUSD
1. We have our Daily Point of Interest (POI)
- On the daily a zone that contains:
* a fair value gap (FVG),
* a break of structure (BOS) that previously acted as resistance and is now expected
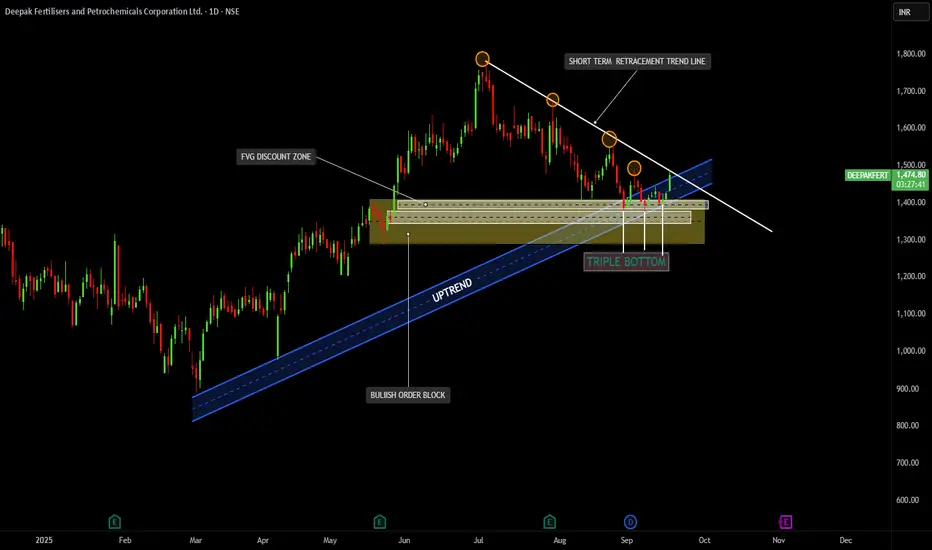
DEEPAK FERTILIZERTrend Structure:
The stock has been in a primary uptrend (marked with the blue ascending channel).
Recently, it went into a short-term retracement with a downward sloping trendline (white).
Support & Demand Zones:
Strong Bullish Order Block and FVG Discount Zone around the ₹1350 – ₹1400 level, w
See all editors' picks ideas
Liquidity Void Detector (Zeiierman)█ Overview
Liquidity Void Detector (Zeiierman) is an oscillator highlighting inefficient price displacements under low participation. It measures the most recent price move (standardized return) and amplifies it only when volume is below its own trend.
Positive readings ⇒ strong up-move

DeltaFlow Volume Profile [BigBeluga]🔵 OVERVIEW
The DeltaFlow Volume Profile builds a compact volume profile next to price and enriches every bin with flow context : bullish vs. bearish participation (%), a per-bin Delta % , an optional Delta Heat Map , and a PoC band with the bin’s absolute volume. This lets you see not just

Volume by Time [LuxAlgo]The Volume by Time indicator collects volume data for every point in time over the day and displays the average volume of the specific dataset collected at each respective bar.
The indicator overlays the current volume and the historical average to allow for better comparisons.
🔶 USAGE
Thr

FlowScope [Hapharmonic]FlowScope: Uncover the Market's True Intent 🔬
Ever wished you could look inside the candles and see where the real action is happening? FlowScope is your microscope for the market's flow, designed to give you a powerful edge by revealing the volume distribution that price action alone can't sh

VWAP Price ChannelVWAP Price Channel cuts the crust off of a traditional price channel (Donchian Channel) by anchoring VWAPs at the highs and lows. By doing this, the flat levels, characteristic of traditional Donchian Channels, are no more!
Author's Note: This indicator is formed with no inherent use, and serves

Fibonacci Sequence Circles [BigBeluga]🔵 Overview
The Fibonacci Sequence Circles is a unique and visually intuitive indicator designed for the TradingView platform. It combines the principles of the Fibonacci sequence with geometric circles to help traders identify potential support and resistance levels, as well as price expansio

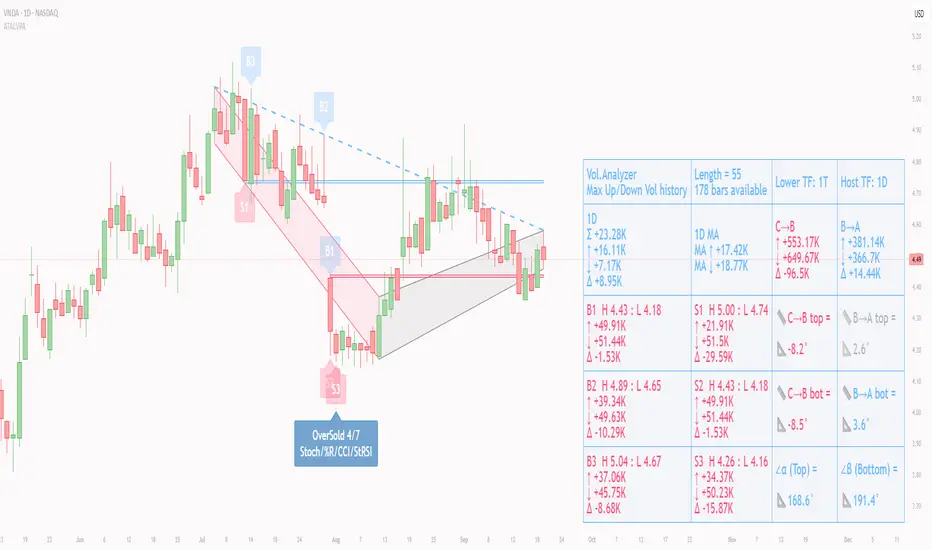
ATAI Volume Pressure Analyzer V 1.0 — Pure Up/DownATAI Volume Pressure Analyzer V 1.0 — Pure Up/Down
Overview
Volume is a foundational tool for understanding the supply–demand balance. Classic charts show only total volume and don’t tell us what portion came from buying (Up) versus selling (Down). The ATAI Volume Pressure Analyzer fills that g
Market Cap Landscape 3DHello, traders and creators! 👋
Market Cap Landscape 3D. This project is more than just a typical technical analysis tool; it's an exploration into what's possible when code meets artistry on the financial charts. It's a demonstration of how we can transcend flat, two-dimensional lines and step into

ZigzagLiteLibrary "ZigzagLite"
Lighter version of the Zigzag Library. Without indicators and sub-component divisions
method getPrices(pivots)
Gets the array of prices from array of Pivots
Namespace types: Pivot
Parameters:
pivots (Pivot ) : array array of Pivot objects
Returns: array array

ZigzagLibrary "Zigzag"
Zigzag related user defined types. Depends on DrawingTypes library for basic types
method tostring(this, sortKeys, sortOrder, includeKeys)
Converts ZigzagTypes/Pivot object to string representation
Namespace types: Pivot
Parameters:
this (Pivot) : ZigzagTypes/Pivot

See all indicators and strategies
Community trends
Sigachi’s Technical Surge: Next Resistance in SightOver the past month, Sigachi traded within a well-defined consolidation range, reflecting a period of equilibrium between buyers and sellers. However, in the most recent week, the stock decisively broke out above this consolidation zone on increased trading volume a classic signal of renewed bulli
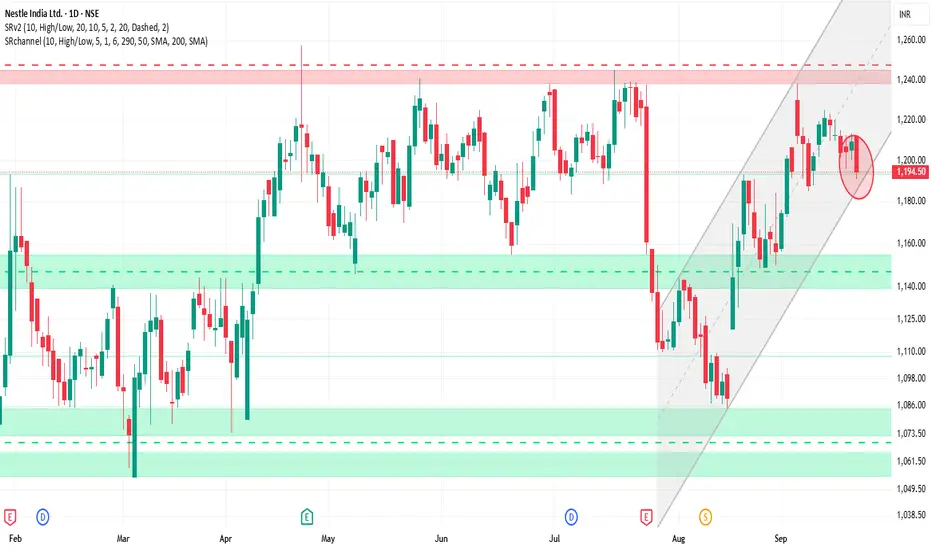
NESTLEIND 1D Time frame📊 Current Snapshot
Closing Price: ₹1,194.50
Day’s Range: ₹1,190.20 – ₹1,212.00
52-Week Range: ₹1,055.00 – ₹1,389.00
Volume: Approximately 2.4 million shares traded
Market Cap: ₹2,30,337 Crores
P/E Ratio: 78.40 (reflecting premium valuation)
Dividend Yield: 2.26%
⚙️ Technical Indicators
Rela
Positive moves on beaten down stock(Adani Green)Posititive news has come for the adani group from higher court. Adani Green is beaten down stock(may be not because of news flows but because of valuation). But now buying is there from the lower levels.
Valuations have come down in last 2-3 years(however still expensive valuation). But may be this
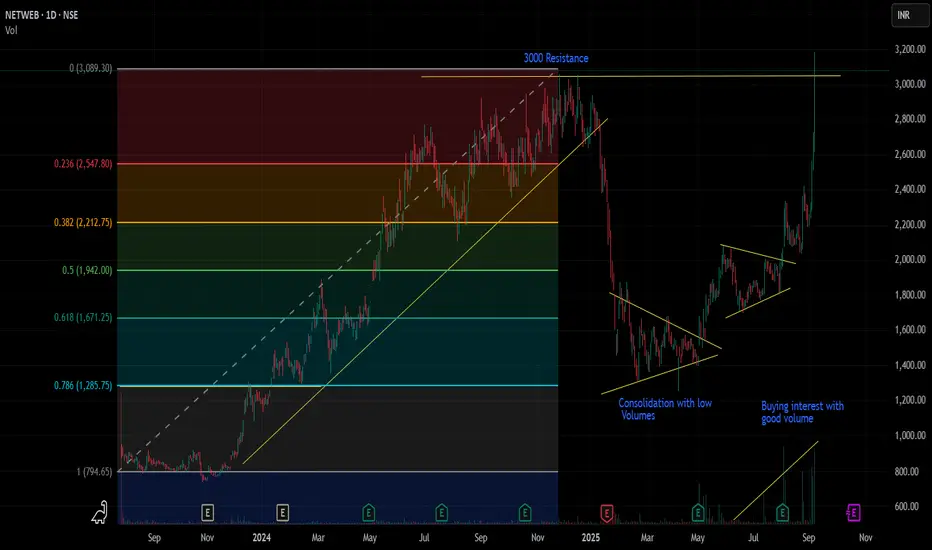
Netweb Technologies : Potential Breakout Since the listing of the stock in July 2023, the stock consolidated for some time and the higher high -higher low journey started in the stock from Jan 2024 which lasted till Nov 2024.
A handsome move from 1300 to 3000 levels within a span of 1 year.
The trendline breakdown of this upward journey
Zydus LifeScience Cmp 1037 Dark Cloud Cover @ topZydus LifeScience Cmp 1037 dated 19-9-2025
1. Dark Cloud Cover @ top
2. RSI breakdown
Sell below 1034 SL 1060 target 1030-1025-1015-1005-1000-990-980
It is just a view, please trade at your own risk.

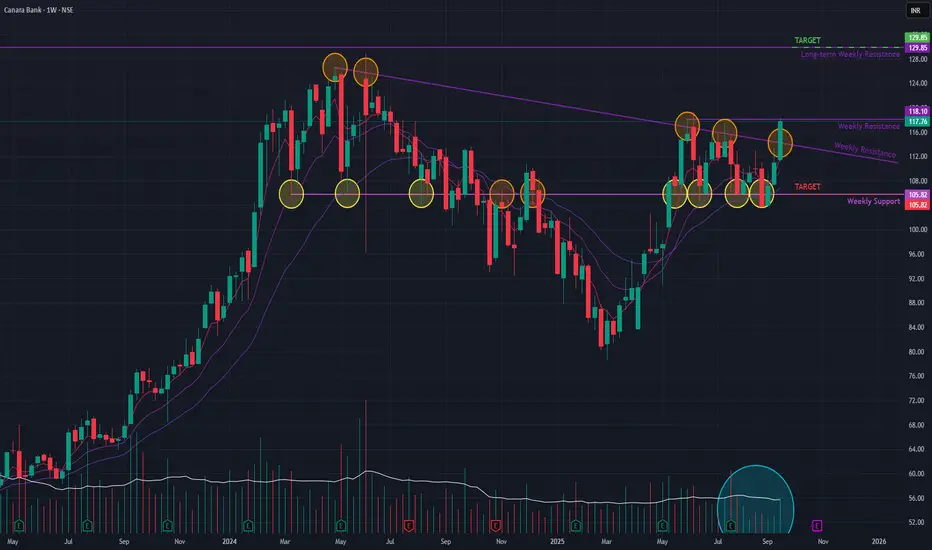
Canara Bank (Weekly) - Will it BreakOut of sideways trend??Canara Bank has demonstrated a significant bullish development this week, breaking out of a key angular resistance trendline . This move was validated by a strong increase in trading volume and a notable +6.13% price surge , signaling renewed buyer interest.
This breakout occurs after a period of
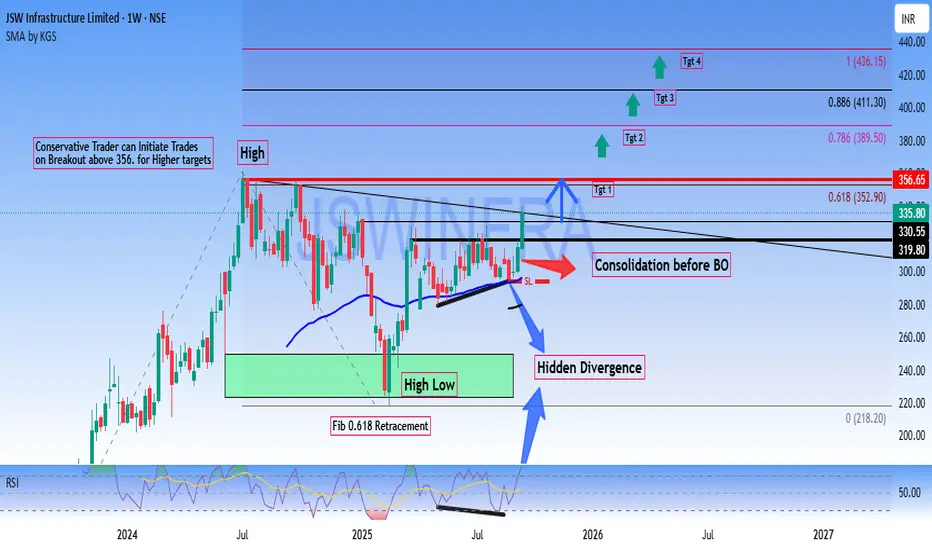
Long JSWINFRA - Short term Investment# JSW Infrastructure Limited (NSE) - Technical Analysis Report
Current Price: 335.80
Key Technical Observations
**Bullish Breakout Setup**
- Breakout Level: Above 356 for conservative trade
Consolidation phase completing before potential breakout (BO) & Stock trading near resistance zone.
Price T
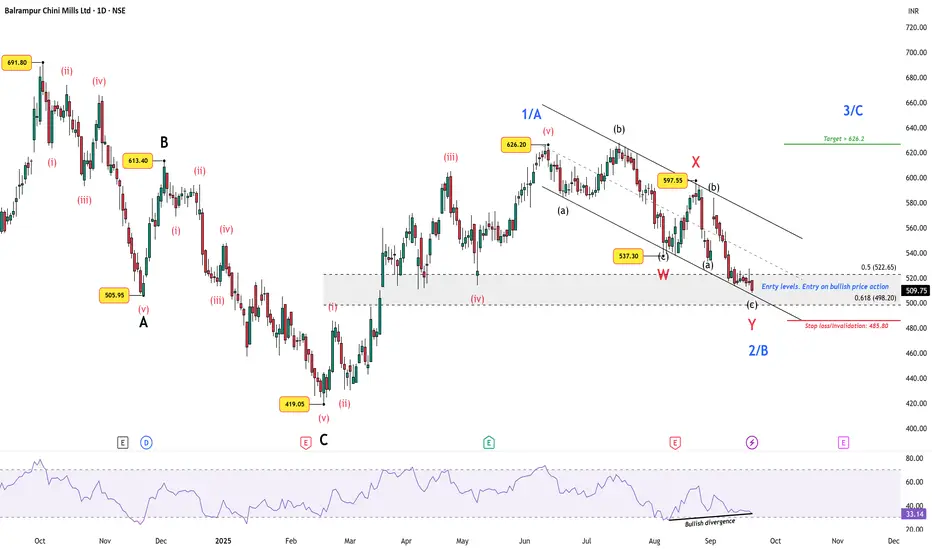
Balrampur Chini: Ethanol Policy Cheer Meets Wave 2/B SetupSugar stocks have been buzzing with news flow. First, the government allowed mills to produce ethanol from sugarcane juice, syrup, and all types of molasses without any restrictions in 2025/26. With strong monsoon rains and expanded cane acreage, supplies look abundant. The move supports India’s roa
Bank of Baroda NSE: Critical Resistance at 256Idea projection for Bank of Baroda (NSE)
256 is a critical resistance: Price previously failed twice at this level and has just approached it once more.
Breakout or rejection: If 256 is convincingly surpassed, the next probable target is the 0.236 Fibonacci extension at 266.25, followed by 283.8

Buy, Sell, or Skip? Multi Timeframe Support ZonesUncover how support levels across multiple timeframes help clarify key buy/sell decisions—purely for technical education.
Chart used is 3 months old for educational purposes only.

See all stocks ideas
No scheduled reports
Community trends
One Last Move This pattern is ideal to understand where price is increasing making higher low
when seen on Graphically representation it looks more like ending diagonal which is popular in the Financial Markets as Pattern suggest the end of ongoing momentum
I have also marked momentum indicator indicating the

A bullish outlookWaves 1, 2, and 3: The chart shows a completed impulse sequence with a long and strong Wave 3, which followed a Bull Flag continuation pattern.
Wave 4 Correction: Gold is currently believed to be in a corrective Wave 4. This correction is taking the shape of an Ascending Broadening Wedge, a pattern


ETHUSD 2.5R sell side trade scenarioETHUSD is forming sell side trades as current bias and draw on liquidity both are at down side. Price has also left SIBIs to attract price upside for a while and then return back to target. In weekend price may have low volatility and trade possibly generate on Monday or later.
1. There is a daily

Bitcoin Market Report – Liquidity Grabs Before Next ExpansionThe market is showing clear signs of engineered volatility, with strong impulsive moves followed by rapid retracements. This behavior reflects liquidity targeting, where price sweeps both sides before resuming its broader path.
Current conditions suggest Bitcoin is in a redistribution stage, with m

BTC/USD (Short Cycles)Namaskaram Everyone
BTC is in uptrend but going down in Medium cycle.
currently risk reward is not much favourable, for that you need to wait for short term cycle retracement.
If you need shorter degree chart i will update it, reply in comments.
Intraday Gear 3
Intraday Gear 2
L

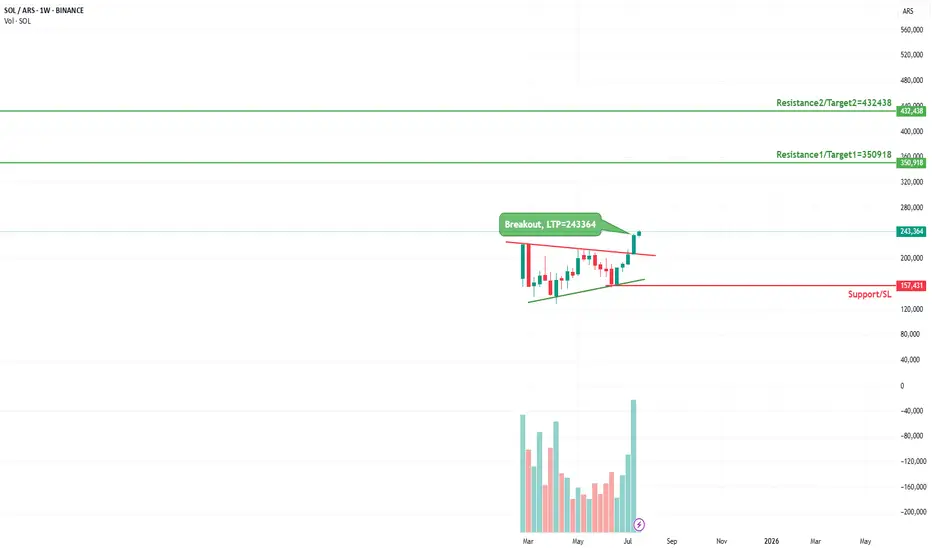
SOLARS - Breakout SetupBINANCE:SOLARS
Charts are self-explanatory. Levels of breakout, possible up-moves (where stock may find resistances) and support (close below which, setup will be invalidated) are clearly defined.
ETH again in trap Zone ETH has fallen as expected in last analysis, but now it is stuck in no trade zone or trap Zone, if we plan long at fibonacci 50% retracement we can expect a short good move ,or it we only can go up after trendline breakout
Disclaimer. This idea is only for education purpose only not for trading loss

ETH BIG HAMMERAfter good correction ETH has made a hammer at the previous liquidity zone (Support).
One can look for Buy on dip from here on in ETH.
SL- 4070
Target- 4300, 4370, 4400
Disclaimer- This is just for Education Purpose.
Follow for mor such content and learnings.
Jai Shree Ram.

Top Forex Weekly Analysis DXY, BTC, GOLD, EURUSD 22-28 Sept 2025DXY (US Dollar Index):
DXY bounced from the key 2011 channel support around 96.60 last week, fueled by the recent Fed rate decision.
Resistance stands at 97.70; a weekly close above this level could push DXY towards 98.60.
As long as it stays above 96.60, the outlook remains cautiously bullish.

See all crypto ideas
GOLD WEEKPLAN: UP FIRST DOWN AFTEROANDA:XAUUSD Footprint Analysis
The Footprint chart provides a more detailed view of the order flow. Here are some key points:
Price Pullback: The recent candles show a decrease in buying pressure (green) and an increase in selling pressure (red).
Volume Footprint: The trading volume (Total) a

XAU/USD Technical Analysis: Major Levels, Market Structure, and 🔎 Current Snapshot
Price now: ~$3,684.98 per ounce.
Investing.com
Today’s trading range: ~$3,632.28 → $3,686.33.
Investing.com
Technical indicators (on sites like Investing.com) are showing a Strong Buy bias. Many moving averages & oscillators are in bullish territory.
⚙ Updated Key Levels (Su
Gold Consolidating Near All-Time HighLast week Gold made a new all-time high around the 3707 level, and we have seen minor pullback after this high, leading to a pullback towards the 3620 -30 area. From there, the price bounced back strongly and is now trading close to the 3700 mark again. Currently, the market seems to be consolidatin

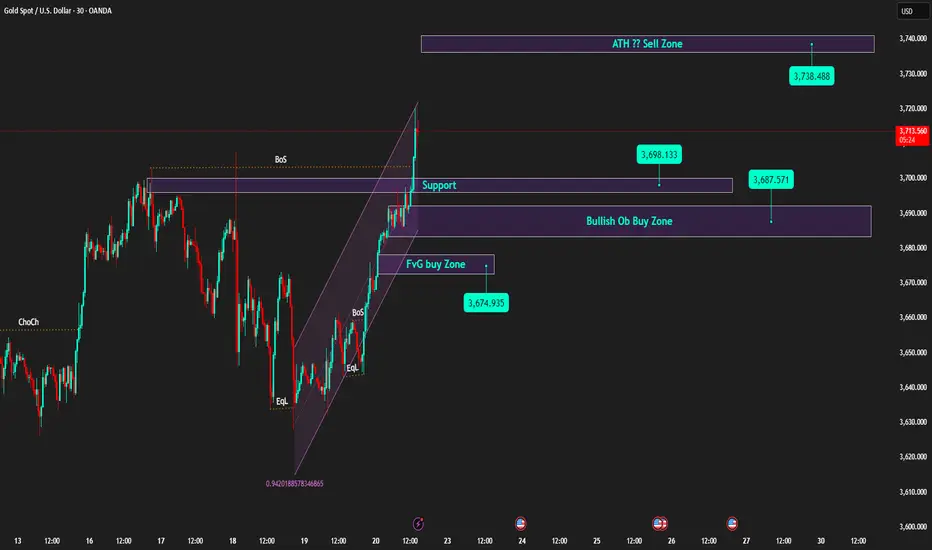
LiamTrading – XAUUSD Trading Scenario for TodayGold continues its robust upward momentum and is now approaching the critical resistance zone around 3,697 – 3,700. This is a confluence point with the Fibonacci extension level and also a zone where sellers might re-enter strongly.
Technical Analysis
On the H1 chart, the price has tested the resi

XAUUSD – The Decisive Zone and Trading ScenariosTechnical Analysis
Gold prices on the H4 chart are in a recovery phase after retesting the support at 3,661–3,662. The latest candle has rebounded strongly to the 3,684 zone, yet the structure still indicates a clear tug-of-war.
The upward trendline was breached in the previous decline, and curren

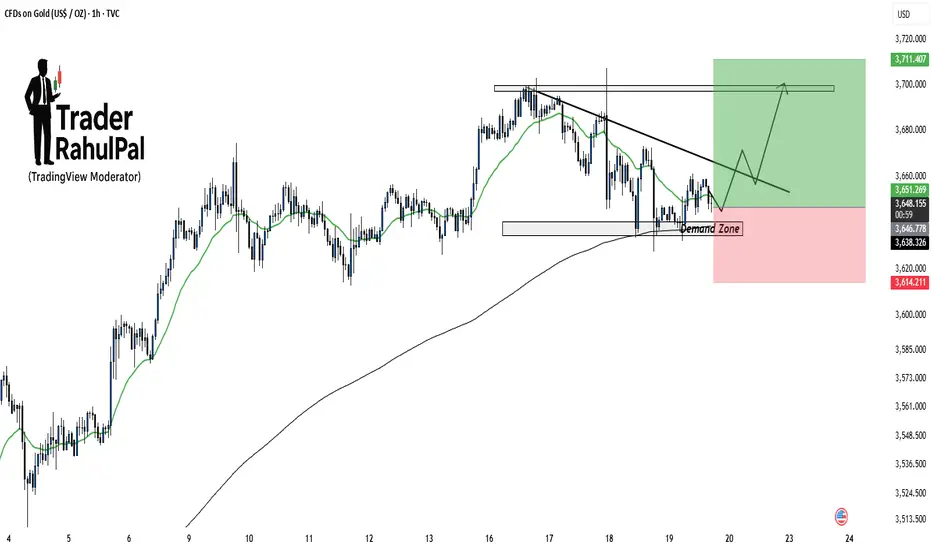
Gold Demand Zone Holding – Upside Potential Toward 3710!Gold is currently testing a demand zone around 3640–3650 , which aligns well with moving average support. As long as this zone holds, price action favors a potential bounce toward the falling trendline and eventually the key resistance area near 3710 . Short-term buyers may look for confirmation i
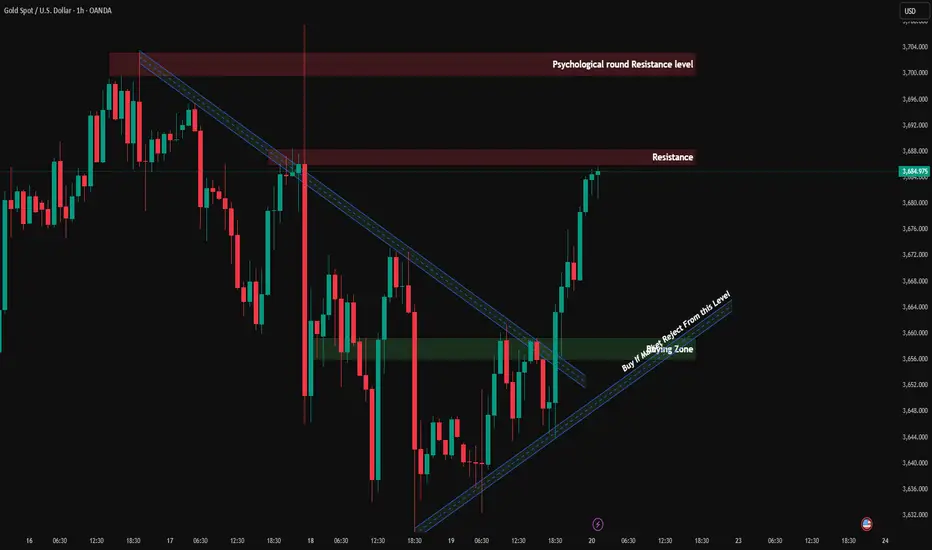
"Bullish Breakout Potential for Gold (XAU/USD) Above Key ?Key Observations:
The price is currently rising and is reaching a key resistance level.
A potential breakout is shown above the resistance at approximately 3,723.
A blue support zone between 3,686 and 3,690 suggests that the price has recently bounced off this level, implying bullish momentum.
T

XAUUSD-UPCOMING PROBALBE DIRECTIONAL ANALYSIS1. We can see a retracement in XAUUSD upto retesting area.
2. Also the move take more time as compaired to previous uptrend, means we can't see clear downtrend here.
3. The lines marked at chart are the characters of the trend, means we can see a bit candle which cross the line.
4. The characters ar

Weekly Candle Closes High | Prioritise Buying on Pullback to Sup🟡 XAU/USD – 22/09 | Captain Vincent ⚓
🔎 Captain’s Log – Quick Overview
Last week, gold closed around 3,685, paving the way for further advancement and a new ATH.
After the FED cut 25bps, Powell's 'brake' remarks slowed the rise, but the larger trend remains bullish.
This morning, prices surged t
Fed Dovish Signals & Geopolitical Tensions Boost Gold📊 Market Context
Gold continues to receive solid support from the Fed’s dovish tone and rising geopolitical tensions. However, the USD has extended its rebound from multi-year lows, which may temporarily limit gold’s upside. Broader risk-on sentiment in financial markets could act as a short-term he

See all futures ideas
GBP/AUD WEEKPLAN: Best Sell Zone Short StoplossFootprint Analysis OANDA:GBPAUD
Previous Trend: The candles before the 18th showed an uptrend. Specifically, the candle on the 17th had a strong positive Delta (+5.24K), with the buy volume (green) dominating the sell volume (red) at most price levels. This confirms that buyers were in control a

EURAUD Bearish SetupIf we look at H4 chart of ICMARKETS:EURAUD , it made a great reversal and formed a bearish Engulf at 70% Fib Level.
The H4 timeframe is forming a slid rationality to be bearish on H1 timeframe. The targets may take a week or so to hit while the SL may hit within a few days.
On H1 timeframe the MAC

GBPUSD – Intraday Buy Setup on 15mMarket Context
Daily: Still bearish, overall higher-timeframe pressure is down.
4H: Price reacted and bounced from a clear Bullish Order Block (OB).
1H + 15m: Both showing bullish momentum and structure shift.
Trade Plan
We are looking for a day trade buy opportunity aligned with the short-term bull

EURO - PLAN FOR TODAYMIL:EURO - I am bearish on D - tf but currently i am looking for a quick retracement during UK Open to fill some upper limits.

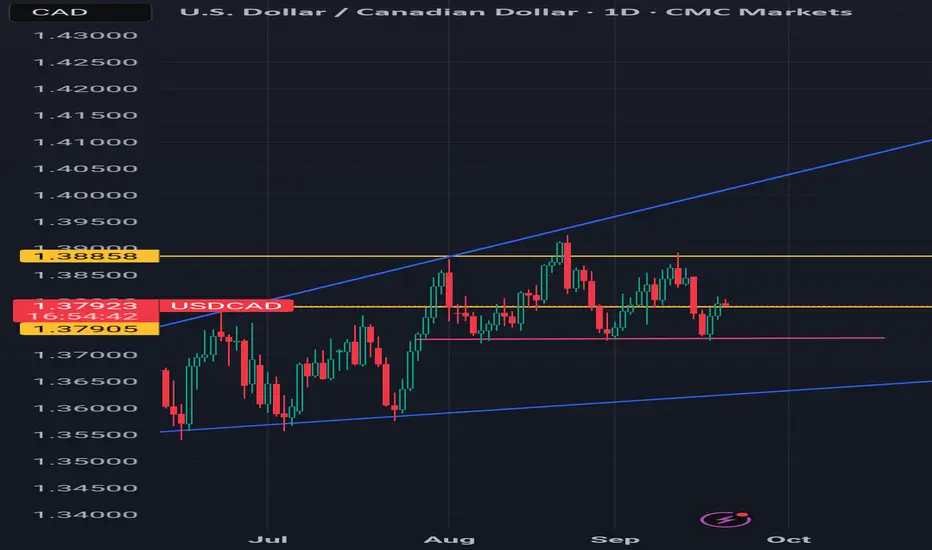
USD CAD 3 top head and shoulders pattern on daily candle A valid fair value gap detected and price is now continuously pusing downwards
selling Eurusddaily time frame market is bullish
4hr = bearish
1hr = bearish
entry at 50% area of 1hr timeframe

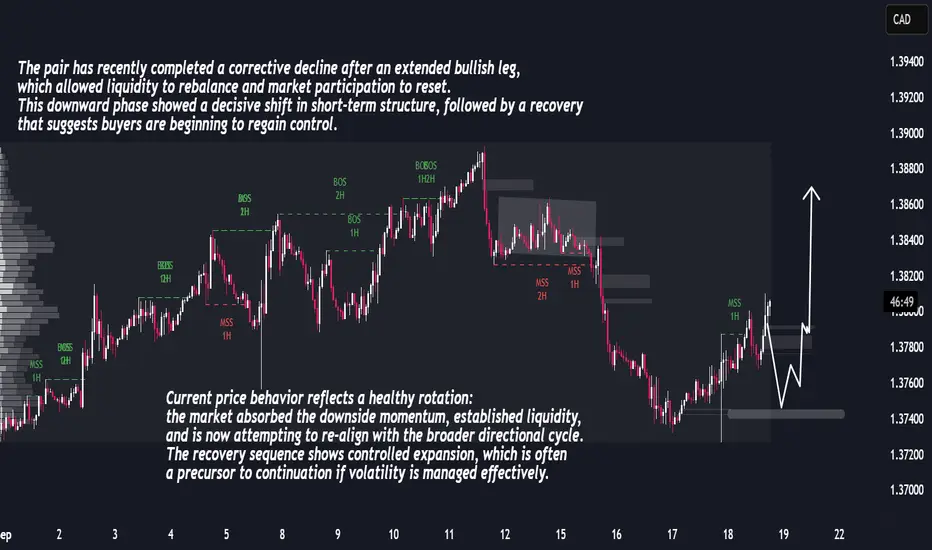
USDCAD Analysis – Market Recovery and Bullish OutlookUSDCAD Analysis – Market Recovery and Bullish Outlook
USDCAD Market Report
USDCAD is emerging from a completed downside leg into a constructive recovery cycle. The prior bearish momentum created imbalance, but recent order flow shows that liquidity has been absorbed, allowing buyers to regain contr
GBPUSD MULTI TIME FRAME ANALYSISHello traders , here is the full multi time frame analysis for this pair, let me know in the comment section below if you have any questions , the entry will be taken only if all rules of the strategies will be satisfied. wait for more price action to develop before taking any position. I suggest yo

Short Idea (EUR/USD)Entry: Around 1.1848 (current price level)
Stop Loss (SL): 1.1859 (above recent swing high)
Target 1: 1.1834 (support area shown on your chart)
Target 2: 1.1825 (if momentum continues downward)
Reasoning:
Price is failing to break above resistance at 1.1850-1.1860.
Recent candles show rejectio

See all forex ideas
| - | - | - | - | - | - | - | - | ||
| - | - | - | - | - | - | - | - | ||
| - | - | - | - | - | - | - | - | ||
| - | - | - | - | - | - | - | - | ||
| - | - | - | - | - | - | - | - | ||
| - | - | - | - | - | - | - | - | ||
| - | - | - | - | - | - | - | - | ||
| - | - | - | - | - | - | - | - | ||
| - | - | - | - | - | - | - | - |
Trade directly on the supercharts through our supported, fully-verified and user-reviewed brokers.


