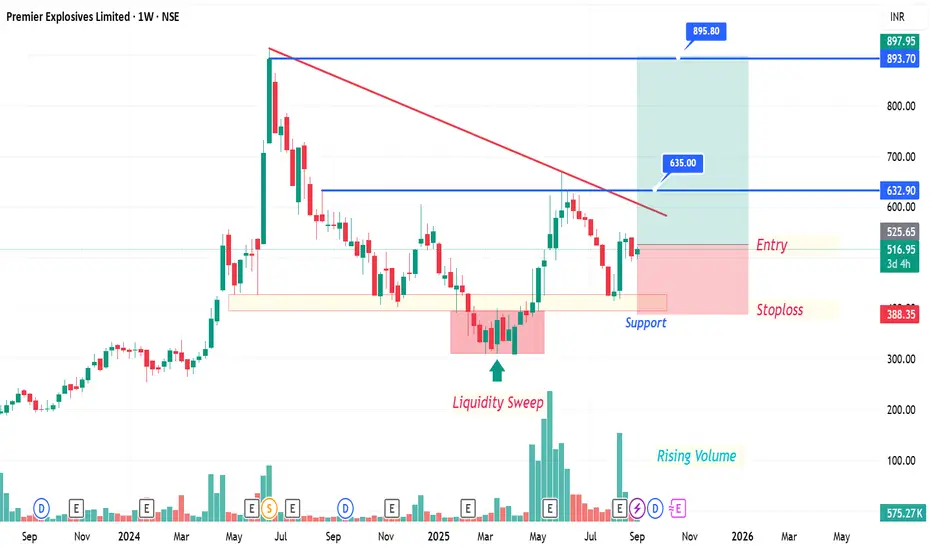
Premier Explosives Limited (NSE: PREMIER) Analysis -1WWeekly Chart Analysis
✅ Support Zone: Strong base around ₹388–400 held well with a liquidity sweep.
📈 Rising Volumes: Indicating accumulation and strong buying interest.
🔻 Downtrend Line: Stock approaching breakout zone near ₹632–635.
📌 Entry Zone: Around ₹517–525 (current levels).
⛔ Stoploss:

The best trades require research, then commitment.
Get started for free$0 forever, no credit card needed

Scott "Kidd" PoteetThe unlikely astronaut

Where the world does markets
Join 100 million traders and investors taking the future into their own hands.
Major indices
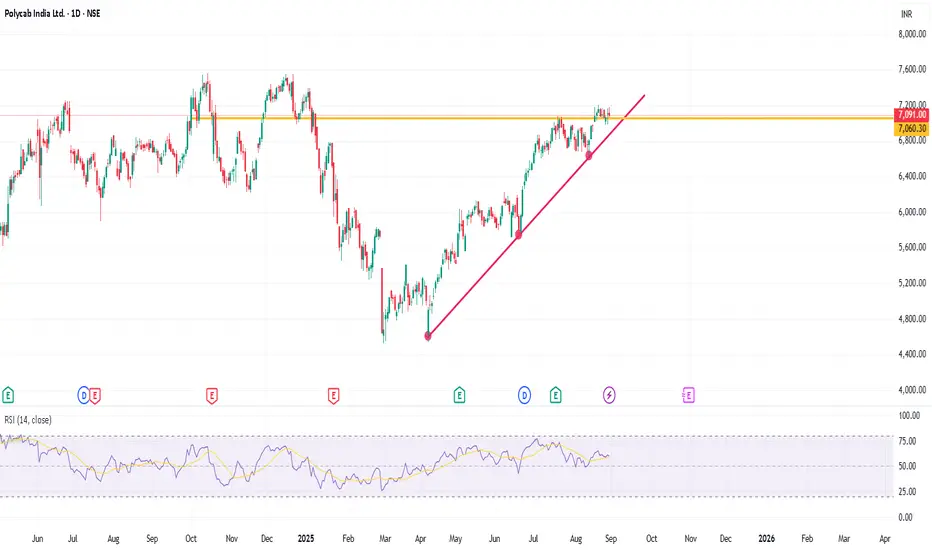
POLYCABThis analysis is intended solely for educational purposes and does not constitute financial advice.
Polycab is showing gradual bullish momentum, supported by a trendline reversal and trading above a key support level. The stock is currently in a minor consolidation phase, which may signal accumulat
Dixon Inverted HnSDixon Technologies is making a inverted Head n shoulder in the daily timeframe.
One can look for taking an entry at the retest of 17300-17320. Support can be considered at todays low. Keep a Check on the Chart and you will get to see how a head n shoulder is made.
Usually the Support for a HnS is

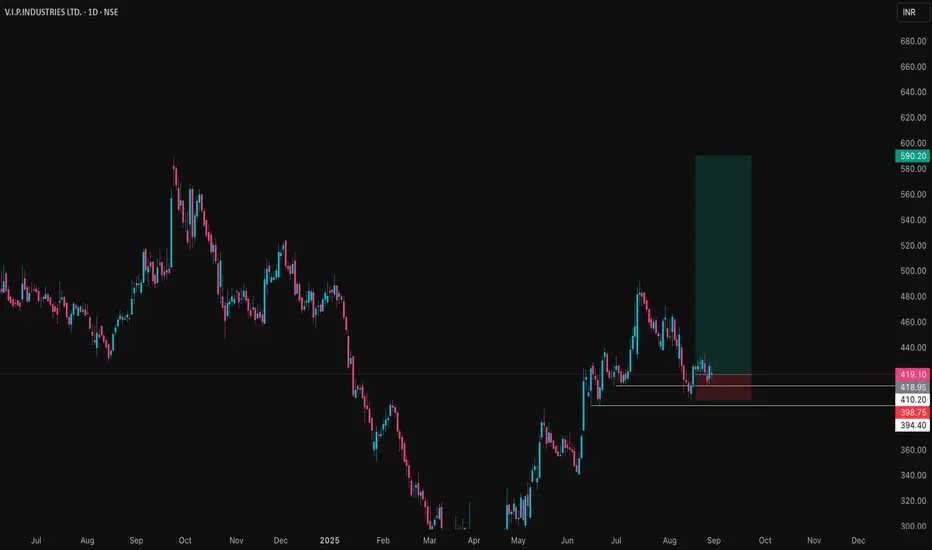
VIPIND Price ActionVIP Industries is trading around ₹420 at the end of August 2025, showing relative stability despite recent operational headwinds. The company reported a decline in both revenue and profitability for the June quarter, with net sales falling to approximately ₹561 crore and a posted net loss of about ₹
Garuda Construction – Cup & Handle Breakout | Swing Trade PlanGaruda Construction has given a textbook Cup & Handle breakout backed by strong volume and solid fundamentals.
Technical Analysis
A Cup & Handle pattern has formed with a neckline breakout above ₹200.
Stock closed strongly at ₹216.33 (+9.66%) with massive volume (7.5M vs 3.1M avg) - confirms inst

Support and Resistance Concept- Bank NiftyThis article concentrates on Support and resistance concept from investment perspective with Bank Nifty monthly chart example.
Let us first understand a few things:
⚪ In simple terms, a resistance is a level from where price rejects significantly because sellers dominated buyers. Contrastingly, su

Liquidity Grab Completed – Bulls Back in Control?Liquidity Grab Completed – Bulls Back in Control?
Key Technical Insights:
Resistance Rejection: Price sharply rejected the 120K – 123K resistance zone, confirming this area as a key supply level.
Bearish Liquidity Flow: After rejection, BTC flowed within a descending liquidity channel, continuous
ENDURANCE TECH LOOKS GREATThe stock has been forming an cup and handle pattern lately.
It has a good consolidation of more than one year , the fundamentals are flourishing as well making it a perfect pick for a quick gains
The 2987 level acts as a crucial resistance for the stock , upon breaching that the stock can give mo

hindalco bearish biashindalco on daily frame is on a major resistance level and has also reacted postively to the resistance by rejecting upward movemnt.
hindalco also made a double top pattern on 4hours timeframe
hindalco news is postive but not reacted much , i would suggest wait and watch this any further downa

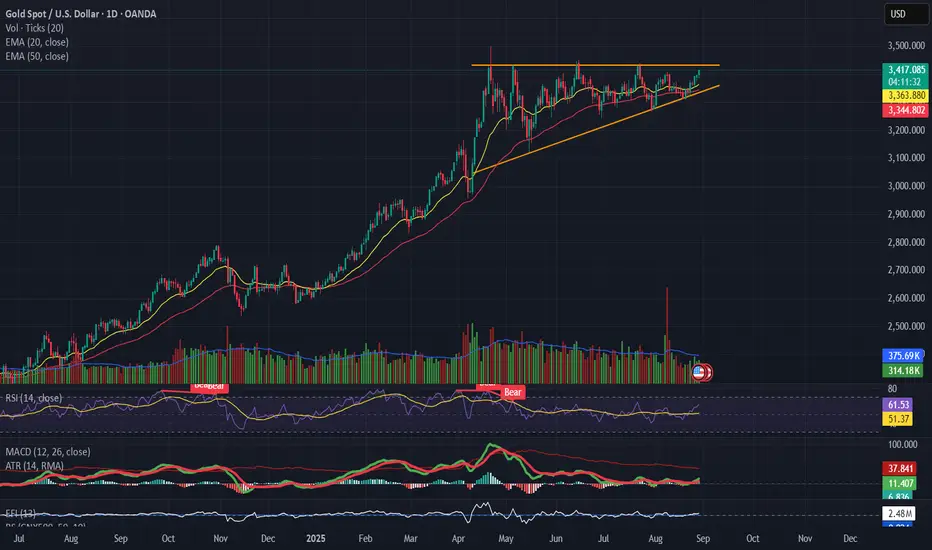
GOLD(XAUUSD) Forming a pennant / ascending triangle 📌 Gold (XAUUSD)
Forming a pennant / ascending triangle with strong resistance near $3,390 – 3,400.
Volume is declining, suggesting indecision.
RSI holding above 50 but not powering higher → momentum is slowing.
MACD flatlining, no fresh bullish impulse yet.
👉 Breakout above $3,400 needed for con
See all editors' picks ideas
VWAP Price ChannelVWAP Price Channel cuts the crust off of a traditional price channel (Donchian Channel) by anchoring VWAPs at the highs and lows. By doing this, the flat levels, characteristic of traditional Donchian Channels, are no more!
Author's Note: This indicator is formed with no inherent use, and serves

Fibonacci Sequence Circles [BigBeluga]🔵 Overview
The Fibonacci Sequence Circles is a unique and visually intuitive indicator designed for the TradingView platform. It combines the principles of the Fibonacci sequence with geometric circles to help traders identify potential support and resistance levels, as well as price expansio

ATAI Volume Pressure Analyzer V 1.0 — Pure Up/DownATAI Volume Pressure Analyzer V 1.0 — Pure Up/Down
Overview
Volume is a foundational tool for understanding the supply–demand balance. Classic charts show only total volume and don’t tell us what portion came from buying (Up) versus selling (Down). The ATAI Volume Pressure Analyzer fills that g

Market Cap Landscape 3DHello, traders and creators! 👋
Market Cap Landscape 3D. This project is more than just a typical technical analysis tool; it's an exploration into what's possible when code meets artistry on the financial charts. It's a demonstration of how we can transcend flat, two-dimensional lines and step into

ZigzagLiteLibrary "ZigzagLite"
Lighter version of the Zigzag Library. Without indicators and sub-component divisions
method getPrices(pivots)
Gets the array of prices from array of Pivots
Namespace types: Pivot
Parameters:
pivots (Pivot ) : array array of Pivot objects
Returns: array array

ZigzagLibrary "Zigzag"
Zigzag related user defined types. Depends on DrawingTypes library for basic types
method tostring(this, sortKeys, sortOrder, includeKeys)
Converts ZigzagTypes/Pivot object to string representation
Namespace types: Pivot
Parameters:
this (Pivot) : ZigzagTypes/Pivot

Angled Volume Profile [Trendoscope]Volume profile is useful tool to understand the demand and supply zones on horizontal level. But, what if you want to measure the volume levels over trend line? In trending markets, the feature to measure volume over angled levels can be very useful for traders who use these measures. Here is an att

MathEasingFunctionsLibrary "MathEasingFunctions"
A collection of Easing functions.
Easing functions are commonly used for smoothing actions over time, They are used to smooth out the sharp edges
of a function and make it more pleasing to the eye, like for example the motion of a object through time.
Easing function

Treasury Yields Heatmap [By MUQWISHI]▋ INTRODUCTION :
The “Treasury Yields Heatmap” generates a dynamic heat map table, showing treasury yield bond values corresponding with dates. In the last column, it presents the status of the yield curve, discerning whether it’s in a normal, flat, or inverted configuration, which determined by us

Time & Sales (Tape) [By MUQWISHI]▋ INTRODUCTION :
The “Time and Sales” (Tape) indicator generates trade data, including time, direction, price, and volume for each executed trade on an exchange. This information is typically delivered in real-time on a tick-by-tick basis or lower timeframe, providing insights into the traded size

See all indicators and strategies
Community trends
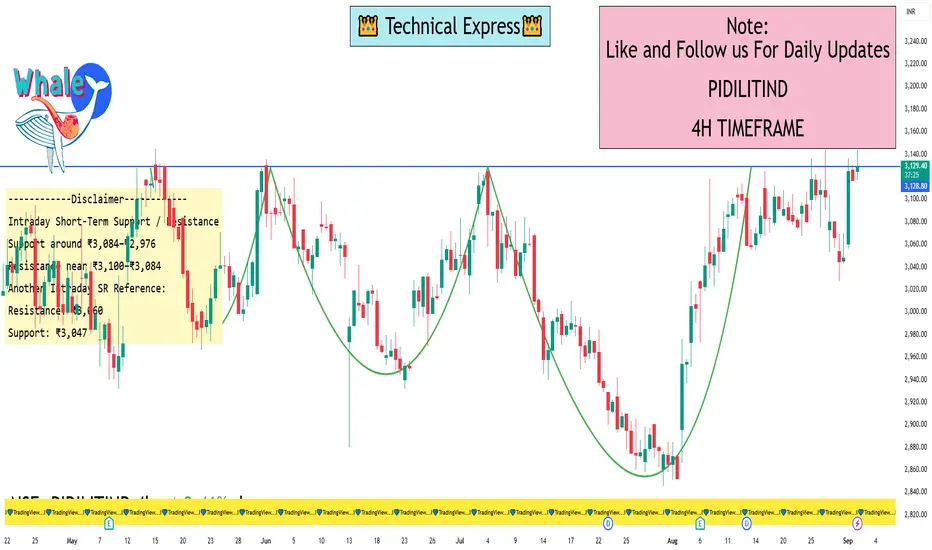
Pidilite Industries Ltd. 4 Hour View While most platforms don’t explicitly publish 4-hour support/resistance levels, we can gather actionable insights from intraday pivot data and community analysis reflecting this timeframe.
Intraday Pivot & Intra-Day Levels
Intraday support levels: ₹3,028.27 and ₹3,006.23
Intraday resistance level
Premier Explosives Limited (NSE: PREMIER) Analysis -1WWeekly Chart Analysis
✅ Support Zone: Strong base around ₹388–400 held well with a liquidity sweep.
📈 Rising Volumes: Indicating accumulation and strong buying interest.
🔻 Downtrend Line: Stock approaching breakout zone near ₹632–635.
📌 Entry Zone: Around ₹517–525 (current levels).
⛔ Stoploss:
Multi-Confirmation Price Action: Fibonacci Zones, Base BreakoutsExplore multi-confirmation techniques using Fibonacci retracement to identify high-probability base breakout zones. Learn how to spot double bottom and inverted head & shoulders patterns at demand levels and execute confirmation trades for precision entries

#Buying opportunity Marksans PharmaStock is near 200 ema on weekly chart and RSI is 32, which is showing good signal for fresh buying opportunity near 160-170. New buyers may buy in SIP mode for accumlate for long.

BSE Ltd – Corrective W–X–Y In ProgressThe previous impulsive wave topped at ₹3030, marking an all-time high.
Since then, the structure has unfolded as a W–X–Y corrective double three. The market is now progressing within Wave Y, with Wave (a) already driving price down to ₹2090.
For Wave (b), watch for price rejection either at the mi

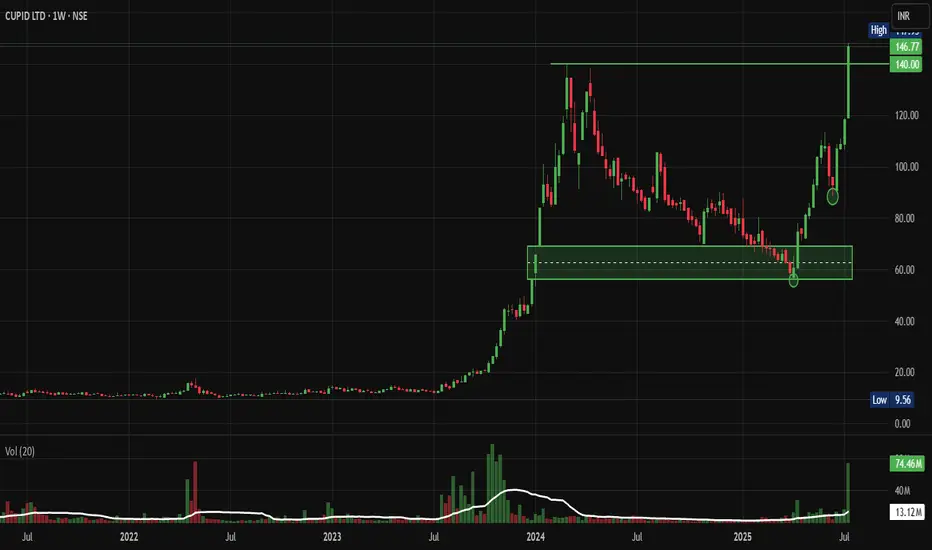
Cupid: Past Multibagger Forming Rounding Bottom BreakoutFrom ₹10 to ₹150: How CUPID Stock Became a Multibagger Dream and What's Next. Let's analyse and Deep Dive into my Chart of the Week Idea.
Price Action Analysis:
Long-term Trend Analysis:
- Primary Trend: Strongly bullish multi-year uptrend since 2023
- Trend Structure: Classic accumulation-mar
Exide Industries – Ready for Breakout After Long Accumulation📈 Exide Industries – Ready for Breakout After Long Accumulation
Chart Pattern:
Stock has been consolidating in an accumulation phase after forming a Bullish Order Block around ₹320–340.
A cup-shaped structure has developed with higher lows, indicating strong demand absorption.
Price has n

Dixon Inverted HnSDixon Technologies is making a inverted Head n shoulder in the daily timeframe.
One can look for taking an entry at the retest of 17300-17320. Support can be considered at todays low. Keep a Check on the Chart and you will get to see how a head n shoulder is made.
Usually the Support for a HnS is
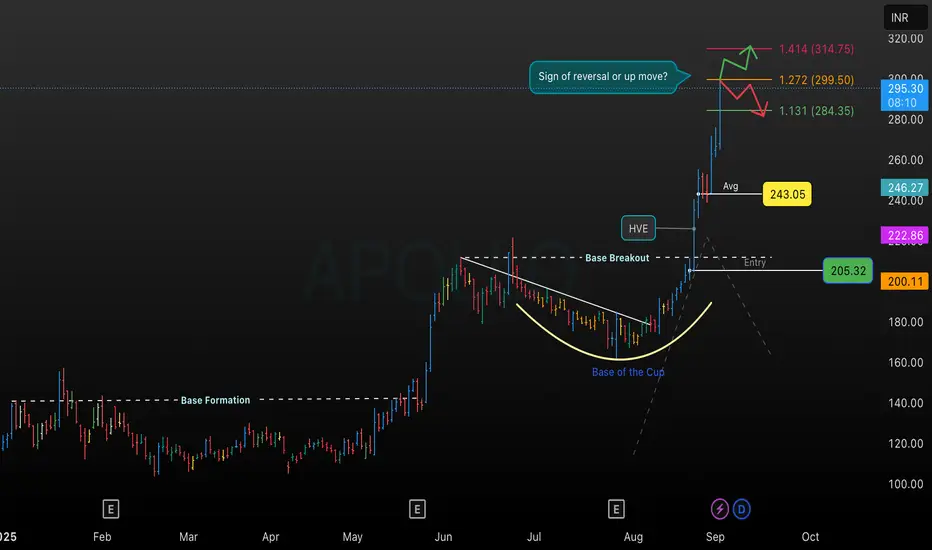
APOLLO Ignites! Explosive Move Will Bulls Hit AllFib Extensions This chart highlights Apollo’s formation of a Cup and Handle pattern, followed by a decisive breakout above the base resistance. The “Base Formation” and “Base of the Cup” mark notable accumulation phases, culminating in a sharp bullish move post-breakout.
Price Action and Levels
• Entry Trigger: T
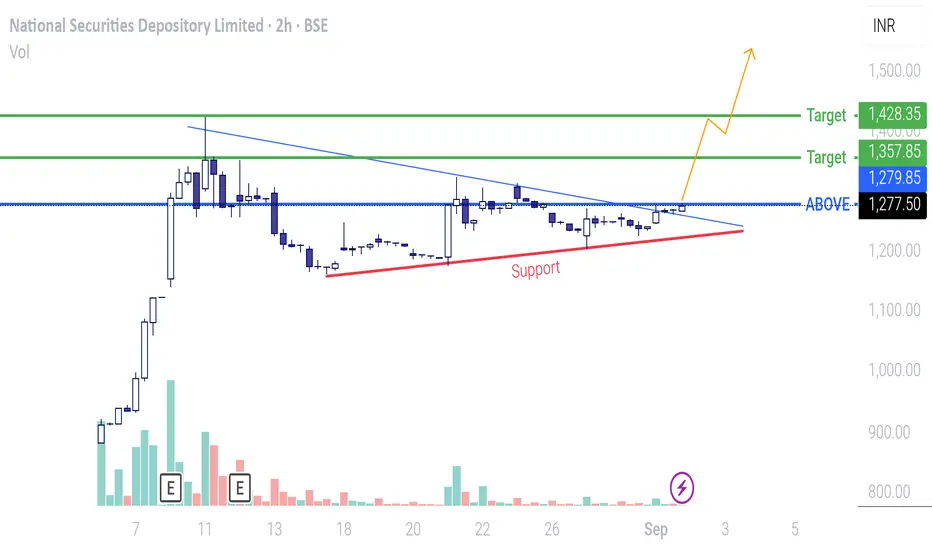
NSDL - TriangleAfter the initial IPO rally, it was time for some consolidation. Now that the triangle has been formed a break out is around the corner.
This is purely a swing trade. Kindly be noted that the valuation of the stock is on the higher side.
See all stocks ideas
Community trends
Bitcoin – Technical Outlook for the New WeekBitcoin – Technical Outlook for the New Week
Hello traders,
BTC continues to follow the expected path. On the chart, price has held steady after breaking down from the rising channel, and the medium-term bearish structure on the H4 timeframe remains in play.
For the longer term, we would still ne
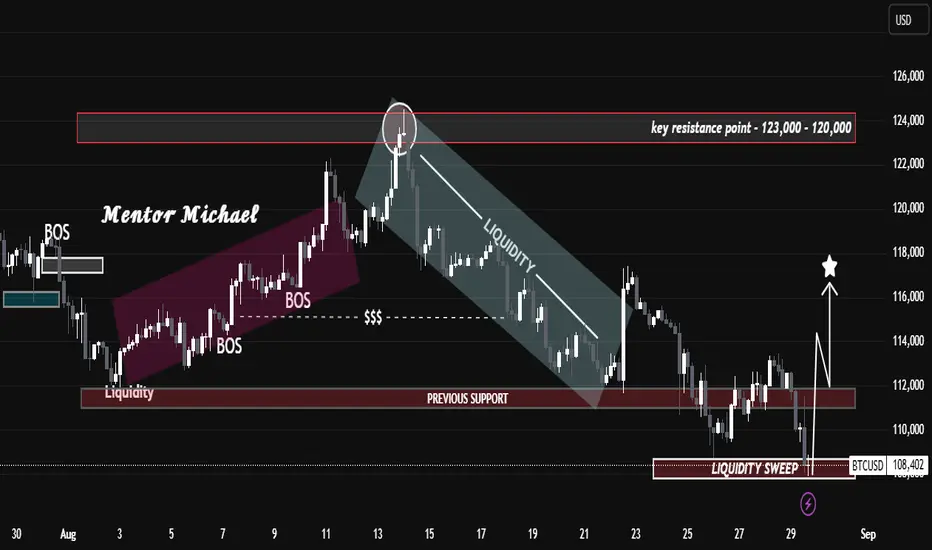
Liquidity Grab Completed – Bulls Back in Control?Liquidity Grab Completed – Bulls Back in Control?
Key Technical Insights:
Resistance Rejection: Price sharply rejected the 120K – 123K resistance zone, confirming this area as a key supply level.
Bearish Liquidity Flow: After rejection, BTC flowed within a descending liquidity channel, continuous
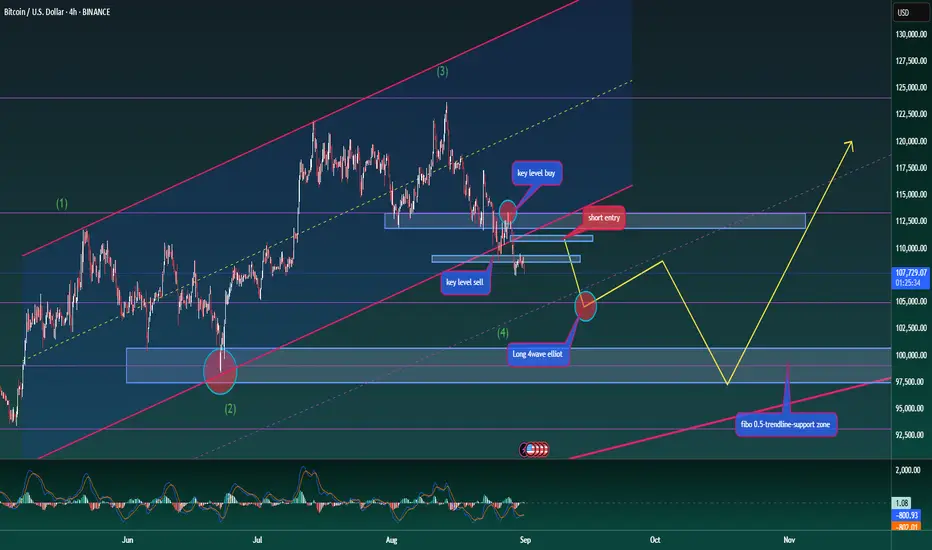
BTC - ShortThe price is currently around $109,930.The chart outlines a gray zone above and a green zone below, representing likely resistance (where sellers may step in) and support (where buyers may be active).
A red shaded area near the current price marks the 50% retracement level—often a key decision point

BTCUSD LOOK LIKE BAT PATTERN Here i would like to show you all that there is pattern formation which is known as BAT PATTERN.
> This pattern is known as reversal pattern.
> Reversal will be confirmed when today's candle get closed above previous day candle.
> Be carefull if breakout not sustained above previous day candle for

Long viewI am going long from here for the target of 5000 As per three drive pattern.
It also touched the 4hr orderblock and getting rejection too.
If everthing goes good this trade would be amazing 😍
Trade as per your risk management.
Thak you .

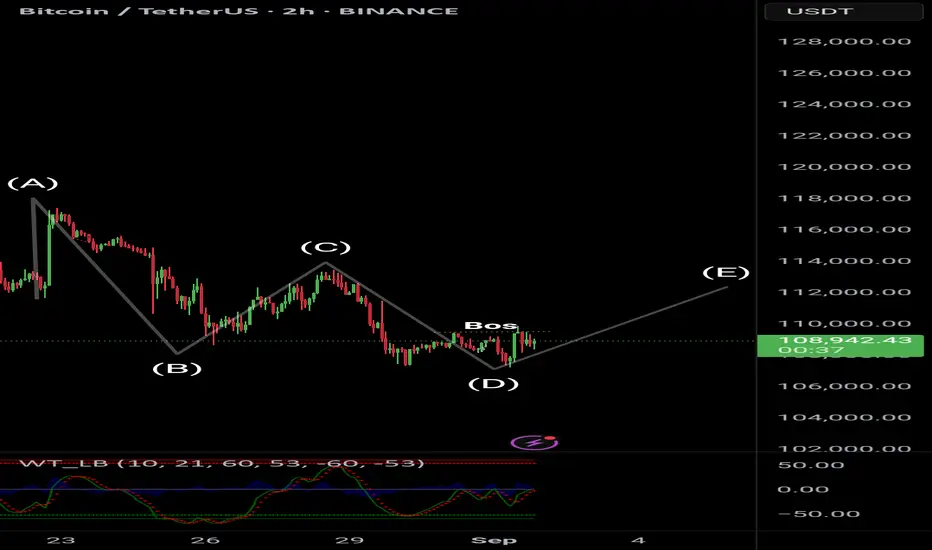
BTC/USDT – Elliott Wave Structure with BOS ConfirmationBTC/USDT – Elliott Wave Structure with BOS Confirmation
On the 2H timeframe, Bitcoin is showing a clear Elliott Wave corrective pattern:
Wave A → B → C → D completed
BOS (Break of Structure) confirms a potential shift towards a bullish reversal.
Price is consolidating near the $108,800 level, pr
ETH plan 1/9/2025 LTFTrading Plan for ETH
Primary Scenario (Red Path)
Expect a pullback toward the 4,000 level, forming a potential bottom structure.
Alternate Scenario (Blue Path)
If price breaks below 4,000, watch for deeper retracement toward the FVG HTF (~3,800) or even the Demand zone (~3,400). This area may off

Btc long 1H TimeframeKey Observations:
1. Chart Type & Indicators:
• Timeframe: 1 Hour (1H)
• Indicators: EMA 9 (yellow), EMA 20 (blue) for short-term trend tracking.
2. Price Action:
• Current Price: 109,260 USDT
• Recently bounced sharply after a strong dip, showing bullish recovery.
3. Pattern:
• There’s a vi

btc paper trade plannedETF Outflows: Over $1.17 billion pulled from major Bitcoin ETFs, signaling caution from institutional investors
Network Activity: Dropped by 13%, indicating weaker speculative demand
Historical Trends: September has been a weak month for BTC in 8 of the last 12 years
Momentum Forecast
Sideways

Gold SPOT XAUUSD SHORT idea at 3469 after 23 July 2025GOLD XAUUSD Short idea : Trade will activate on 23 July 2025 ..Gold Should Short from 3469

See all crypto ideas
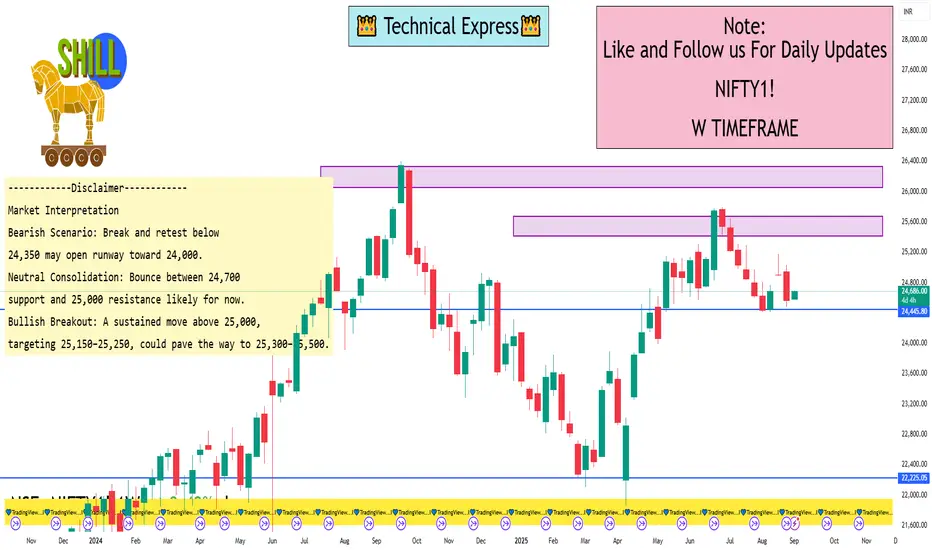
S&P CNX Nifty Index Futures 1 Week View1. Technical Levels — Weekly Pivot Points & Fibonacci Zones
Thanks to TopStockResearch, here are the key pivot-derived levels for the weekly timeframe:
Standard Weekly Pivots:
Support 2 (S2): ~24,213.80
Support 1 (S1): ~24,000.80
Pivot (Central): ~24,830.70
Resistance 1 (R1): ~25,234.60
Resis
“The Art of Traps: Understanding Fake Breakouts in XAUUSD”“The Art of Traps: Understanding Fake Breakouts in XAUUSD”
This chart illustrates how gold (XAUUSD) is currently navigating a critical battle between resistance and support.
At the top, the resistance zone (3440–3460) has already shown signs of rejection, hinting at a possible fake breakout scenar

SILVERHello & welcome to this analysis
Silver in daily time frame appears to be in its 5th wave.
The larger impulse could end anywhere between $43.50 - 45 / INR 125000 - 129000. From there I expect it to retrace to $38 /INR 116000
MCX Silver will depend largely on $:INR movement.
Silver remains a stro

GOLD Bullish ScenarioGold is trading near ATH on 1st September it rallied from the previous session's closing price after taking a minor retracement and broken the consolidation zone.

Gold 01/09: FVG Retracement – Buy on Dips, Short near 3515SMC Market View – 01 September
Gold is continuing its bullish order flow, with clear BOS and ChoCH signals already confirmed. Price has formed an FVG (Fair Value Gap) near 3463, and is now showing momentum towards the 3515 supply zone.
✅ BUY Setups
Buy Zone 1: 3418 – 3422
Strong demand area with

XAUUSD Trade Idea – Short SetupPair: XAUUSD (Gold/USD)
Type: Sell Setup
Risk/Reward Ratio: 2.7 : 1
🔹 Technical Overview:
Price is moving inside a descending channel, respecting both the upper and lower trendlines.
Recent rejection near the upper channel resistance indicates continuation of bearish pressure.
A short position i

XAU/USD Bullish Setup – Buy from POI Zone Towards 3545 TargetXAU/USD (15M Chart) Analysis
Trend Analysis:
Price is in a clear uptrend, supported by higher highs and higher lows above the EMA 70 & EMA 200. Both EMAs are pointing upward, confirming bullish momentum.
POI & FVG Zone:
A POI/FVG buying zone (highlighted in pink) is marked between 3481 – 3491, act

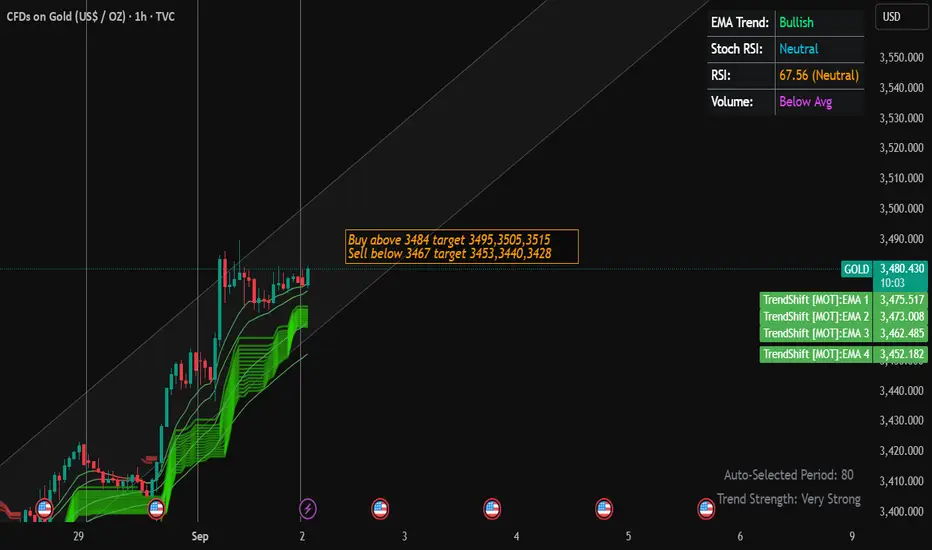
Gold Trading Strategy for 02nd September 2025📊 Gold Intraday Trading Plan
🔼 Buy Setup
Entry: Buy above the high of a 15-min candle that closes above $3484
Targets:
1st Target: $3495
2nd Target: $3505
3rd Target: $3515
🔽 Sell Setup
Entry: Sell below the low of a 1-hour candle that closes below $3467
Targets:
1st Target: $3453
2nd Targ
XAGUSD / SILVER / SI ANALYSIS 01-SEP-2025LTP: 40.44x
Supports: 38.07/37.41/35.21
As long as the above supports levels hold, we will see 40.89-41.77-43.16 first.
Further Targets:
45.07
46.73-47.55-48.91 (Ultimate target)
52.50-53.37-55.95 (Extension)

High probability 1:7 Gold buy scenario.Gold is developing nice scenario for upside move. Currently it is under consolidation. We are expecting manipulation toward FVG (1 and 15m overlapping) and then upward movement after liquidity sweep. Below is detail
1. Price has created Break of Structure.
2. Displacement happened, which created FV

See all futures ideas
1:7 RnR trade opportunity on GBPCADGBPCAD is forming a great price action and scenario. Which may lead to high risk and reward trade. Below are the signals noticed ...
1. Price has broken 10 days’ consolidation of trend line and nearby resistance as well.
2. Created BOS and FVG on 1-hour time frame in discount area.
3. Price is runn

GBP/USDOn hourly time frame there is breakout visible.
I have planned a long trade on breakout confirmation.
Minimum target I am considering is 1:1 then 1:2
In case of reversion I will go short below my sl.

USDJPY MULTI TIME FRAME ANALYSISHello traders , here is the full multi time frame analysis for this pair, let me know in the comment section below if you have any questions , the entry will be taken only if all rules of the strategies will be satisfied. wait for more price action to develop before taking any position. I suggest yo


AUDJPY SHORTSAUDJPY – Short Setup Idea
Bulls are clearly showing weakness — just look at the 4H chart on the right. The climb has been slow and corrective, suggesting a lack of strong momentum to the upside.
Price has recently reached into a 4H supply zone. At first glance, it looked as though the zone was inv

NZDUSD selling setupNZDUSD trade setup :-
1.resistance taken from trendline
2.price bending
3.lower strength
4.dxy is bullish

USDCHFlooking at the chart, the higher time frame is pro bearish and this can be a quick scalp for those who see the weakness in structure.
just sharing the thoughts, not a financial advice.

USD/JPY – Bearish Setup (H-Pattern Formation)USD/JPY – Bearish Setup (H-Pattern Formation)
The USD/JPY pair is currently forming a classic bearish "h" continuation pattern, indicating potential downside momentum.
Key Highlights:
Price action is consolidating near the 147.400 liquidity zone after a strong bearish impulse.
The pattern shows l

USD CHF ...PAPER TRADEBullish Scenario
Resistance Levels:
0.8075 — minor resistance; a break could signal a rebound
0.8100 — psychological barrier
0.8139 — 100-day SMA
0.8170 — recent high; retest possible if momentum shifts
Technical Indicators
RSI: Near neutral, suggesting sideways momentum
Bias: Mildly bearish u

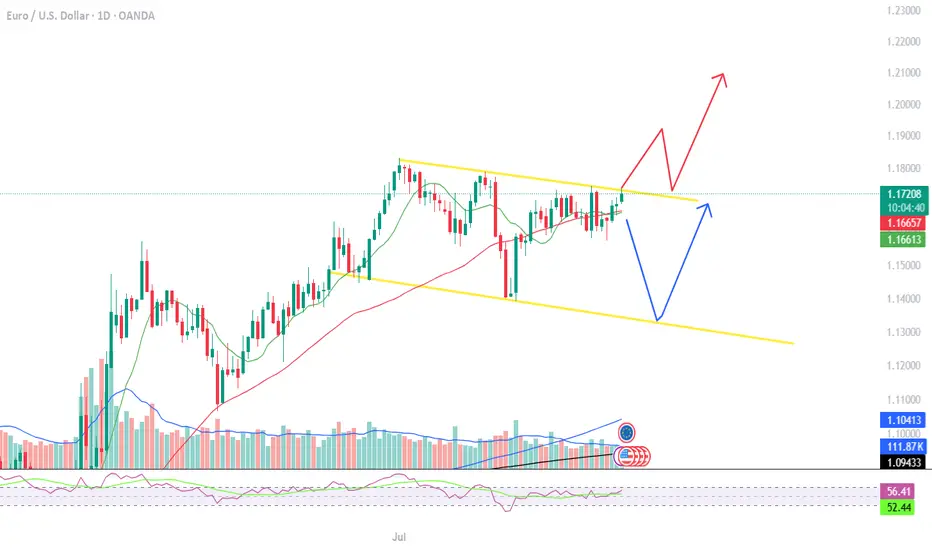
Eurusd next move ,analysis Eurusd has reached resistance in daily time frame .above 1.1735 it will continue the upward momentum .holidng will lead to a fall .both direction are mention
See all forex ideas
| - | - | - | - | - | - | - | - | ||
| - | - | - | - | - | - | - | - | ||
| - | - | - | - | - | - | - | - | ||
| - | - | - | - | - | - | - | - | ||
| - | - | - | - | - | - | - | - | ||
| - | - | - | - | - | - | - | - | ||
| - | - | - | - | - | - | - | - | ||
| - | - | - | - | - | - | - | - | ||
| - | - | - | - | - | - | - | - |
Trade directly on the supercharts through our supported, fully-verified and user-reviewed brokers.


