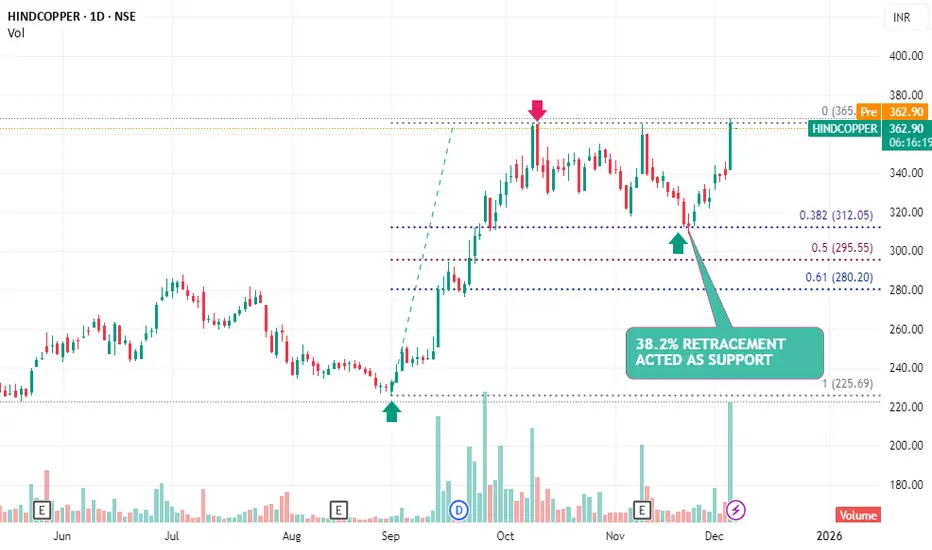
HINDCOPPER – Support at 38.2% Retracement With Reversal SignalHIHINDCOPPER has respected the 38.2% Fibonacci retracement level, indicating that buyers are active at this key support zone. The formation of a reversal candle (DOJI) at this level strengthens the probability of a reversal from the recent corrective decline.
Technical Highlights
Price retraced to th

The best trades require research, then commitment.
Get started for free$0 forever, no credit card needed

Scott "Kidd" PoteetThe unlikely astronaut

Where the world does markets
Join 100 million traders and investors taking the future into their own hands.
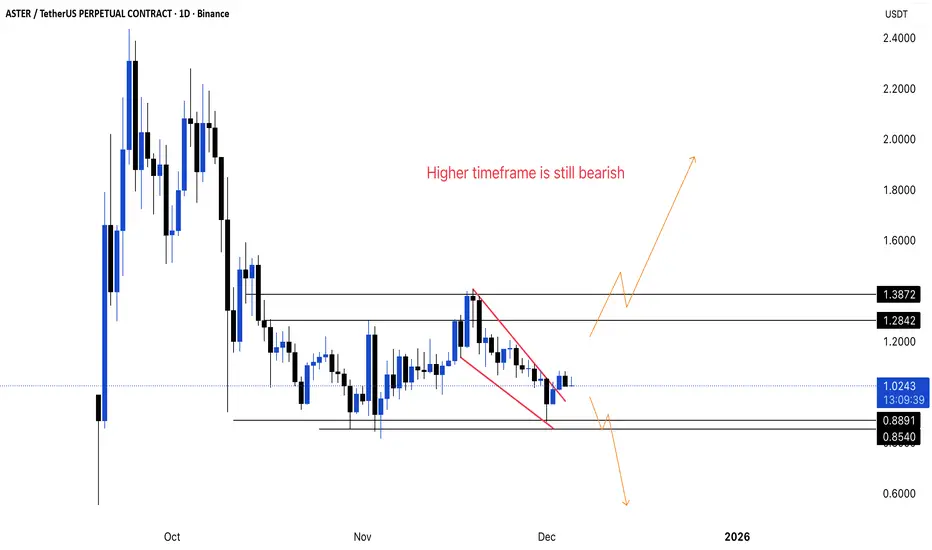
ASTER - what going to happen?📊 ASTER/USDT Update
🔎 Technical Observation:
- The pair is trading within a descending channel/falling wedge pattern, indicating a period of consolidation after a sharp decline.
- Price action shows compression near the apex of this wedge, suggesting imminent volatility.
- The chart explicitly no
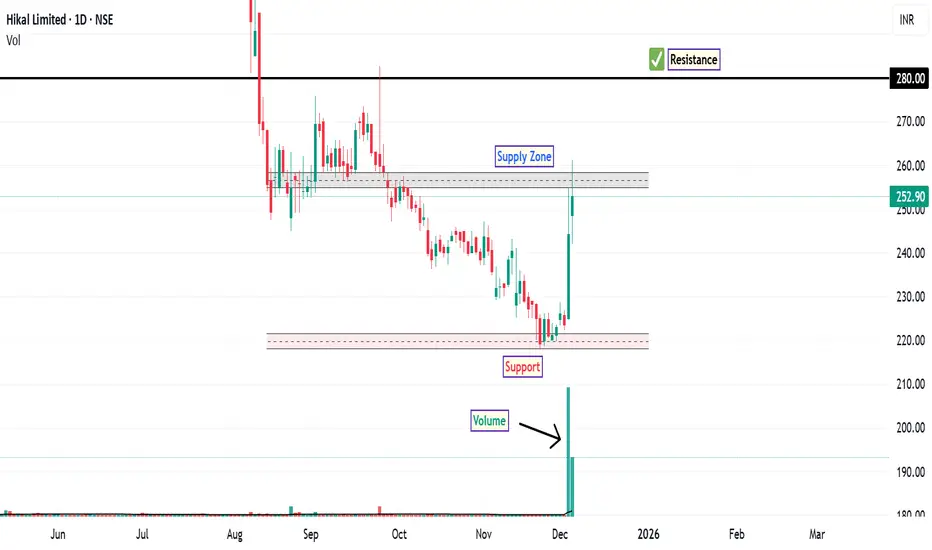
Hikal: Trend Shift and Key LevelsThe stock of Hikal Ltd . experienced a significant breakdown below its major support level of ₹331 in July, marking a continuation of its bearish phase. After testing the discount zone which is now major support zone, the stock rebounded sharply with high trading volume, signaling renewed buying in
Jubilant Foodworks Near Long Term SupportJubilant Foodworks swiftly moving in a Parallel Channel since it got listed in the secondary market. Stock respected the channel's boundaries on several occasions. Now it is very near to its support on both log & linear (caption image) charts. Support zone range from 570 to 525 for double to four ti

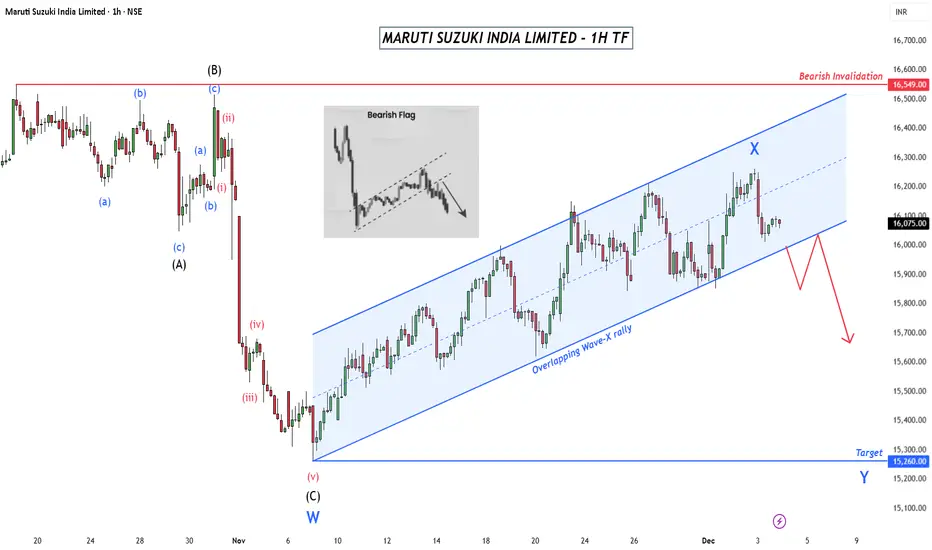
Maruti: Rising Flag, Dropping ProbabilityStructure
The decline into Wave W is complete as a Regular Flat.
The rebound is a corrective Wave X, fully overlapping and contained within a rising channel.
Bias remains bearish as long as price trades inside this channel.
Wave Y Setup
Trigger: Breakdown below the channel near 16000.
Longs be cautious in M&MTF: Daily
CMP: 3645
The upmove from 2020 lows is at the maturing zone (as we are now trading in the 5th wave)
The upmove from April 2025 lows is also at the final leg and this impulse could end soon.
In simple price action terms, price has broken down from the sideways range (3660-3780) and the b

Anupam Rasayan India LtdStock is about to break all time high with good volume and also if you can see the retracement of price is already done means we can see the break out but we should not miss the part stop loss as it trading at very high price so keep the low is as stop loss

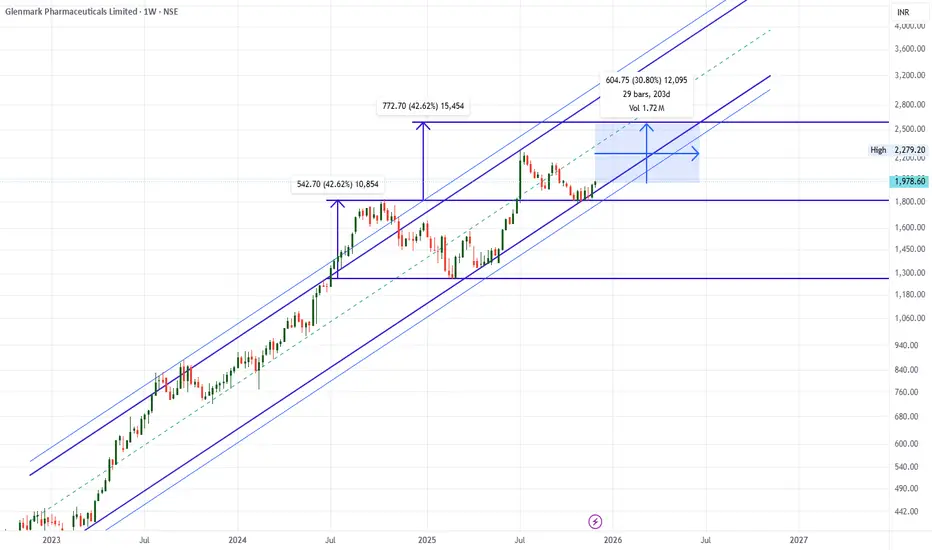
Glenmark 30% upside possible in next 6 -8 MonthsGlenmark Weekly chart suggest 30% Upside in coming 6-8 Month.
Glenmark has created bottom near 1250-1300 & have been making HH HL.
LTP - 1967
SL - 1775
Targets ... 2550+
Timeframe - 6-8 Months.
Happy Invetsing.
Breakout Setup Emerging in Strides Pharma Science Ltd#STRIDES
📈Pattern & Setup:
Strides Pharma is exhibiting a structural shakeout followed by a dry-volume pullback — a powerful combination often seen before a fresh breakout.
The stock recently shook out weak hands near 830–850, reclaimed the trendline, and is now trading above it with a strong bul

Reliance Industries Ltd. - Stock AnalysisDate : 30-Nov-2025
LTP : Rs. 1,567.50
Technical View:
• NSE:RELIANCE is in primary uptrend since Apr 2025 and currently trading through it's secondary uptrend since 16-Oct-2025.
• After touching the high of 1,551 on 9-Jul-2025, it has retraced 14% to 1,340.60 level.
• NSE:RELIANCE has formed

See all editors' picks ideas
Match Finder [theUltimator5]Match Finder is the dating app of indicators. It takes your current ticker and finds the most compatible match over a recent time period. The match may not be Mr. right, but it is Mr. right now. It doesn't forecast future connection, but it tells you current compatibility for today.
Jokes aside,

Trend Line Methods (TLM)Trend Line Methods (TLM)
Overview
Trend Line Methods (TLM) is a visual study designed to help traders explore trend structure using two complementary, auto-drawn trend channels. The script focuses on how price interacts with rising or falling boundaries over time. It does not generate trade sign

Breakouts & Pullbacks [Trendoscope®]🎲 Breakouts & Pullbacks - All-Time High Breakout Analyzer
Probability-Based Post-Breakout Behavior Statistics | Real-Time Pullback & Runup Tracker
A professional-grade Pine Script v6 indicator designed specifically for analyzing the historical and real-time behavior of price after strong All-Ti

Count█ OVERVIEW
A library of functions for counting the number of times (frequency) that elements occur in an array or matrix.
█ USAGE
Import the Count library.
import joebaus/count/1 as c
Create an array or matrix that is a `float`, `int`, `string`, or `bool` type to count elements from, t

Holographic Market Microstructure | AlphaNattHolographic Market Microstructure | AlphaNatt
A multidimensional, holographically-rendered framework designed to expose the invisible forces shaping every candle — liquidity voids, smart money footprints, order flow imbalances, and structural evolution — in real time.
---
📘 Overview
The Hol

PriceFormatLibrary for automatically converting price values to formatted strings
matching the same format that TradingView uses to display open/high/low/close prices on the chart.
█ OVERVIEW
This library is intended for Pine Coders who are authors of scripts that display numbers onto a user's charts. T

LogNormalLibrary "LogNormal"
A collection of functions used to model skewed distributions as log-normal.
Prices are commonly modeled using log-normal distributions (ie. Black-Scholes) because they exhibit multiplicative changes with long tails; skewed exponential growth and high variance. This approach i

Range Oscillator (Zeiierman)█ Overview
Range Oscillator (Zeiierman) is a dynamic market oscillator designed to visualize how far the price is trading relative to its equilibrium range. Instead of relying on traditional overbought/oversold thresholds, it uses adaptive range detection and heatmap coloring to reveal where pri

Volume Surprise [LuxAlgo]The Volume Surprise tool displays the trading volume alongside the expected volume at that time, allowing users to spot unexpected trading activity on the chart easily.
The tool includes an extrapolation of the estimated volume for future periods, allowing forecasting future trading activity.
🔶 U

Smooth Theil-SenI wanted to build a Theil-Sen estimator that could run on more than one bar and produce smoother output than the standard implementation. Theil-Sen regression is a non-parametric method that calculates the median slope between all pairs of points in your dataset, which makes it extremely robust to o

See all indicators and strategies
Community trends
Adani Enterprises – Bullish Reversal from Channel SupportAnalysis & Viewpoint:
Adani Enterprises has been moving inside a well-defined ascending channel for more than one year. The price recently corrected toward the lower demand zone and has taken support exactly at the rising trendline, indicating that buyers are still defending the structure.
The lat

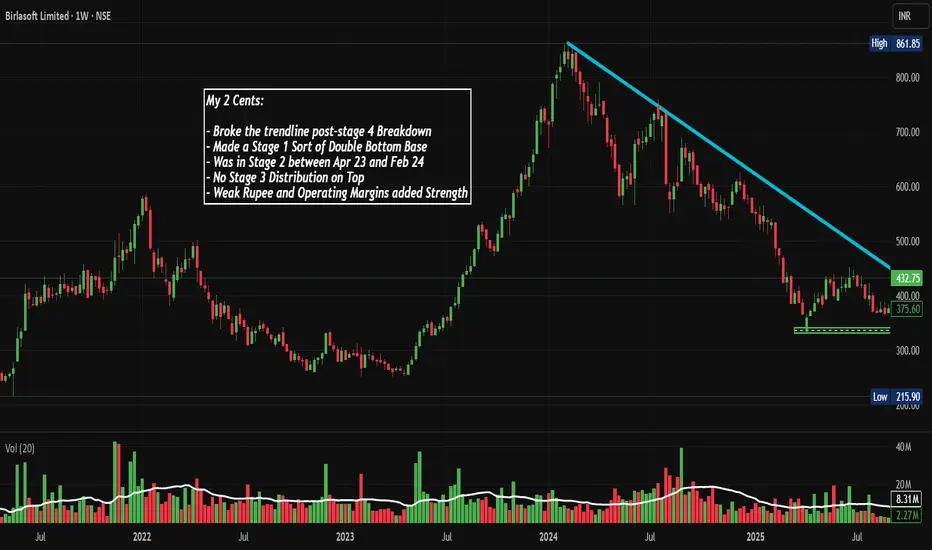
BSOFT: Trendline BO, Double Bottom Formation, Chart of the WeekIs NSE:BSOFT Technical Breakout Real? What the Charts Tell You About This Mid-Cap IT Giant's Next Move after Weaking Rupee and Strong Margins Recovery in Q2FY26. Let's Analyze in Chart of the Week.
As per the Latest SEBI Mandate, this isn't a Trading/Investment RECOMMENDATION nor for Educational
HINDCOPPER – Support at 38.2% Retracement With Reversal SignalHIHINDCOPPER has respected the 38.2% Fibonacci retracement level, indicating that buyers are active at this key support zone. The formation of a reversal candle (DOJI) at this level strengthens the probability of a reversal from the recent corrective decline.
Technical Highlights
Price retraced to th
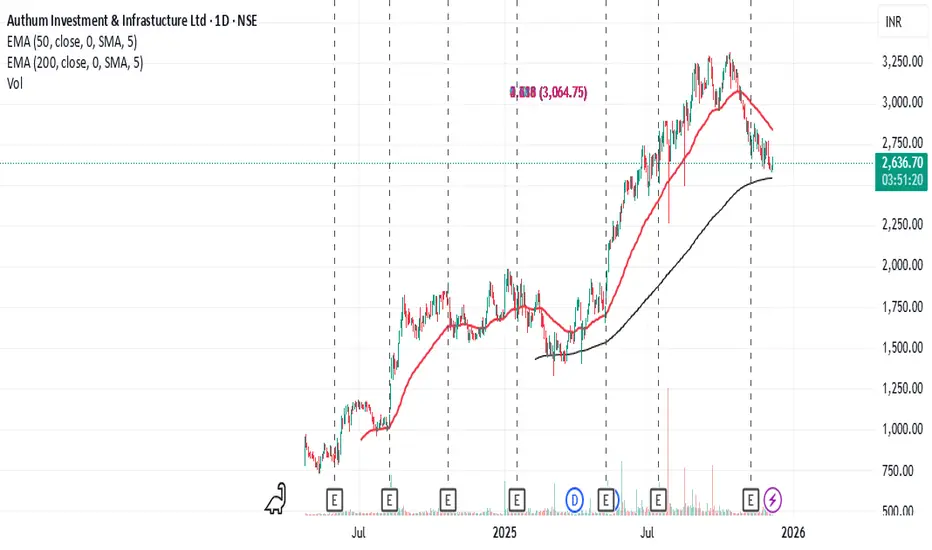
Authum Investment & Infrastructure- Next Swing Low PointAuthum Investment & Infrastructure is close to 200 days EMA and consolidating for next run. A dip below 2500 would be good price to watch and enter trade again.
DIXON 5x Possibility in next 5 Years. Targets 69000+DIXON 5x Possibility in next 5 Years. Targets 69000+
Looking at the Monthly chart of DIXON we can see it has been always taking support on lower end of the channel giving multifold return in next few years post correction.
Currently it has been trading in narrow range sine 16 Months ... considerin

TATA ELXSI DOUBLE BOTTOM OR A WEAK STRUCTURE 05-12-25 (6)TATA ELXSI appears to be an interesting chart with following
1. A Bullish harmonic pattern completed and new harmonic under construction
2. Double bottom like structure on weekly chart
3. RSI taking support on 40 levels on both weekly and monthly charts
4. Morning star like pattern on daily chart
5

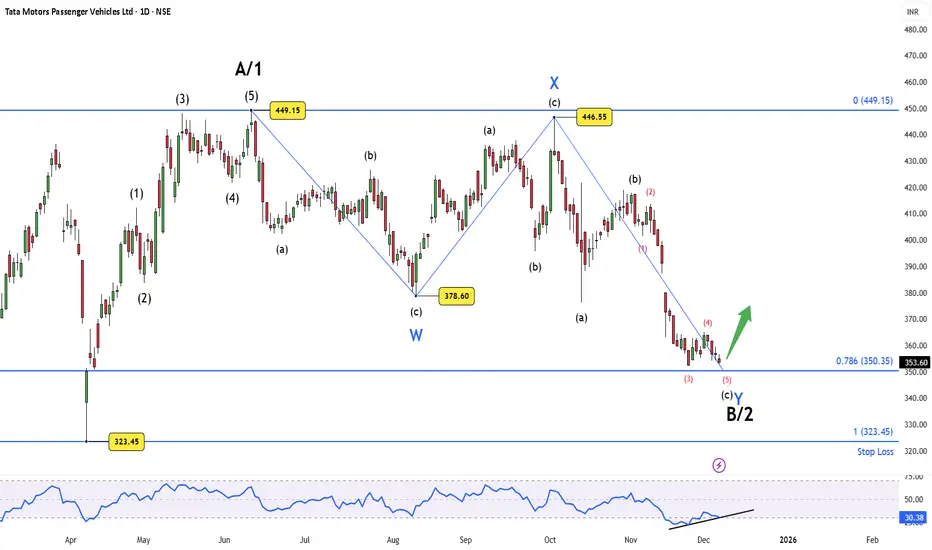
Tata Motors PV – Wave B/2 Near Completion, Bounce Zone ActivatedThe ongoing decline appears to be unfolding as a complex corrective structure, with Wave C of the larger Wave B/2 now approaching its typical termination area. Price has reached the 0.786 Fibonacci support at ₹350.35 — a level where deeper corrective phases frequently exhaust themselves.
Structural
Reliance Industries Price Action Projection for Dec 2025This projection is made on the basis of Andrews Pitchfork Tool
It helps projecting the price targets.
I have taken 1300 as the starting point as this was the breakout in April. Price went on to make a higher high of 1542 in July. It and made a higher low 1375 by mid-october.
The projections are mad

How to Add and Select Weekly time frame stocks on Trading view I make educational content videos for swing / positional trading

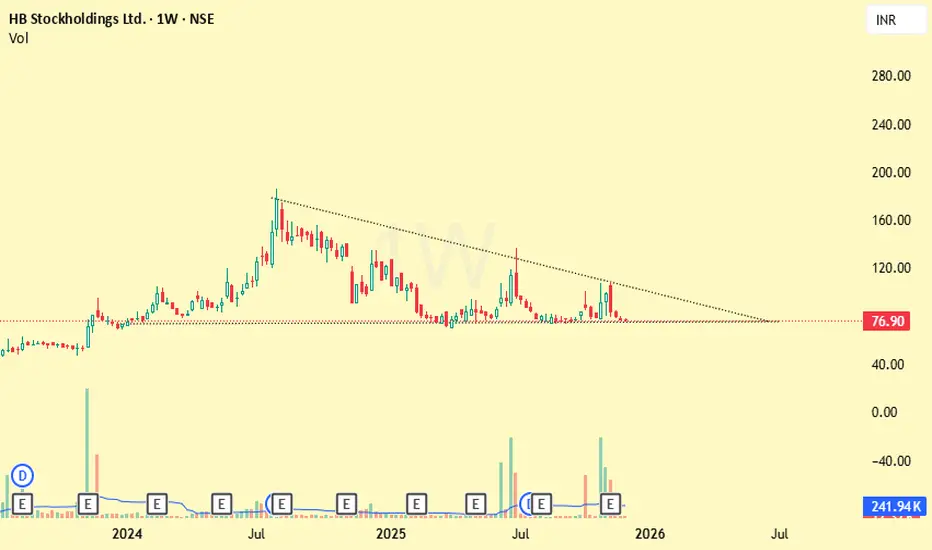
HBSLHBSL
Isuzu Izmo Daily Daily weekly monthly quarterly HH HL Green Green modified all in one
1) MOnthlu HH
2) Consolidation
2) Lets see
See all stocks ideas
No scheduled reports
Tomorrow
E
EQSPEBSPEB Adhesives Ltd.
Exchange
NSE
Offer price
0.58 - 0.63
USD
Tomorrow
J
JOCMInvicta Diagnostic limited
Exchange
NSE
Offer price
0.89 - 0.94
USD
Tomorrow
C
CHWYClear Secured Services Ltd.
Exchange
NSE
Offer price
1.40 - 1.48
USD
Dec 9
EMASHelloji Holidays Limited
Exchange
BSE
Offer price
1.23 - 1.32
USD
Dec 9
T
TPVNeochem Bio Solutions Ltd.
Exchange
NSE
Offer price
1.04 - 1.09
USD
Dec 10
N
NYMTShri Kanha Stainless Limited
Exchange
NSE
Offer price
1.000
USD
Dec 10
3
320000Meesho Limited
Exchange
BSE
Offer price
1.17 - 1.23
USD
Dec 11
FGHWestern Overseas Study Abroad Ltd.
Exchange
BSE
Offer price
0.628
USD
Dec 12
A
AUUDEncompass Design India Limited
Exchange
NSE
Offer price
1.13 - 1.20
USD
Dec 12
U
UZFFlywings Simulator Training Centre Limited
Exchange
NSE
Offer price
2.02 - 2.14
USD
See more events
Community trends
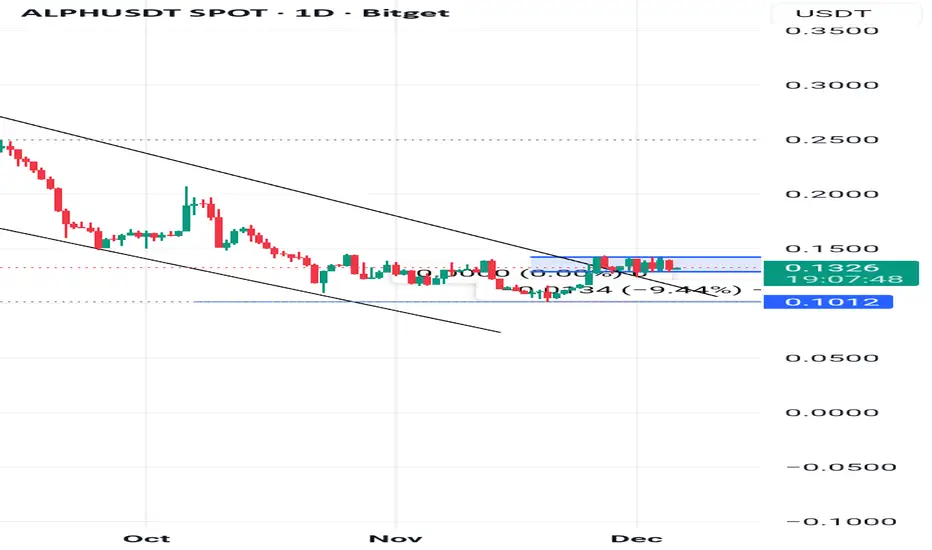
ALPHUSDT Strong Accumulation After Falling Wedge Breakout ALPH is showing a strong structural change on the 1D chart.
Price has clearly broken out of the falling wedge and is now consolidating inside a clean accumulation range (0.125 – 0.14).
Key Bullish Points:
• Major downtrend wedge breakout confirmed
• Multiple retests inside the demand zone
• Wick r
BTC Breakdown Confirmed – Here’s Where BTC Could Surge NextBTC Breakdown Confirmed – Here’s Where BTC Could Surge Next
1️⃣ Long-Term Trendline Breakdown Confirmed
🔹 BTC has decisively broken the multi-year ascending trendline supporting price since Nov 2022.
🔹 The Breakdown + Retest at ~$104k-$108k confirms bearish structure ✅.
🔹 Retest failed in Oct 2025,

What BTC has to offer now - Swing Trade opportunityBINANCE:BTCUSDT.P
DELTAIN:BTCUSD.P
BYBIT:BTCUSDT.P
BTC played our level perfectly giving about 8.5% return in three days
Now what can be done next - LETS DISCUSS
After touching our level 94000 which was a 0.5 retracement zone BTC is down 1500 points
I am expecting bearish momentum in th

ASTER - what going to happen?📊 ASTER/USDT Update
🔎 Technical Observation:
- The pair is trading within a descending channel/falling wedge pattern, indicating a period of consolidation after a sharp decline.
- Price action shows compression near the apex of this wedge, suggesting imminent volatility.
- The chart explicitly no
BTC IS AT SUPPORT AND GETTING READY TO HEADS UPBTCUSD As per my analysis which is based on trend three white lines are the trend lines which worked as support and resistance previously.On the basis of that i can say it will take support again at bottom trend line.
If this bottom trend line wi get voillated then may come to previous support m

BTC/USDT – Bearish Rejection at Supply ZoneAnalysis (15m Timeframe):
Bitcoin is currently trading near the 0.5–0.618 Fibonacci retracement zone, where price has shown repeated rejection. The structure remains bearish, with lower highs forming under the descending trendline.
Price is also approaching a strong supply zone (₹90,100 – ₹90,300),

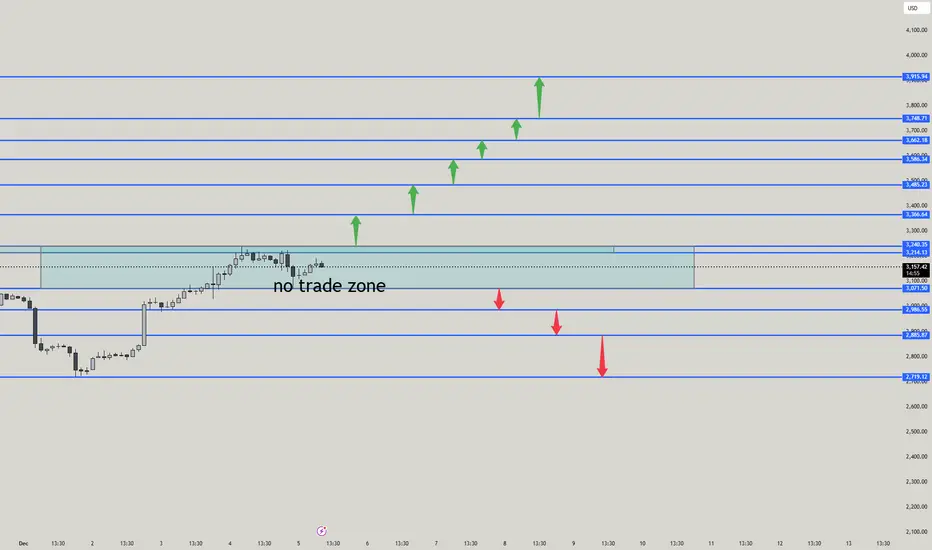
ETHUSD – Pure Price Action Analysis ETHUSD – Pure Price Action Analysis (Buy | Sell | TP | SL | No-Trade Zone)
🚫 NO-TRADE ZONE (Ranging / Indecision Area)
The shaded box between $3,140 – $3,245 is your no-trade zone.
Reason:
Market is consolidating
No strong direction
Liquidity building
Smart money accumulation area
👉 Inside th
BTCUSDBitcoin is in a downtrend.
Currently falling off the supply zone, @106 lvl.
Will be monitoring closely the demand, other then that first low is logical target.

Bitcoin Bybit chart analysis December 4Hello
It's a Bitcoin Guide.
If you "follow"
You can receive real-time movement paths and comment notifications on major sections.
If my analysis was helpful,
Please click the booster button at the bottom.
This is a 30-minute Bitcoin chart.
It's not visible on the screen due to limited space,
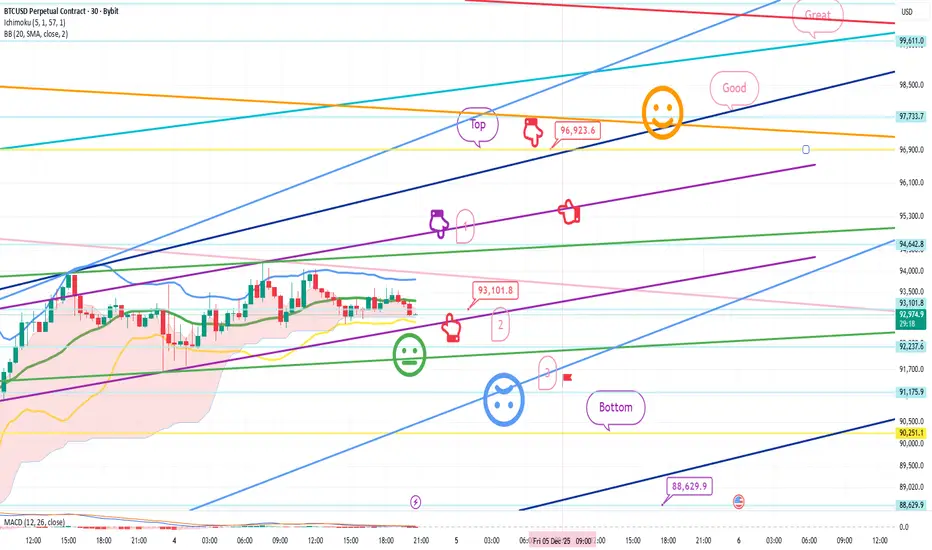
BTC 3H Market Structure Breakdown – Bearish Target at 85,300”BTCUSD 3H Chart Analysis
1. Structure & Trend
Price is moving inside a rising channel (blue trendlines).
But the upper zone contains a Bearish Order Block (OB) between 94,614 – 96,882, causing repeated rejections → bearish reaction zone.
✅ 2. Current Market Behavior
Price has formed a red con

See all crypto ideas
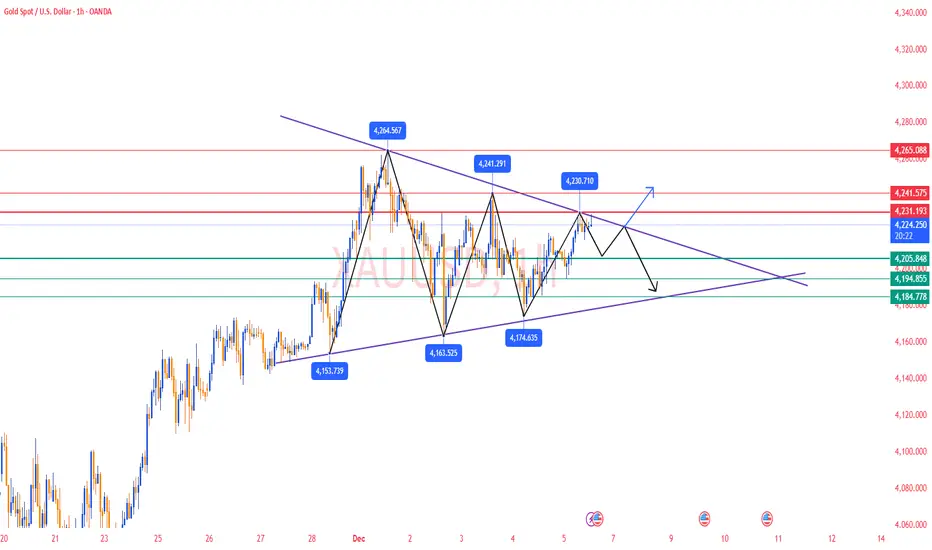
Gold Analysis & Trading Strategy | December 5✅ 4H Chart Trend Analysis
1️⃣ Lower rebound highs, weakening bullish momentum
Highs are stepping down from 4264.62 → 4241.55 → 4230, showing repeated rejection and forming an early descending high structure at the top.
2️⃣ Bollinger Middle Band as strong resistance
Current rebound is capped around
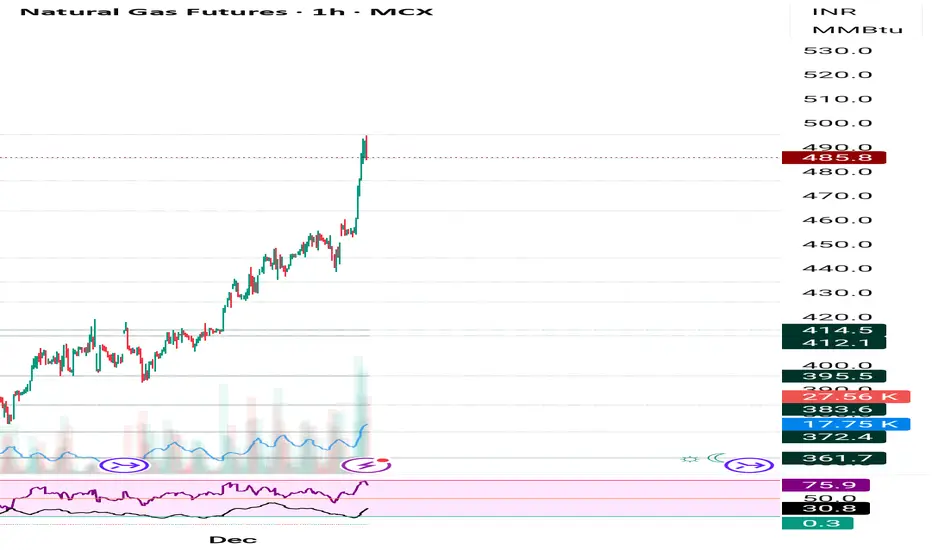
Natural gas AI tool data Analysis provided in description use itParameter Data
Asset Name Natural Gas MCX Futures (Dec 2025): ₹485.00/mmBtu (LTP: Dec 5, 2025 Close)
Price Movement Strong upside targeting and . Downside possible if is breached, targeting and .
Current Trade 🟩 BUY Active / T1: ₹495.00, T2: ₹520.00, T3: ₹545.00 / SL: ₹464.50
Risk Reward (
Time to Trim longs in NaturalgasRange breakout target seem to have been achieved… details are explained in the chart..
Time and o book decent gains and not be greedy.
On weekly, previous supports Turing resistance polarity zone is at 5.3280
Let’s see how this plays out
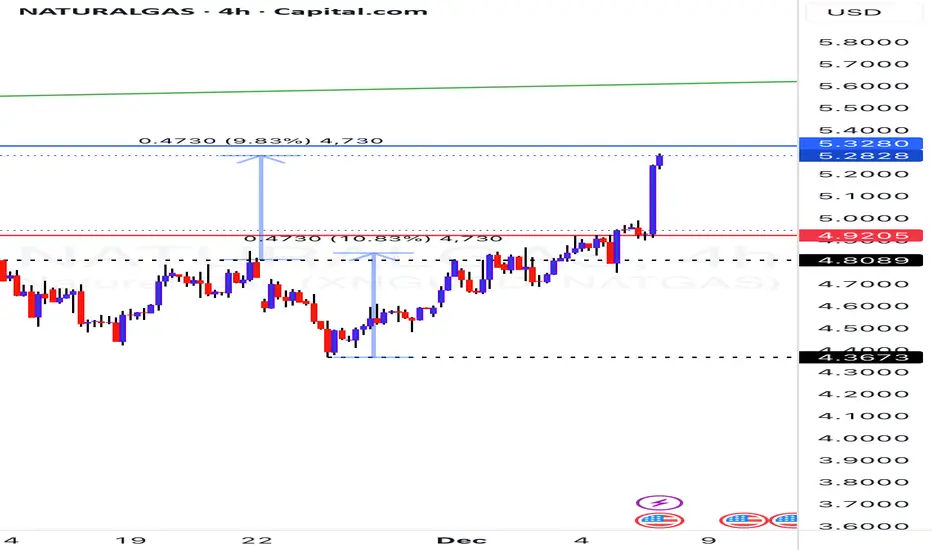
XNGUSD (Natural Gas) – Elliott Wave View | Wave 3 in ProgressStrong Bullish Momentum – Price Near Key Breakout Zone
Natural Gas has continued its upward rally, supported by strong momentum and Elliott Wave structure. Price action suggests that we are currently in Wave 3, which typically produces the strongest impulsive move in the cycle.
The recent breakout

SMC TRADING PLAN – XAUUSD (1H)1. Market Context
Observing the chart shows:
The price is moving in a short-term downtrend, indicated by the downtrend line that has been tested multiple times but not decisively broken.
Twice the price touched the trendline, it created a strong reaction → confirming this as a dynamic resistance

XAU/USD: Gold Consolidates, Awaiting Pullback for Breakout📊 Market Structure (H1)
Gold is moving within a converging triangle pattern – with the bottom being pushed higher by buying pressure, while the top is continuously blocked by the H1 descending trendline.
After the previous strong decline, the market has consecutively created bullish ChoCH , indi

XAUUSD – Ahead of NFP: Buy with Wolfe Wave, Watch for Sell ...XAUUSD – Ahead of NFP: Buy with Wolfe Wave, Watch for Sell Setup at the Extension Zone
Gold continues its upward momentum as the USD weakens sharply, breaking the descending trendline and forming a Wolfe Wave pattern on the H1 chart.
Price is currently rotating around the POC – VAH cluster of the p

XAUUSD – Brian | Volume Profile & TrendlineXAUUSD – Brian | Volume Profile & Trendline: prioritize Sell, wait for a “good deal” in the liquidity zone
1. Market snapshot
On H1, gold is touching the trendline just as yesterday's scenario – this is an area where strong price reactions may occur.
The current structure shows that the price is g

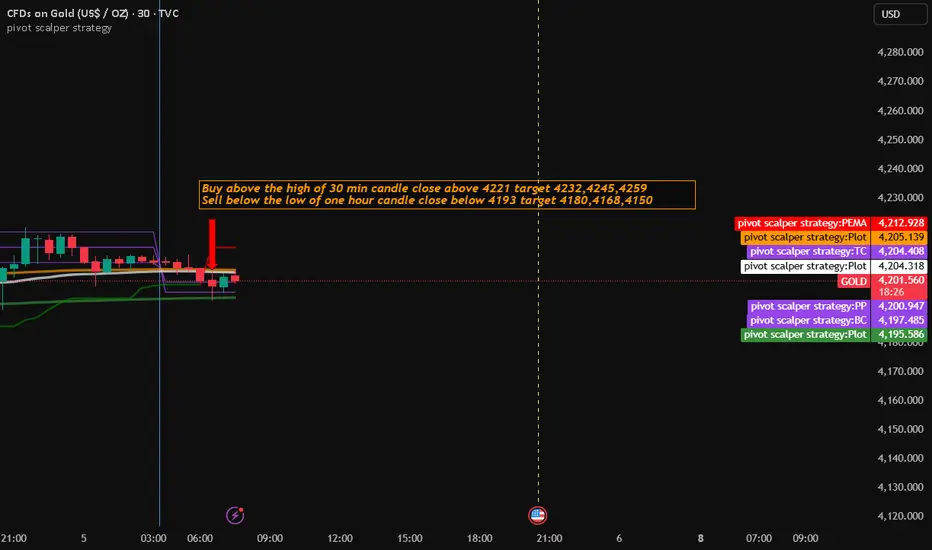
Gold Trading Strategy for 05th Deceber 2025📈 GOLD INTRADAY TRADE SETUP
✅ BUY SETUP (Long Trade)
🔔 Entry Condition:
Enter Buy above the high of the 30-minute candle
Candle must close above $4221
After a strong bullish close, look for continuation momentum.
🎯 Targets:
TP1: $4232
TP2: $4245
TP3: $4259
🛡 Stop-Loss Suggestion:
Below the breakout
Gold 1H – Will 4242 Displace or 4170 Unlock the Next Leg?🟡 XAUUSD – Intraday Smart Money Plan | by Ryan_TitanTrader (04/12)
📈 Market Context
Gold squeezes into engineered liquidity as Donald Trump signals policy authorization for ultra-compact car production in the U.S., adding risk-on volatility to USD narratives. Markets may front-run sentiment shifts i

See all futures ideas
CAD/JPY bullish in 4hr time frameCAD/JPY currently completed the Running flat, an strong impulse for an Target = 112.380

USDJPYIt looks like price completed its objective just before Friday’s news release, after which USD dropped sharply. From a technical perspective, structure has flipped from bullish to bearish. A clean correction to the upside into the 148.0 supply zone followed by a drop would make perfect sense. I’ll b

Dec W1 Short SetupReason: because demand is halved, supply will be double so, we are looking for a good nice short setup OANDA:USDJPY

NZDJPYNZDJPY SELL
Chanal pattern formed it has reached the resistance level so it may chance to move down.

USDCAD - Breakout Will Flip the Trend BullishUSDCAD has been sliding inside a well-defined descending channel, completing a full five-wave drop toward the support zone. The structure from the top looks corrective rather than impulsive. That means the downtrend is weakening as it reaches its final leg.
Your count shows Wave 3 finishing at the

AUD CHF SELL TRADE i am selling the trade , i have seen aud being strong in these day.....and i can a fare value gap at this point

GBPUSD – Weekly Elliott Wave Analysis | Primary Bull & Alt Bear🔍 Detailed Explanation of Analysis
GBPUSD has been moving inside a well-defined ascending channel after bottoming near 1.0356 in 2022. The structure since then appears to be forming an Elliott Wave impulsive cycle, suggesting the market may have completed a corrective phase and is preparing for a la

See all forex ideas
| - | - | - | - | - | - | - | - | ||
| - | - | - | - | - | - | - | - | ||
| - | - | - | - | - | - | - | - | ||
| - | - | - | - | - | - | - | - | ||
| - | - | - | - | - | - | - | - | ||
| - | - | - | - | - | - | - | - | ||
| - | - | - | - | - | - | - | - | ||
| - | - | - | - | - | - | - | - | ||
| - | - | - | - | - | - | - | - |
Trade directly on the supercharts through our supported, fully-verified and user-reviewed brokers.


