Market Cycles I have made efforts in Explaining How Markets work in cyclical basis
once The bull Run completes , Market ideally enters in Price & Time Corrections
which enter in one of two know phases
01) Deep Price Corrections
02) Bracketed Market Price corrections
This is education content if you have

The best trades require research, then commitment.
Get started for free$0 forever, no credit card needed

Scott "Kidd" PoteetThe unlikely astronaut

Where the world does markets
Join 100 million traders and investors taking the future into their own hands.
Major indices

JSWSTEEL TRENDLINE BREAKOUTJSWsteel breaking trendline resistance weekly basis
good volume last few weeks
bullish RSI above 60
trading at al time high
can reach to target 1250 soon
NO BUY/SELL RECOMENDATION

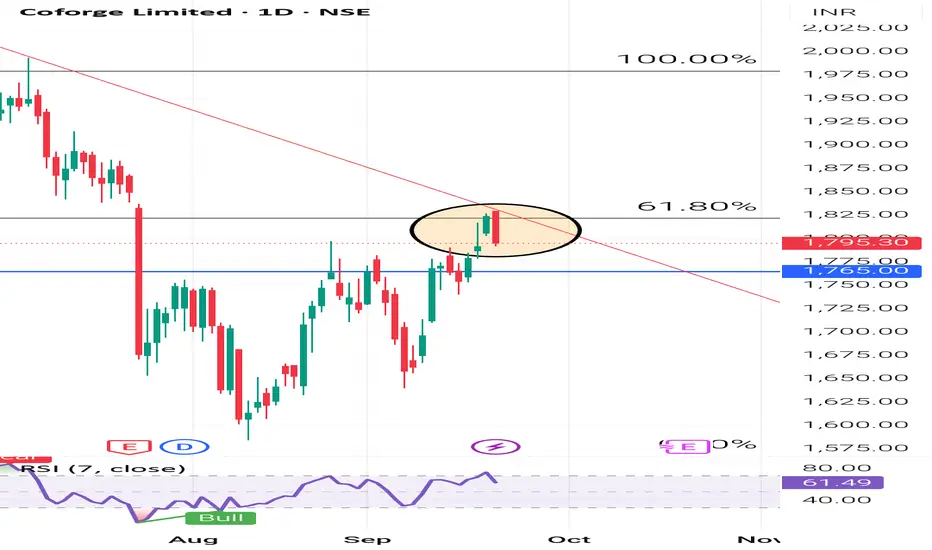
COFORGE LIMITED ( 1D ) 🔑 KEY LEVELS 🔑
✔ Fibonacci Retracement 61.80%
✔ Trend Line Act As Resistance.
✔ RSI Also Overbought Zone.
🎯 TRADING PLAN 🎯
✔ Near the key levels , Bearish Engulfing
Candlestick Pattern has formed.
✔ The Entry Point is Below @ 1792.10
✔ The Stopl
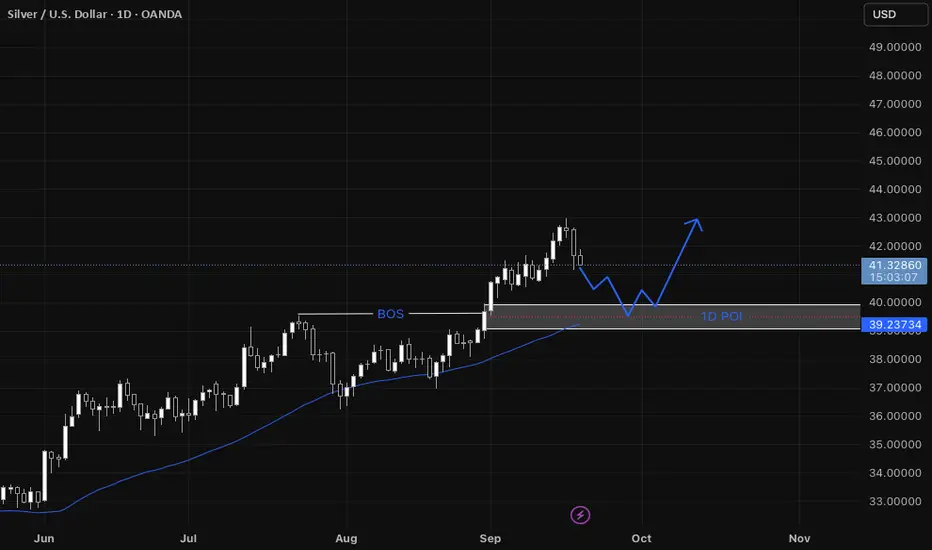
XAGUSD Step-by-step entry plan for XAGUSD
1. We have our Daily Point of Interest (POI)
- On the daily a zone that contains:
* a fair value gap (FVG),
* a break of structure (BOS) that previously acted as resistance and is now expected
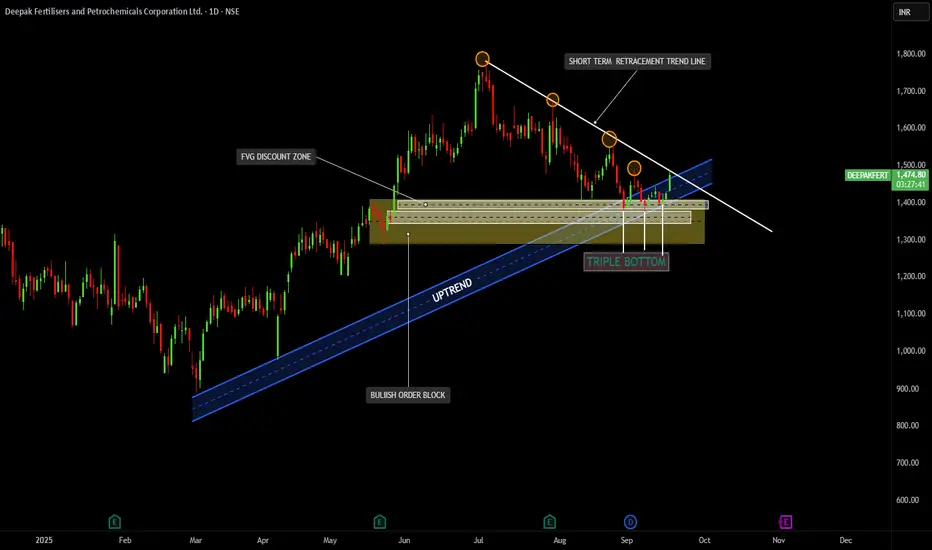
DEEPAK FERTILIZERTrend Structure:
The stock has been in a primary uptrend (marked with the blue ascending channel).
Recently, it went into a short-term retracement with a downward sloping trendline (white).
Support & Demand Zones:
Strong Bullish Order Block and FVG Discount Zone around the ₹1350 – ₹1400 level, w
HFCL BY KRS CHARTS17th September 2025 / 9:21 AM
Why HFCL?
1. First of all, its second time it's in my radar, previously we had more than 40% Return on this one and still long-term Target has been still loading 225 Rs.
2. 1M TF is making Higher High with current price level previously it breaks from flag

Bharat Electronics Ltd. - Stock AnalysisDate : 16-Sep-2025
LTP : Rs. 402.90
Technical View:
• NSE:BEL is in primary uptrend since Apr 2025 and was recently going through it's secondary downtrend within primary uptrend.
• From it's all time high of 436 on 1-Jul-2025, it has retraced 17% to 361.20 on 28-Aug-2025 which is also close to

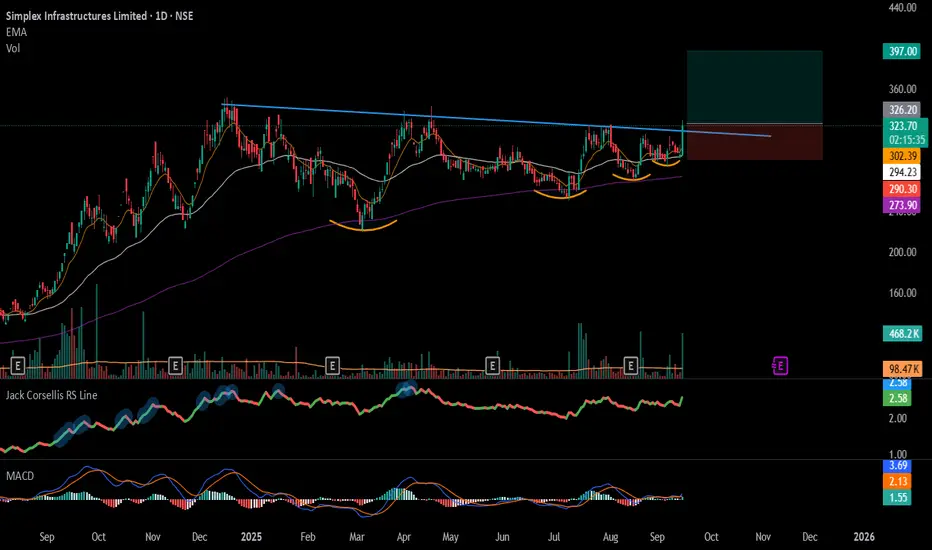
#SIMPLEXINF - TrendLine Breakout in Daily Time FrameScript: SIMPLEXINF
Key highlights: 💡⚡
📈 TrendLine Breakout in Daily Time Frame
📈 Volume spike during Breakout
📈 MACD Bounce
📈 Can go for a swing trade
BUY ONLY ABOVE 325 DCB
⏱️ C.M.P 📑💰- 322.25
🟢 Target 🎯🏆 – 22%
⚠️ Stoploss ☠️🚫 – 11%
⚠️ Important: Market conditions are Okish, Position size 50%
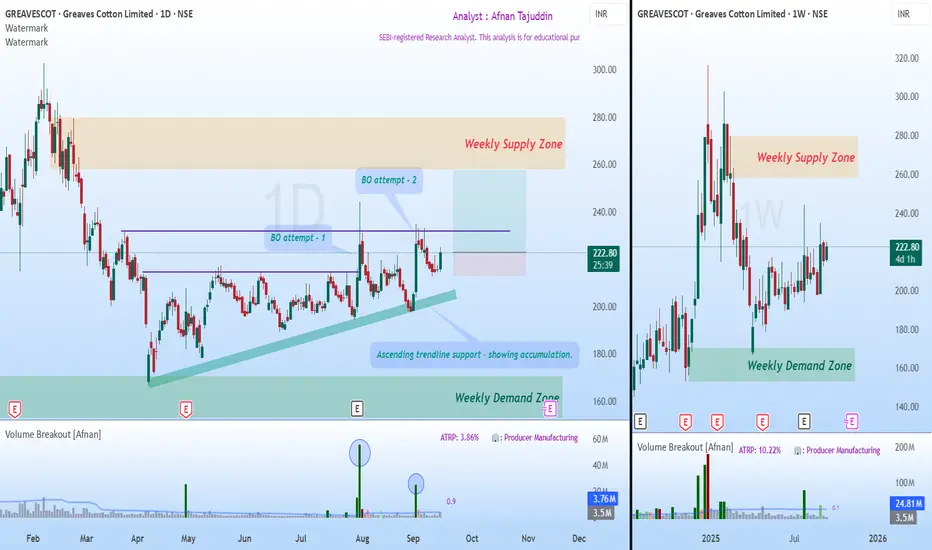
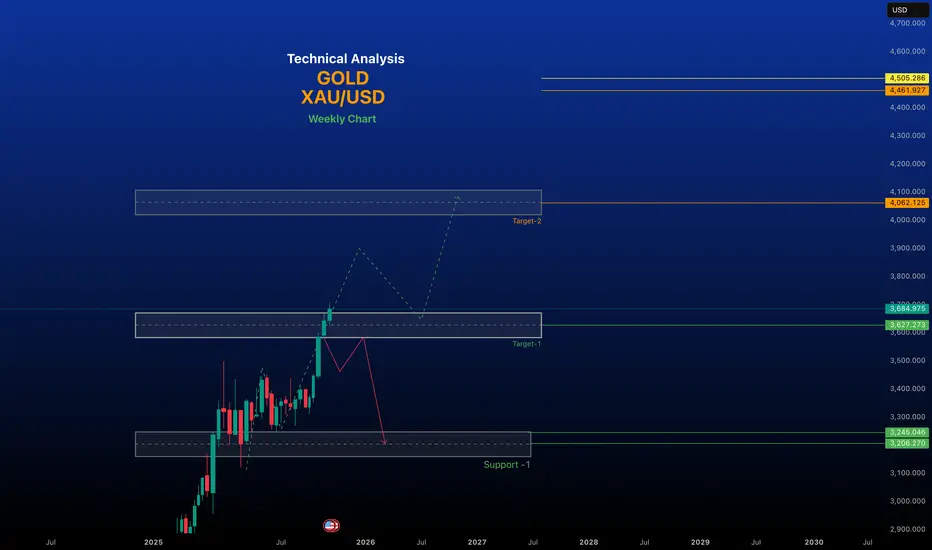
Accumulation and a Possible Breakout Towards Weekly Supply📈 Market Trend and Structure 📈
After forming an all-time high, price began its decline and developed a weekly supply zone . This supply zone now stands as the major target area for buyers.
Following the decline, price touched the weekly demand zone , which acted as a powerful reversal point
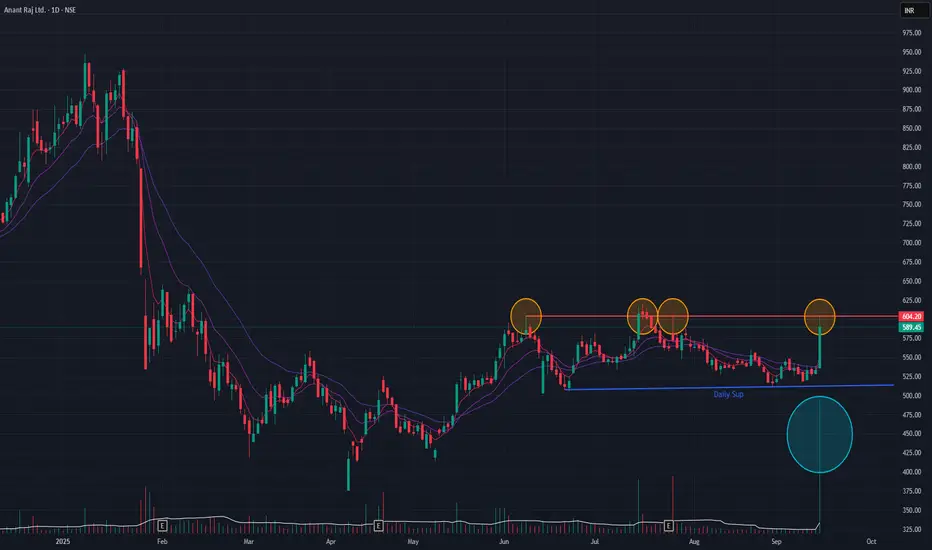
Anant Raj (Daily Timeframe) - Potential BreakOut candidate ??Following a downtrend that began in January 2025, Anant Raj has been in a sideways consolidation phase since May 2025. After several failed breakout attempts from this range, the stock demonstrated significant buying interest today, surging +10.53% on substantial volume.
While this move is positi
See all editors' picks ideas
Liquidity Void Detector (Zeiierman)█ Overview
Liquidity Void Detector (Zeiierman) is an oscillator highlighting inefficient price displacements under low participation. It measures the most recent price move (standardized return) and amplifies it only when volume is below its own trend.
Positive readings ⇒ strong up-move

DeltaFlow Volume Profile [BigBeluga]🔵 OVERVIEW
The DeltaFlow Volume Profile builds a compact volume profile next to price and enriches every bin with flow context : bullish vs. bearish participation (%), a per-bin Delta % , an optional Delta Heat Map , and a PoC band with the bin’s absolute volume. This lets you see not just

Volume by Time [LuxAlgo]The Volume by Time indicator collects volume data for every point in time over the day and displays the average volume of the specific dataset collected at each respective bar.
The indicator overlays the current volume and the historical average to allow for better comparisons.
🔶 USAGE
Thr

FlowScope [Hapharmonic]FlowScope: Uncover the Market's True Intent 🔬
Ever wished you could look inside the candles and see where the real action is happening? FlowScope is your microscope for the market's flow, designed to give you a powerful edge by revealing the volume distribution that price action alone can't sh

VWAP Price ChannelVWAP Price Channel cuts the crust off of a traditional price channel (Donchian Channel) by anchoring VWAPs at the highs and lows. By doing this, the flat levels, characteristic of traditional Donchian Channels, are no more!
Author's Note: This indicator is formed with no inherent use, and serves

Fibonacci Sequence Circles [BigBeluga]🔵 Overview
The Fibonacci Sequence Circles is a unique and visually intuitive indicator designed for the TradingView platform. It combines the principles of the Fibonacci sequence with geometric circles to help traders identify potential support and resistance levels, as well as price expansio

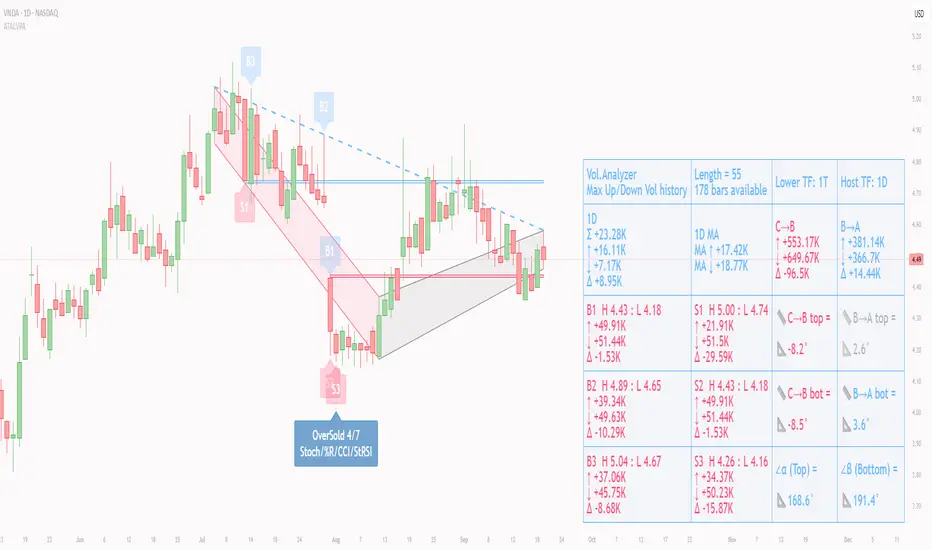
ATAI Volume Pressure Analyzer V 1.0 — Pure Up/DownATAI Volume Pressure Analyzer V 1.0 — Pure Up/Down
Overview
Volume is a foundational tool for understanding the supply–demand balance. Classic charts show only total volume and don’t tell us what portion came from buying (Up) versus selling (Down). The ATAI Volume Pressure Analyzer fills that g
Market Cap Landscape 3DHello, traders and creators! 👋
Market Cap Landscape 3D. This project is more than just a typical technical analysis tool; it's an exploration into what's possible when code meets artistry on the financial charts. It's a demonstration of how we can transcend flat, two-dimensional lines and step into

ZigzagLiteLibrary "ZigzagLite"
Lighter version of the Zigzag Library. Without indicators and sub-component divisions
method getPrices(pivots)
Gets the array of prices from array of Pivots
Namespace types: Pivot
Parameters:
pivots (Pivot ) : array array of Pivot objects
Returns: array array

ZigzagLibrary "Zigzag"
Zigzag related user defined types. Depends on DrawingTypes library for basic types
method tostring(this, sortKeys, sortOrder, includeKeys)
Converts ZigzagTypes/Pivot object to string representation
Namespace types: Pivot
Parameters:
this (Pivot) : ZigzagTypes/Pivot

See all indicators and strategies
Community trends
Market Cycles I have made efforts in Explaining How Markets work in cyclical basis
once The bull Run completes , Market ideally enters in Price & Time Corrections
which enter in one of two know phases
01) Deep Price Corrections
02) Bracketed Market Price corrections
This is education content if you have
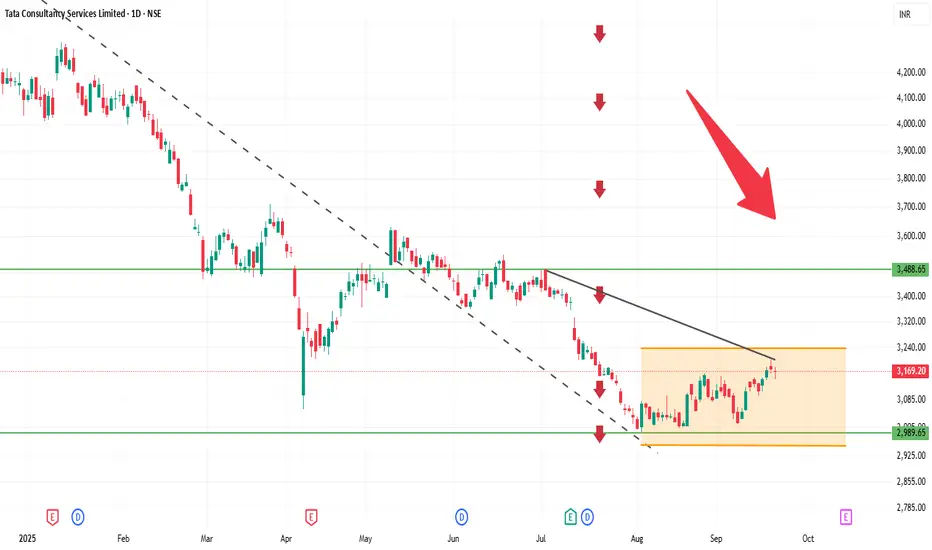
TCS 1D Time frameCurrent Price: Around 3,174
Current Trend: Stock is in a sideways to slightly bullish phase after consolidation.
Support Zone: Strong support at 3,140 – 3,150. Buyers may defend this level.
Resistance Zone: Key resistance at 3,200 – 3,220. A breakout above 3,220 can trigger fresh upside.
Indicato
xchanging solutions limited share price target price 176.5 stopxchanging solutions limited share price target price 176.5 stop loss 75 and entry 96.44
Entry Price: An entry price of ₹96.44 is above the current market price of ₹89.64.
Current Price: Xchanging Solutions Ltd closed at ₹89.64 on Friday, September 19, 2025.
Share Price Target: A target price o

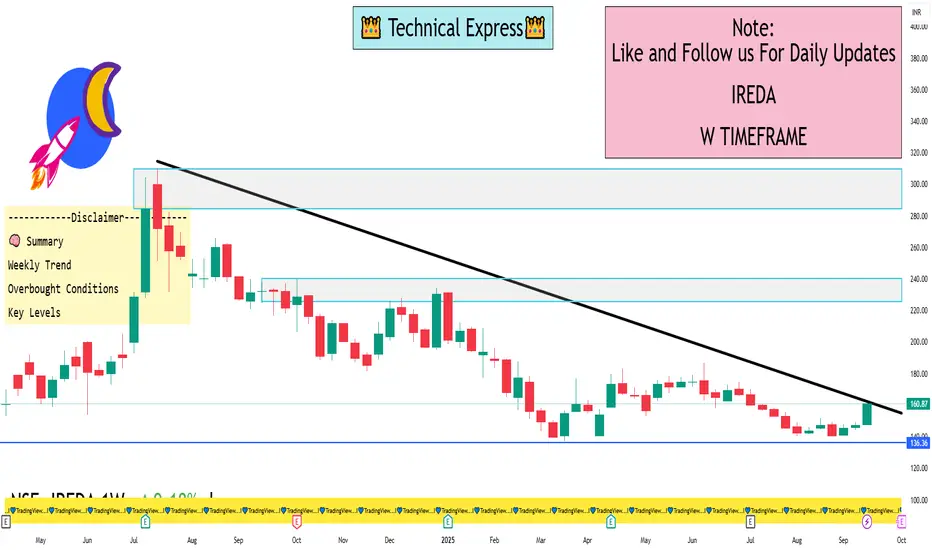
IREDA 1 Week View📈 Current Price & Trend
Latest Price: ₹160.87
Weekly Change: +9.14%
52-Week Range: ₹137.01 – ₹239.90
Market Cap: ₹45,192 Cr
🔍 Technical Indicators (Weekly)
RSI (14): 62.41 — Neutral to Bullish
MACD (12,26): 0.05 — Slight Bullish Crossover
ADX (14): 23.78 — Neutral Trend Strength
Stochastic
VodafoneIDEA (Opportunity during consolidation)Hi everyone
Welcome to intelligent investor, we provide market insights by synchronising and combining all the price action waves from different time frames and gives you single trend.
Degree Information

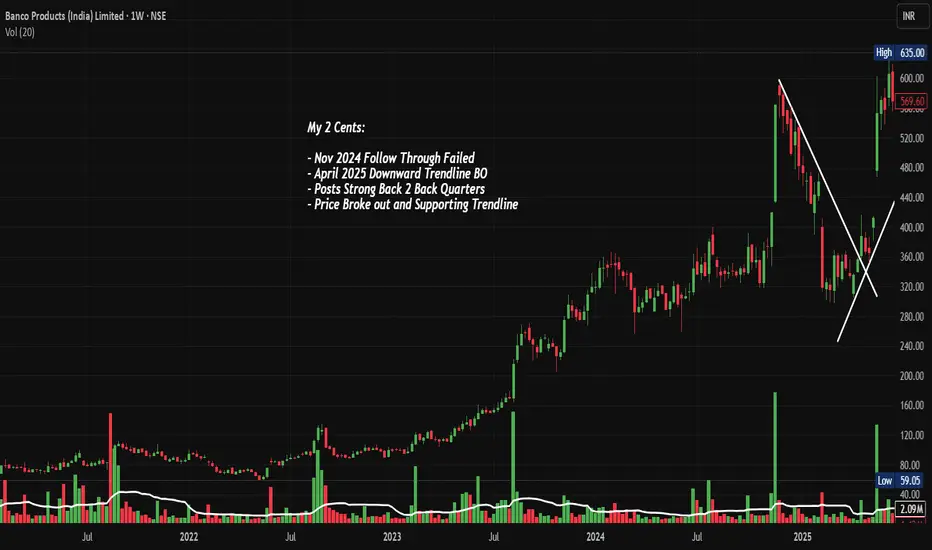
BANCOINDIA: BO after Consolidation, Chart of the WeekBanco Products Broke Out From a Consolidation, Continuing Its Massive Bull Run. Let's analyse in "Chart of the Week"
As per the Latest SEBI Mandate, this isn't a Trading/Investment RECOMMENDATION nor for Educational Purposes; it is just for Informational purposes only. The chart data used is 3 Mon
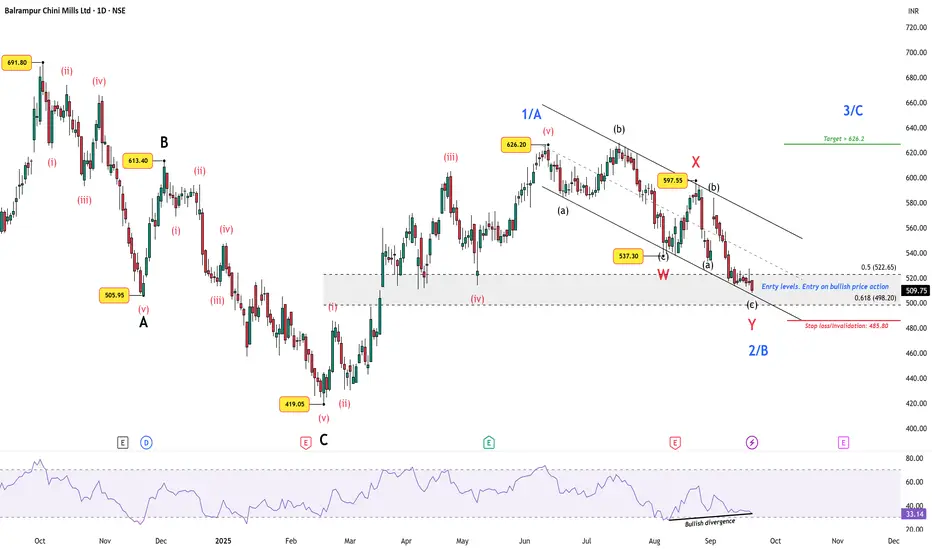
Balrampur Chini: Ethanol Policy Cheer Meets Wave 2/B SetupSugar stocks have been buzzing with news flow. First, the government allowed mills to produce ethanol from sugarcane juice, syrup, and all types of molasses without any restrictions in 2025/26. With strong monsoon rains and expanded cane acreage, supplies look abundant. The move supports India’s roa
JSWSTEEL TRENDLINE BREAKOUTJSWsteel breaking trendline resistance weekly basis
good volume last few weeks
bullish RSI above 60
trading at al time high
can reach to target 1250 soon
NO BUY/SELL RECOMENDATION
COFORGE LIMITED ( 1D ) 🔑 KEY LEVELS 🔑
✔ Fibonacci Retracement 61.80%
✔ Trend Line Act As Resistance.
✔ RSI Also Overbought Zone.
🎯 TRADING PLAN 🎯
✔ Near the key levels , Bearish Engulfing
Candlestick Pattern has formed.
✔ The Entry Point is Below @ 1792.10
✔ The Stopl
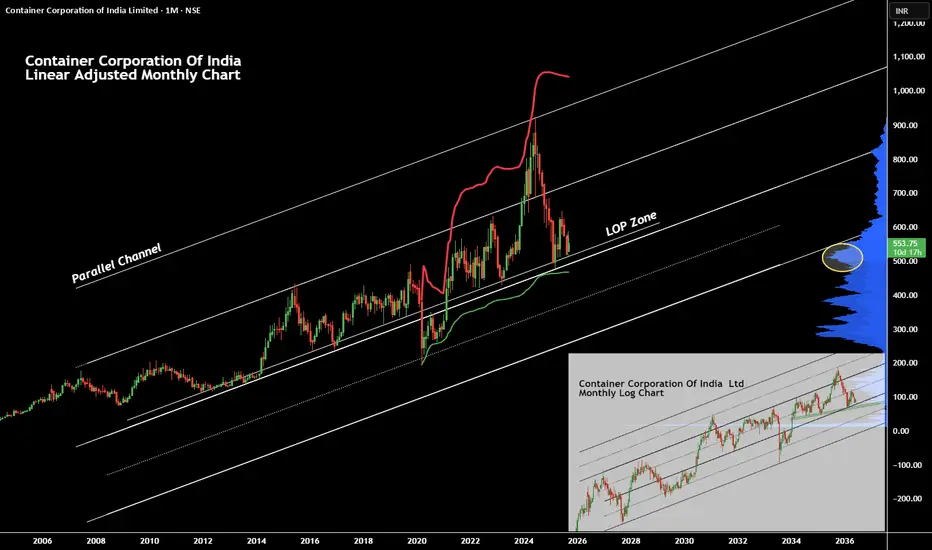
CONCOR Is Trading Around SupportContainer Corporation Of India Limited is trading around support of Multiple Channels on both Log and Linear charts (Log chart caption in the corner of the screen).
Volume profile shows (marked by yellow color circle) the high volume activity.
Anchored VWAP also suggest support.
One can consider the
See all stocks ideas
No scheduled reports
Community trends
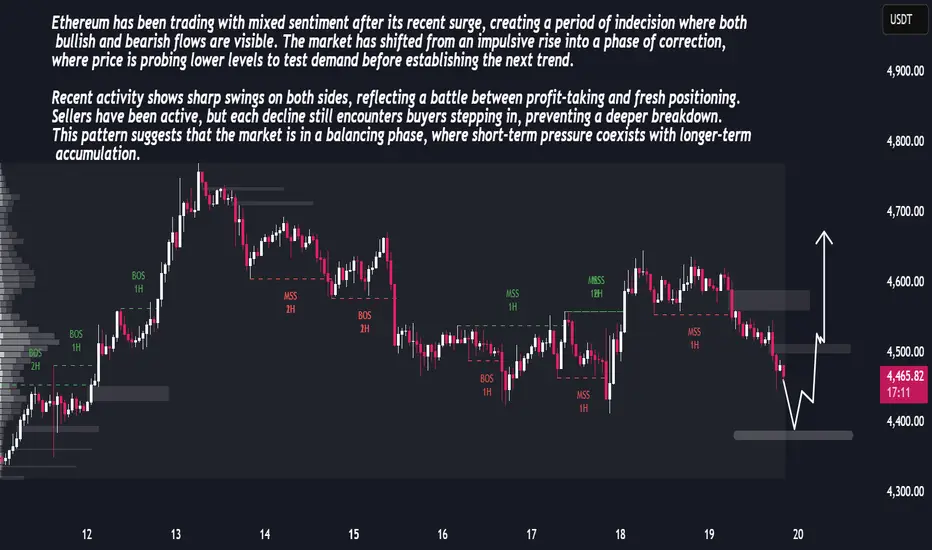
ETH Price Outlook – Consolidation Phase Before ExpansionETH Price Outlook – Consolidation Phase Before Expansion
Ethereum has been trading with mixed sentiment after its recent surge, creating a period of indecision where both bullish and bearish flows are visible. The market has shifted from an impulsive rise into a phase of correction, where price is
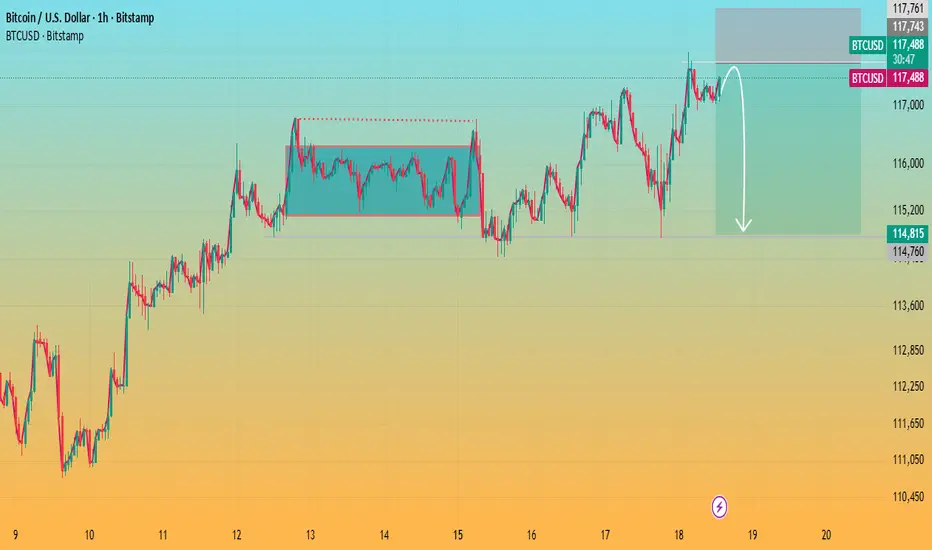
Bitcoin Testing Resistance with Potential Pullback AheadKey observations:
Range Breakout: Earlier, Bitcoin broke out of a consolidation zone (marked box), which triggered the recent upward move.
Resistance Zone: Price is hovering near the 5.15%–5.42% gain zone, where selling pressure has historically emerged.
Pullback Signal: The drawn arrow suggests
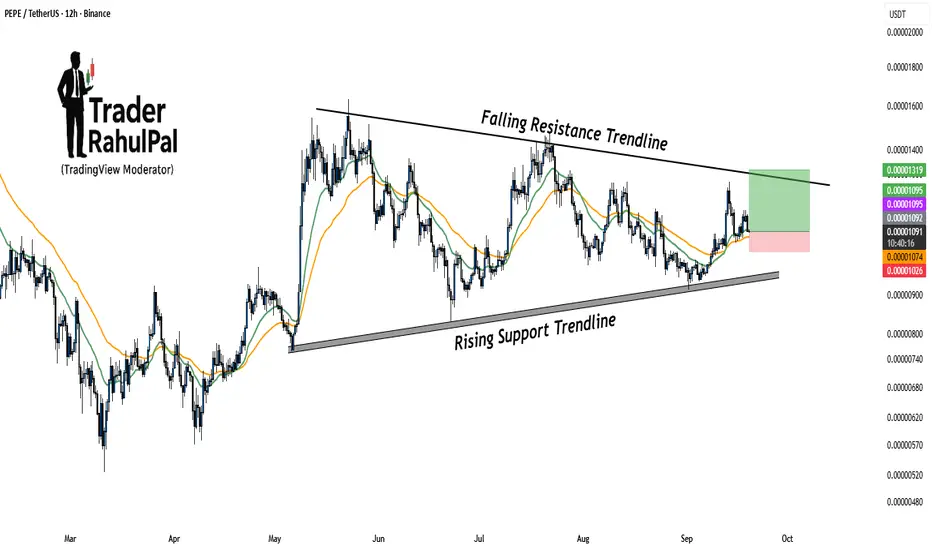
PEPE Getting Ready for a Big Move – Breakout Loading!PEPE is trading within a well-structured range, bounded by a rising support trendline and a falling resistance trendline . This setup indicates that the price is getting squeezed, and a decisive breakout move may be coming soon.
Currently, the price is holding above key moving averages, which ad
short term entry(Reliability on structure is low)short entry supply marked just wait how it reacts. at least 3% profit it works fine
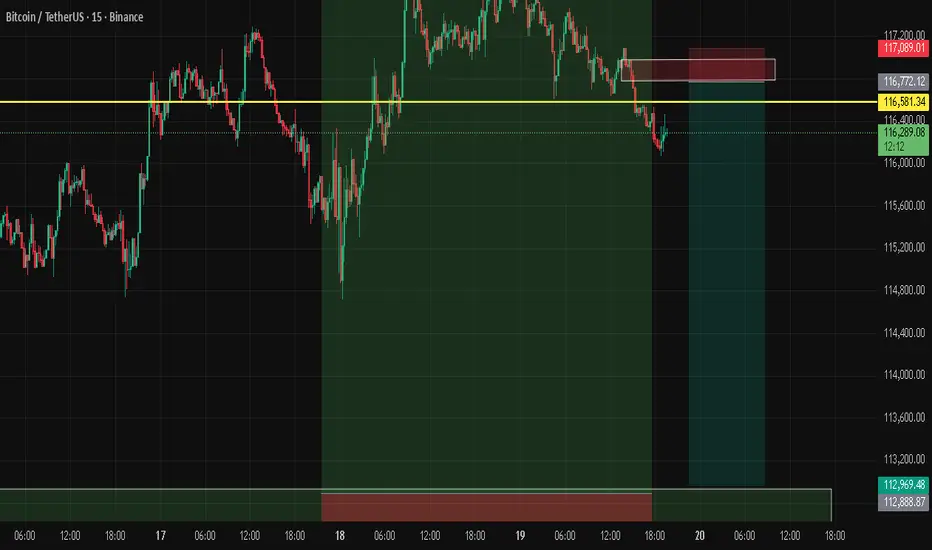
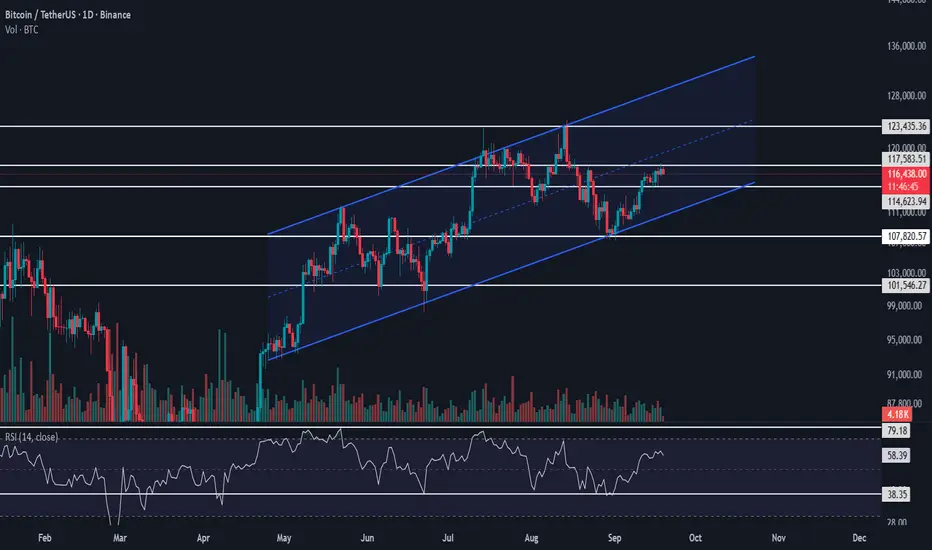
BTC/USDT Analysis📊 BTC/USDT Analysis
Since yesterday, Bitcoin (BTC) has not shown any significant movement and continues to consolidate within its bullish ascending channel. The market structure remains intact, and our previous analysis is still valid.
The key trigger level to watch is 117,583.51. A confirmed brea

ETH long ETH may touch fib 618 level that is 4510 then it can bounce back to 4575 stoploss can be set at 4490

FARTCOIN/USDT — Short (Scalp)✅Rules applied to take the trade
1️⃣•Top-down MTF check: Daily/4H context is bearish with lower highs and momentum fade.
2️⃣•Zone first: Price tapped the 4H/D supply at 0.775–0.800 (origin of the last impulsive sell; imbalance above ~0.79 now filled).
3️⃣ •Wait for LTF confirmation: On 15m/5m w


Btc dominance down sideConfirmation 9:30 pm four hours candle close down side and alt coin pumping start

See all crypto ideas
GOLD WEEKPLAN: UP FIRST DOWN AFTEROANDA:XAUUSD Footprint Analysis
The Footprint chart provides a more detailed view of the order flow. Here are some key points:
Price Pullback: The recent candles show a decrease in buying pressure (green) and an increase in selling pressure (red).
Volume Footprint: The trading volume (Total) a

GOLD SHOWING A GOOD UP MOVE WITH 1:10 RISK REWARD GOLD SHOWING A GOOD UP MOVE WITH 1:10 RISK REWARD
DUE TO THESE REASON
A. its following a rectangle pattern that stocked the market
which preventing the market to move any one direction now it trying to break the strong resistant lable
B. after the break of this rectangle it will boost the market

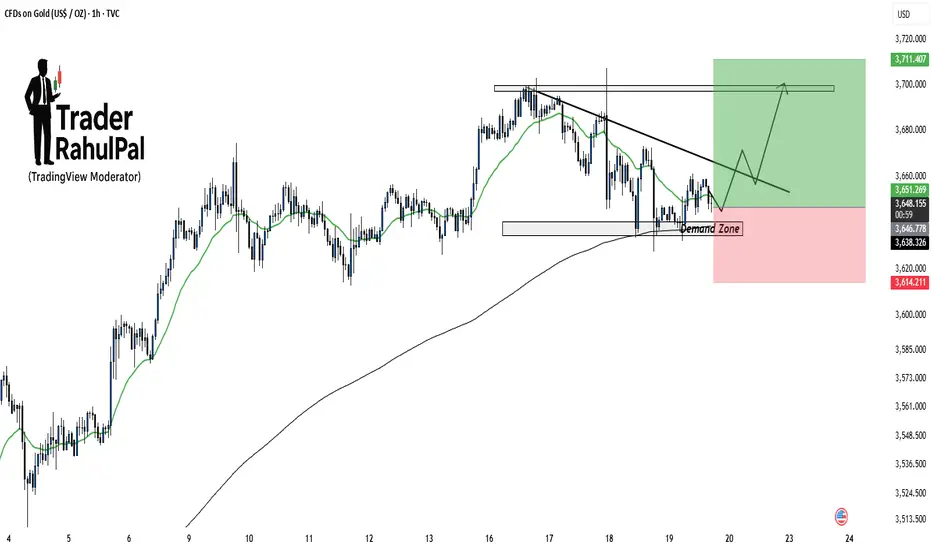
Gold Demand Zone Holding – Upside Potential Toward 3710!Gold is currently testing a demand zone around 3640–3650 , which aligns well with moving average support. As long as this zone holds, price action favors a potential bounce toward the falling trendline and eventually the key resistance area near 3710 . Short-term buyers may look for confirmation i
Gold Market Analysis: September 20, 2025Gold (XAU/USD) continues its remarkable bullish run in 2025, driven by persistent geopolitical tensions, central bank buying, a weakening US dollar, and expectations of further Federal Reserve rate cuts. As of today, the spot price stands at approximately $3,685 per ounce, marking a 1.06% increase f
XAUUSD - Flag PatternWhats your take on Guys.
#Institutions Consolidation going on - #Accumulation or #Distribution.
Kind of #Triangle #pattern in formation, ##Flagpattern. DO your analysis, Enter trade on Breakout and confirmation side. Trade with #confluence. i would say accumulate at bottom of pattern with SL and Par

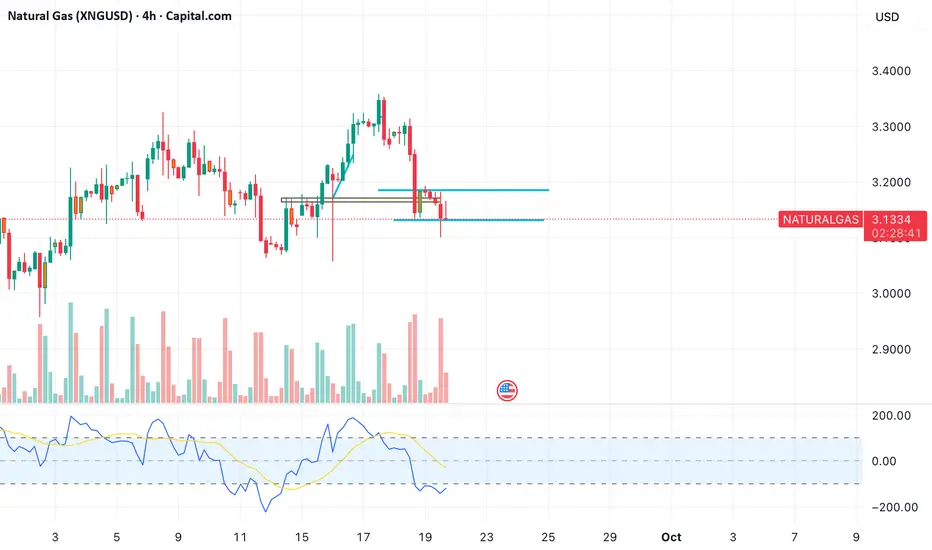
Gas fuelling in for an expiry rally!
Observations:
• Price broke down below the horizontal support zone (~$3.12–$3.13), but the candles show strong rejection wicks which indicats sign of bear trap.
• Bears tried to push below support, but volume did not confirm sustained selling.
• RSI (bottom panel) is in a deeply oversold region

Gold XAUUSD feeling exhausted start sell on rise Gold sell on rise until recent high high 3705 not break and sustain above, profit booking will come , if break 3615 then short term downtrend will start , 3560, 3515 ,3480 downside target
Avoid any buy trade at current price risk of trapping on buy side at top

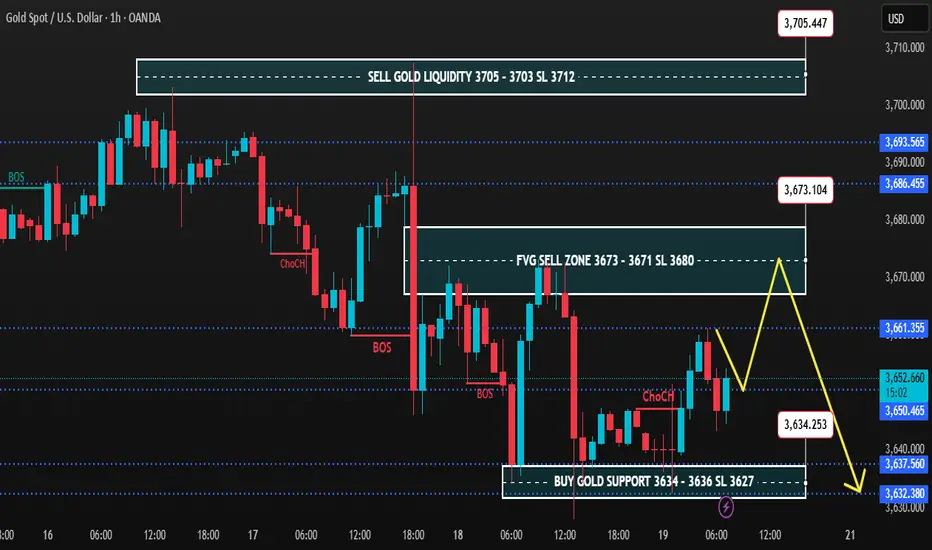
Gold 1H – Risk of Premium Sweeps Before ReversalOn the 1H timeframe, gold is consolidating after consecutive BOS and ChoCH signals, showing rejection from premium levels. The market is oscillating between the fresh FVG sell zone at 3,673–3,671 and the deep discount support at 3,634–3,636. Liquidity remains positioned above 3,705 and below 3,632,
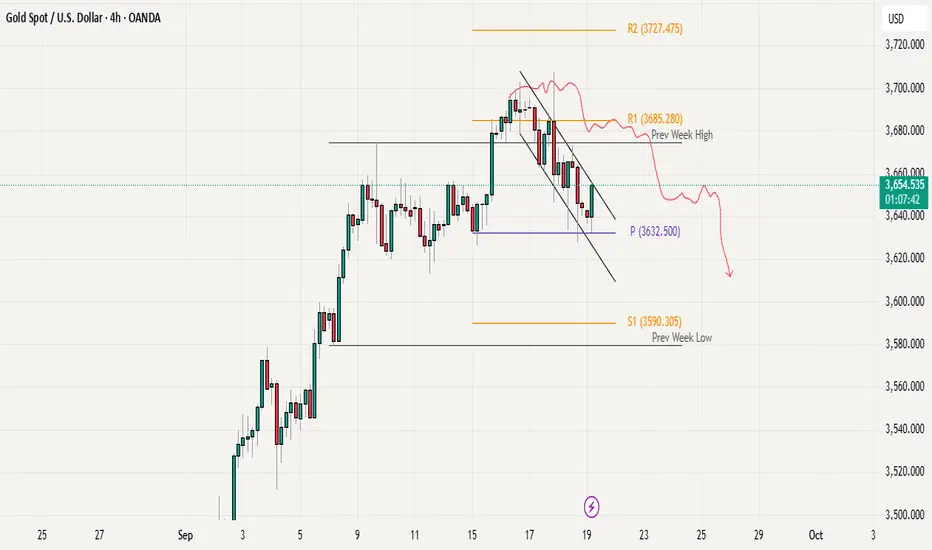
Gold Intraday Analysis: Range Play Until BreakoutGold is currently trading in a range-bound structure after pulling back from the 3700 level. The weekly pivot around 3632 is acting as strong support, while the 3700 zone serves as resistance, forming the upper boundary of the range. Price is showing signs of consolidation between these levels, sugg
See all futures ideas
GBP/JPY WEEKPLAN: Ready for Super OB BuyMarket Structure Analysis
Long-Term Trend: The GBP/JPY pair is in a strong uptrend, confirmed by a series of consecutive higher highs and higher lows (BOS - Break of Structure).
Recent Change: Recently, the price has had a minor structural shift (M-MSS or ChoCH - Change of Character) by breaking t

BULLISH SWING OPPORTUNITY IN GBPCHFSo previously we have had analysis on H4 timeframe for a price retracement.
The price of ICMARKETS:GBPCHF is behaving exactly the same and formed a great Bullish Hammer at strong support level.
When we come on hourly timeframe we witness that the price is in oversold area from where the buyers

selling Eurusddaily time frame market is bullish
4hr = bearish
1hr = bearish
entry at 50% area of 1hr timeframe

USD CAD 3 top head and shoulders pattern on daily candle A valid fair value gap detected and price is now continuously pusing downwards
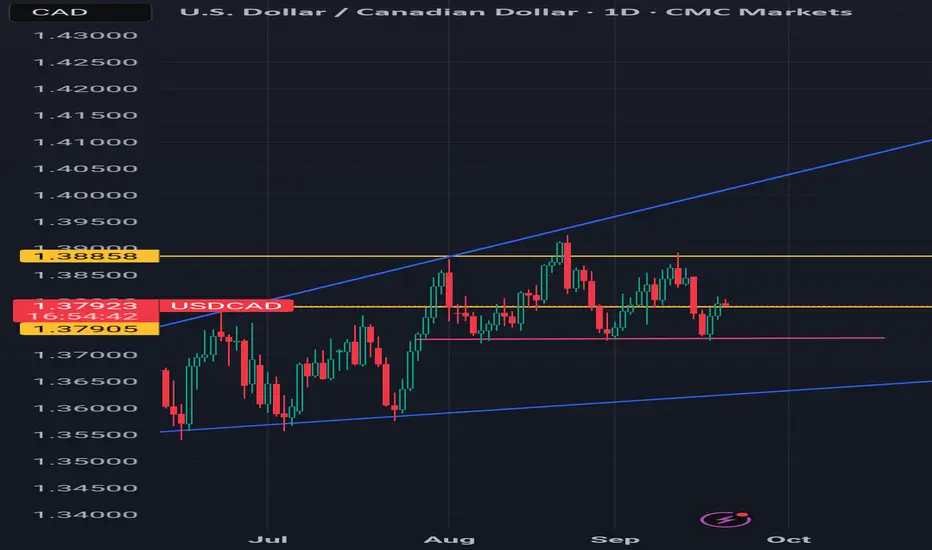
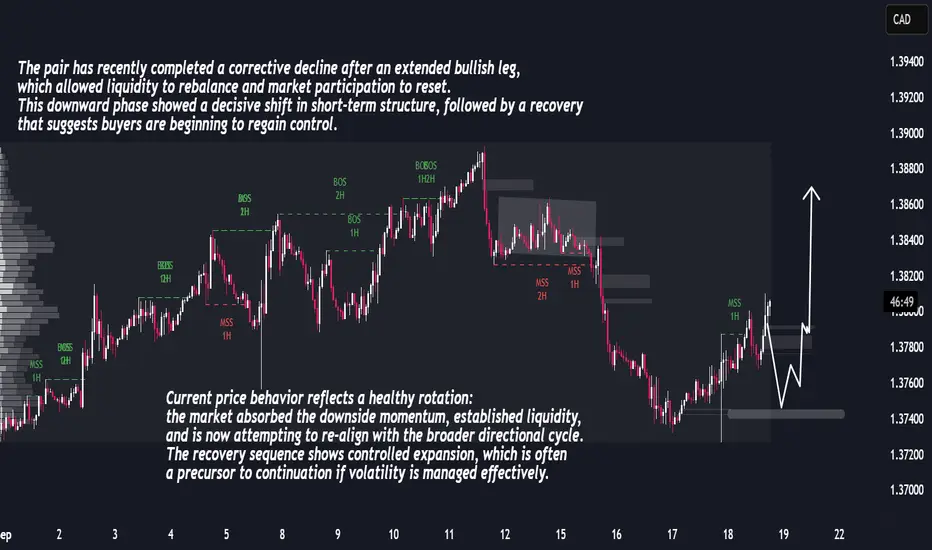
USDCAD Analysis – Market Recovery and Bullish OutlookUSDCAD Analysis – Market Recovery and Bullish Outlook
USDCAD Market Report
USDCAD is emerging from a completed downside leg into a constructive recovery cycle. The prior bearish momentum created imbalance, but recent order flow shows that liquidity has been absorbed, allowing buyers to regain contr
GBPUSD MULTI TIME FRAME ANALYSISHello traders , here is the full multi time frame analysis for this pair, let me know in the comment section below if you have any questions , the entry will be taken only if all rules of the strategies will be satisfied. wait for more price action to develop before taking any position. I suggest yo

Short Idea (EUR/USD)Entry: Around 1.1848 (current price level)
Stop Loss (SL): 1.1859 (above recent swing high)
Target 1: 1.1834 (support area shown on your chart)
Target 2: 1.1825 (if momentum continues downward)
Reasoning:
Price is failing to break above resistance at 1.1850-1.1860.
Recent candles show rejectio

EURO/USDDealing Range & Discount Zone: Price is in the lower half of the recent range, where buyers may step in.
FVG (Fair Value Gap): Market may retrace to fill imbalance before moving higher.
Bullish Order Block: Strong demand area below, likely to support price if tested.
Trendline: Price is compressi

EURUSD Short PossibilitesEURO looks bearish during NY Open targeting the H1 fvg for a quick reversal

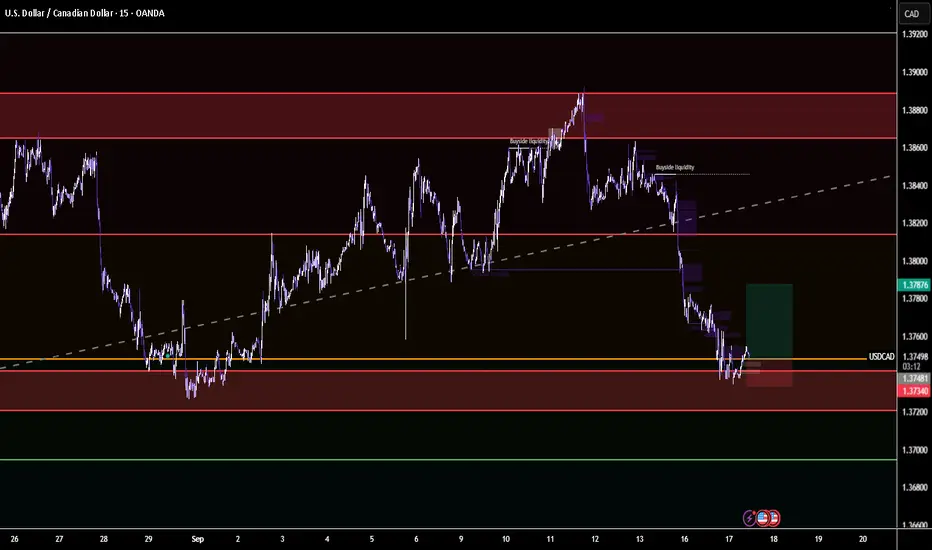
USDCAD Scalping the 1.3740-1.3720 Decision Zone USDCAD at make-or-break support (1.3740–1.3720).
📈 Bullish Plan:
Entry: 1.3745 | SL: 1.3725 | TP1: 1.3770 | TP2: 1.3810 🚀
📉 Bearish Plan:
Entry: <1.3720 | SL: 1.3740 | TP1: 1.3700 | TP2: 1.3680 ⚡
👉 Watch this zone — bounce = long, break = short.
USDCAD is sitting at a critical 1.3740–1.3720 supp
See all forex ideas
| - | - | - | - | - | - | - | - | ||
| - | - | - | - | - | - | - | - | ||
| - | - | - | - | - | - | - | - | ||
| - | - | - | - | - | - | - | - | ||
| - | - | - | - | - | - | - | - | ||
| - | - | - | - | - | - | - | - | ||
| - | - | - | - | - | - | - | - | ||
| - | - | - | - | - | - | - | - | ||
| - | - | - | - | - | - | - | - |
Trade directly on the supercharts through our supported, fully-verified and user-reviewed brokers.


