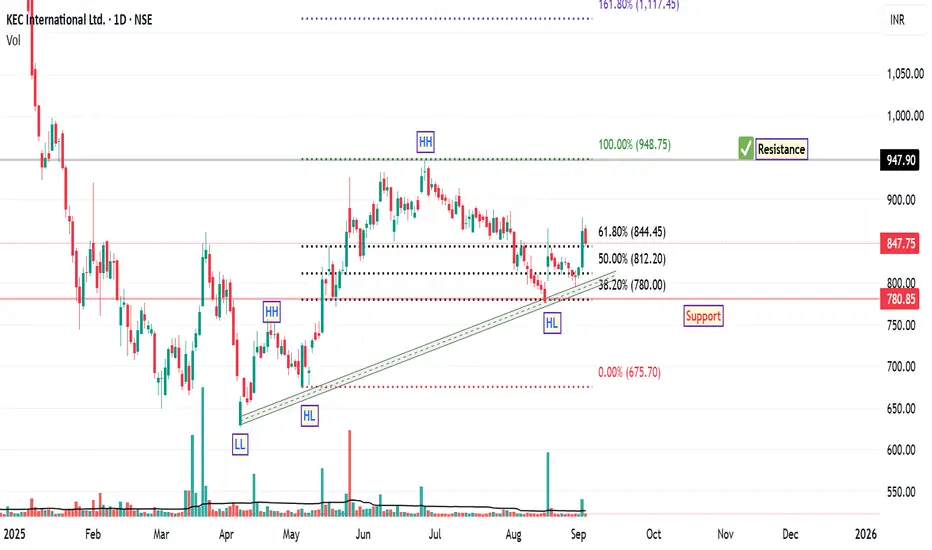
KEC International: Bullish Structure with StrengthSince April 7th, the price structure of KEC International has demonstrated a notable bullish trend reversal, characterized by the formation of higher highs and higher lows along an ascending trendline. This pattern is often interpreted by technical analysts as a sign of strengthening upward moment

The best trades require research, then commitment.
Get started for free$0 forever, no credit card needed

Scott "Kidd" PoteetThe unlikely astronaut

Where the world does markets
Join 100 million traders and investors taking the future into their own hands.
Major indices
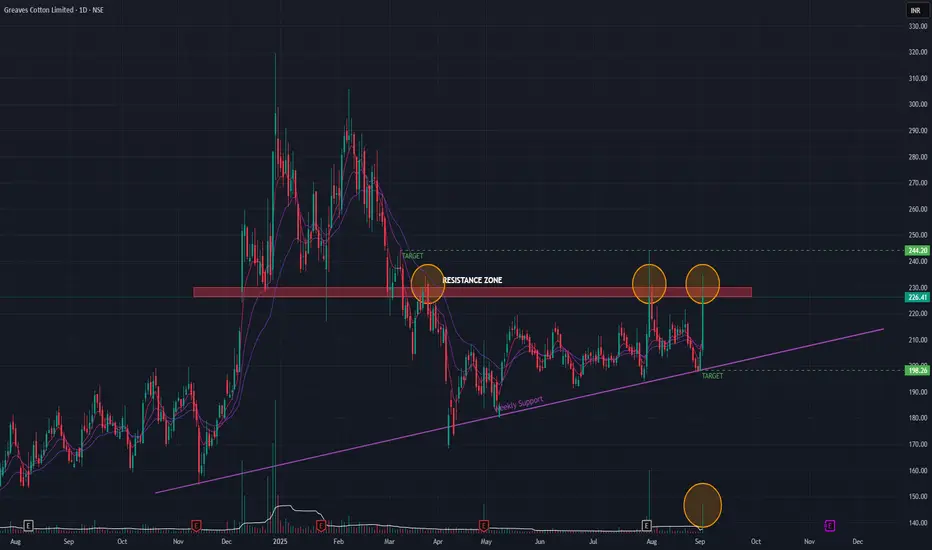
Greaves Cotton (Daily Timeframe) - Will it BreakOut or Not?Greaves Cotton since it's Double-Top formation has been in a downtrend. A key support level has become a resistance zone, which it's been trying to BreakOut few times. The stock has been forming Higher Lows for a while now. Few attempts to BreakOut has been futile. The recent BreakOut attempts been
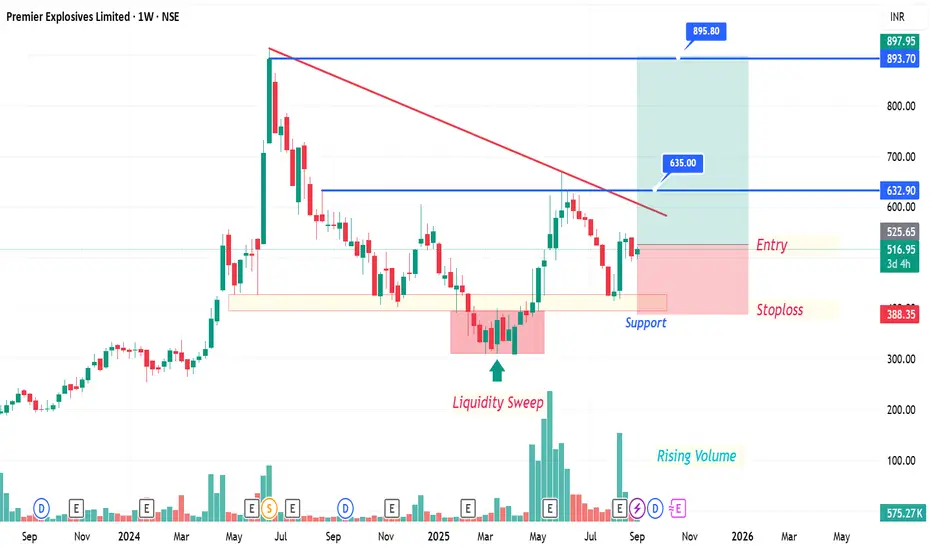
Premier Explosives Limited (NSE: PREMIER) Analysis -1WWeekly Chart Analysis
✅ Support Zone: Strong base around ₹388–400 held well with a liquidity sweep.
📈 Rising Volumes: Indicating accumulation and strong buying interest.
🔻 Downtrend Line: Stock approaching breakout zone near ₹632–635.
📌 Entry Zone: Around ₹517–525 (current levels).
⛔ Stoploss:
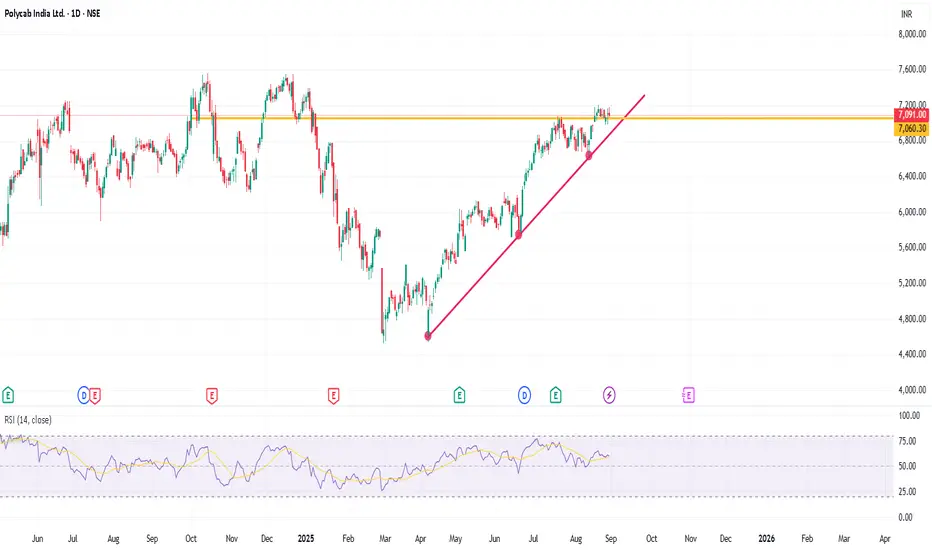
POLYCABThis analysis is intended solely for educational purposes and does not constitute financial advice.
Polycab is showing gradual bullish momentum, supported by a trendline reversal and trading above a key support level. The stock is currently in a minor consolidation phase, which may signal accumulat
Dixon Inverted HnSDixon Technologies is making a inverted Head n shoulder in the daily timeframe.
One can look for taking an entry at the retest of 17300-17320. Support can be considered at todays low. Keep a Check on the Chart and you will get to see how a head n shoulder is made.
Usually the Support for a HnS is

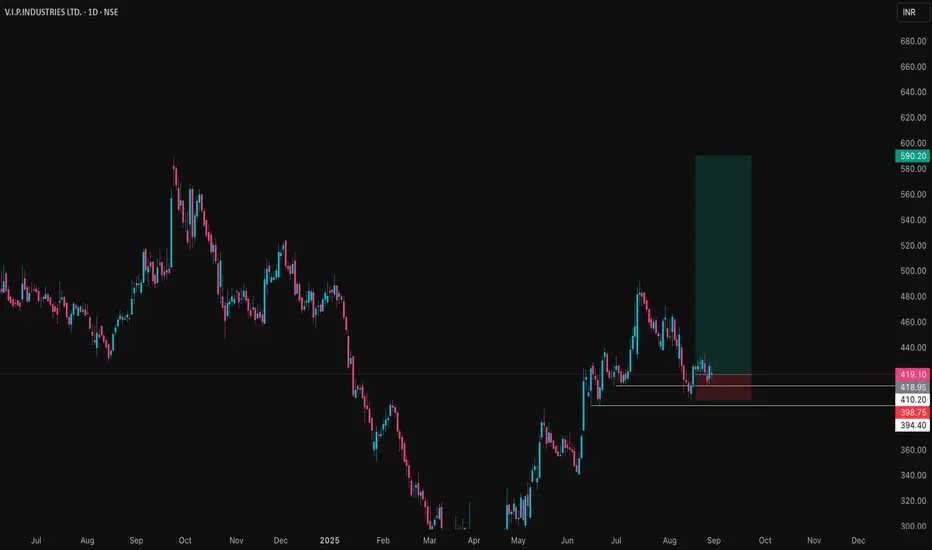
VIPIND Price ActionVIP Industries is trading around ₹420 at the end of August 2025, showing relative stability despite recent operational headwinds. The company reported a decline in both revenue and profitability for the June quarter, with net sales falling to approximately ₹561 crore and a posted net loss of about ₹
Garuda Construction – Cup & Handle Breakout | Swing Trade PlanGaruda Construction has given a textbook Cup & Handle breakout backed by strong volume and solid fundamentals.
Technical Analysis
A Cup & Handle pattern has formed with a neckline breakout above ₹200.
Stock closed strongly at ₹216.33 (+9.66%) with massive volume (7.5M vs 3.1M avg) - confirms inst

Support and Resistance Concept- Bank NiftyThis article concentrates on Support and resistance concept from investment perspective with Bank Nifty monthly chart example.
Let us first understand a few things:
⚪ In simple terms, a resistance is a level from where price rejects significantly because sellers dominated buyers. Contrastingly, su

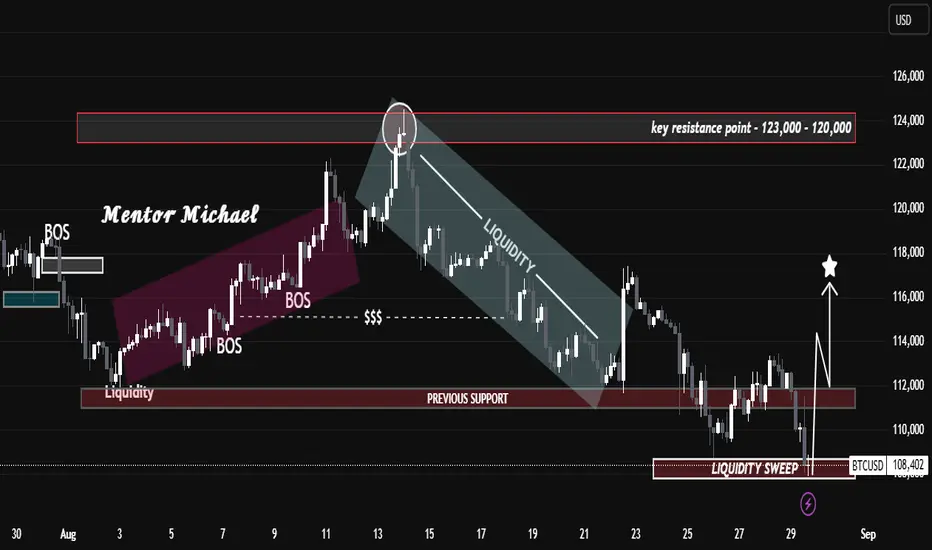
Liquidity Grab Completed – Bulls Back in Control?Liquidity Grab Completed – Bulls Back in Control?
Key Technical Insights:
Resistance Rejection: Price sharply rejected the 120K – 123K resistance zone, confirming this area as a key supply level.
Bearish Liquidity Flow: After rejection, BTC flowed within a descending liquidity channel, continuous
ENDURANCE TECH LOOKS GREATThe stock has been forming an cup and handle pattern lately.
It has a good consolidation of more than one year , the fundamentals are flourishing as well making it a perfect pick for a quick gains
The 2987 level acts as a crucial resistance for the stock , upon breaching that the stock can give mo

See all editors' picks ideas
VWAP Price ChannelVWAP Price Channel cuts the crust off of a traditional price channel (Donchian Channel) by anchoring VWAPs at the highs and lows. By doing this, the flat levels, characteristic of traditional Donchian Channels, are no more!
Author's Note: This indicator is formed with no inherent use, and serves

Fibonacci Sequence Circles [BigBeluga]🔵 Overview
The Fibonacci Sequence Circles is a unique and visually intuitive indicator designed for the TradingView platform. It combines the principles of the Fibonacci sequence with geometric circles to help traders identify potential support and resistance levels, as well as price expansio

ATAI Volume Pressure Analyzer V 1.0 — Pure Up/DownATAI Volume Pressure Analyzer V 1.0 — Pure Up/Down
Overview
Volume is a foundational tool for understanding the supply–demand balance. Classic charts show only total volume and don’t tell us what portion came from buying (Up) versus selling (Down). The ATAI Volume Pressure Analyzer fills that g

Market Cap Landscape 3DHello, traders and creators! 👋
Market Cap Landscape 3D. This project is more than just a typical technical analysis tool; it's an exploration into what's possible when code meets artistry on the financial charts. It's a demonstration of how we can transcend flat, two-dimensional lines and step into

ZigzagLiteLibrary "ZigzagLite"
Lighter version of the Zigzag Library. Without indicators and sub-component divisions
method getPrices(pivots)
Gets the array of prices from array of Pivots
Namespace types: Pivot
Parameters:
pivots (Pivot ) : array array of Pivot objects
Returns: array array

ZigzagLibrary "Zigzag"
Zigzag related user defined types. Depends on DrawingTypes library for basic types
method tostring(this, sortKeys, sortOrder, includeKeys)
Converts ZigzagTypes/Pivot object to string representation
Namespace types: Pivot
Parameters:
this (Pivot) : ZigzagTypes/Pivot

Angled Volume Profile [Trendoscope]Volume profile is useful tool to understand the demand and supply zones on horizontal level. But, what if you want to measure the volume levels over trend line? In trending markets, the feature to measure volume over angled levels can be very useful for traders who use these measures. Here is an att

MathEasingFunctionsLibrary "MathEasingFunctions"
A collection of Easing functions.
Easing functions are commonly used for smoothing actions over time, They are used to smooth out the sharp edges
of a function and make it more pleasing to the eye, like for example the motion of a object through time.
Easing function

Treasury Yields Heatmap [By MUQWISHI]▋ INTRODUCTION :
The “Treasury Yields Heatmap” generates a dynamic heat map table, showing treasury yield bond values corresponding with dates. In the last column, it presents the status of the yield curve, discerning whether it’s in a normal, flat, or inverted configuration, which determined by us

Time & Sales (Tape) [By MUQWISHI]▋ INTRODUCTION :
The “Time and Sales” (Tape) indicator generates trade data, including time, direction, price, and volume for each executed trade on an exchange. This information is typically delivered in real-time on a tick-by-tick basis or lower timeframe, providing insights into the traded size

See all indicators and strategies
Community trends
KEC International: Bullish Structure with StrengthSince April 7th, the price structure of KEC International has demonstrated a notable bullish trend reversal, characterized by the formation of higher highs and higher lows along an ascending trendline. This pattern is often interpreted by technical analysts as a sign of strengthening upward moment
bullishstock at support. already taken a previous liquidity. can move upward for short term move can be expected .

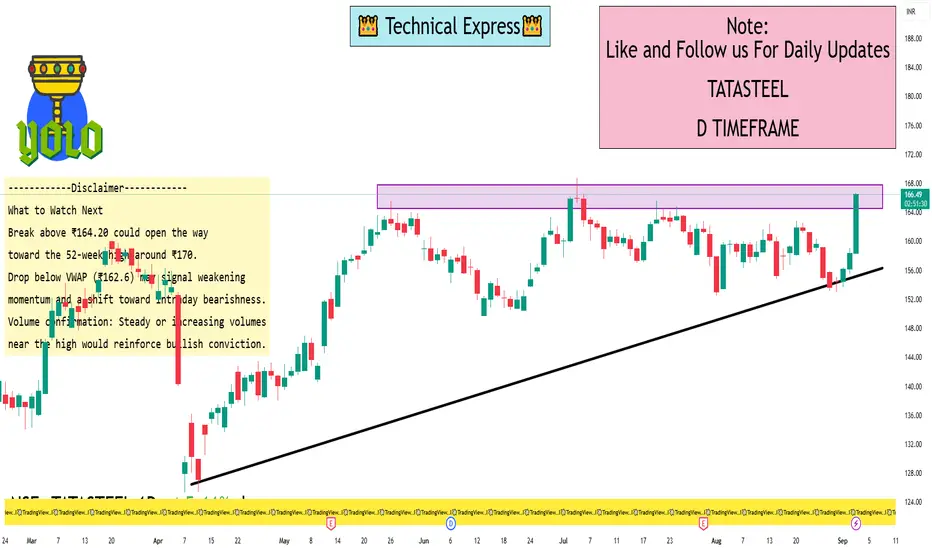
Tata Steel Ltd. 1 Day ViewKey Intraday Metrics (Sep 3, 2025 – by mid-day)
Previous Close: ₹158.39
Today’s Trading Range: ₹158.40 (Low) to ₹164.20 (High)
Latest Price: Around ₹164.42, marking a gain of approximately +3.8% for the day
VWAP (Volume-Weighted Average Price): ₹162.61
Interpretation: One-Day Price Levels
Su
Ola Electric Mobility Ltd.Ola Electric Mobility Ltd.
Price Information
52 Week High (18-Sep-2024) 123.90
52 Week Low (14-Jul-2025) 39.60
Upper Band 74.35
Lower Band 49.56
Price Band (%) 20
Daily Volatility 3.60
Annualised Volatility 68.78
Tick Size 0.01
Securities Information
Status Listed
Trading Status Active
Date of

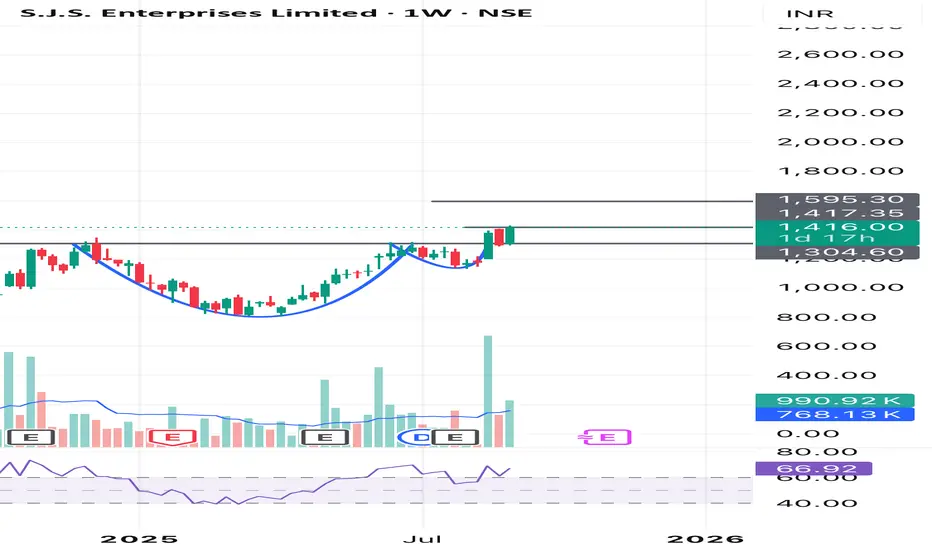
SJS Enterprise : Cup and Handle Patter BreakoutAfter making good run the stock has gone into consolidation phase. In recent weeks the bullish continuation pattern has seen.
The chart is for study purposes only.
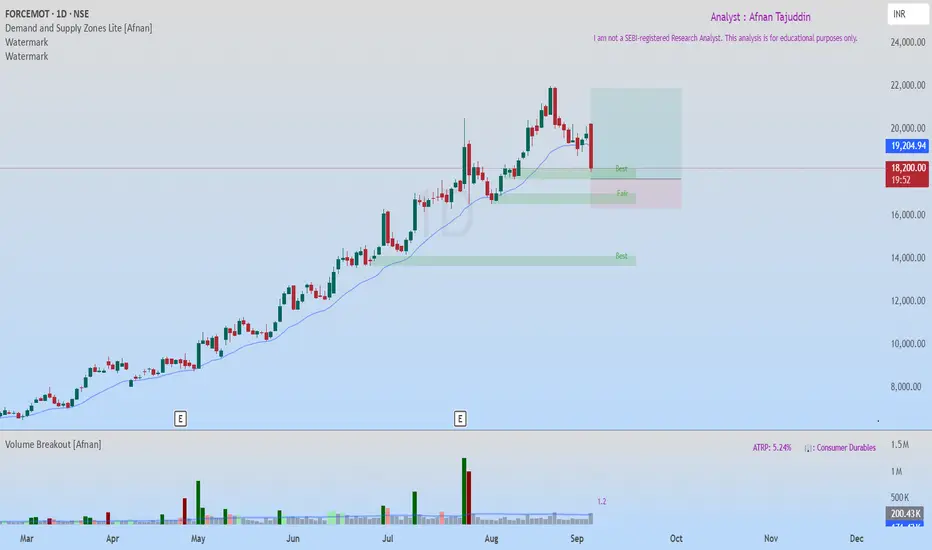
FORCEMOT – Demand Zone Footprint of Smart Money📈 Daily Chart Outlook 📈
Price action on FORCEMOT is showing a clear and strong uptrend , recently pulling back from its all-time high . Such healthy corrections are often where the real opportunities lie, especially when aligned with powerful demand zones.
At present, price is in a Rally-Base-
Tata Steel Price Action Secrets |Backtesting Breakouts & SupportIn this video, I break down Tata Steel’s historical price action to understand its trading behavior. By backtesting past levels, we identify whether the stock respects support zones or follows breakout structures more reliably. This step-by-step analysis shows how to build your own tested data, spot

Glenmark - Looking backPrice had a huge gap up in July and left a big gap. After that, it slowly moved down and filled the gap. Formed a small base and now it is giving a breakout in September. Will it sustain?
Every gap will be filled. And bulls made use of this opportunity, and the price is moving up. As long as the pri

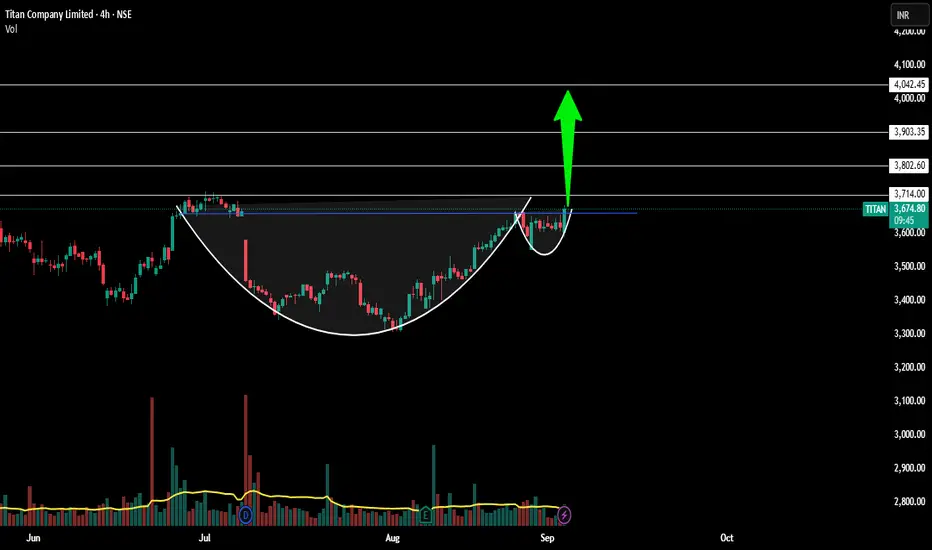
Titan looking good for a 10% upmove to All time high??!!Just a simple Cup and handle pattern...depth of the cup to be the target....
10% from now would be the target level.
Immediate resistance 3726.50...needs to break it!!!!
Looking good in monthly time frame too...with 3 white soldiers candles following a consolidation ....we can expect a good rally if
BUY TODAY SELL TOMORROW for 5%DON’T HAVE TIME TO MANAGE YOUR TRADES?
- Take BTST trades at 3:25 pm every day
- Try to exit by taking 4-7% profit of each trade
- SL can also be maintained as closing below the low of the breakout candle
Now, why do I prefer BTST over swing trades? The primary reason is that I have observed that
See all stocks ideas
No scheduled reports
Community trends
[SeoVereign] BITCOIN BEARISH Outlook – September 03, 2025Let me first take a look at the situation of Bitcoin.
Currently, the situation of Bitcoin is not very good.
These days, it has been continuing to decline, based on 124,400.
Unfortunately, I expect there will be a little more decline this time as well.
The first is the double top.
If you check aroun


XAUUSD GOLD ANALYSIS ON (03/09/2025)BTCUSD UPDATEDE
Current price - 112200
If price stay above 109000,then next target 114500,118000,122000 and below that 105000
Plan; if price break 112200-111800 area and above that 112200 area,we will place buy oder in BTCUSD with target of 114500 and 118000 & stop loss should be placed at 109000

BTC - ShortThe price is currently around $109,930.The chart outlines a gray zone above and a green zone below, representing likely resistance (where sellers may step in) and support (where buyers may be active).
A red shaded area near the current price marks the 50% retracement level—often a key decision point

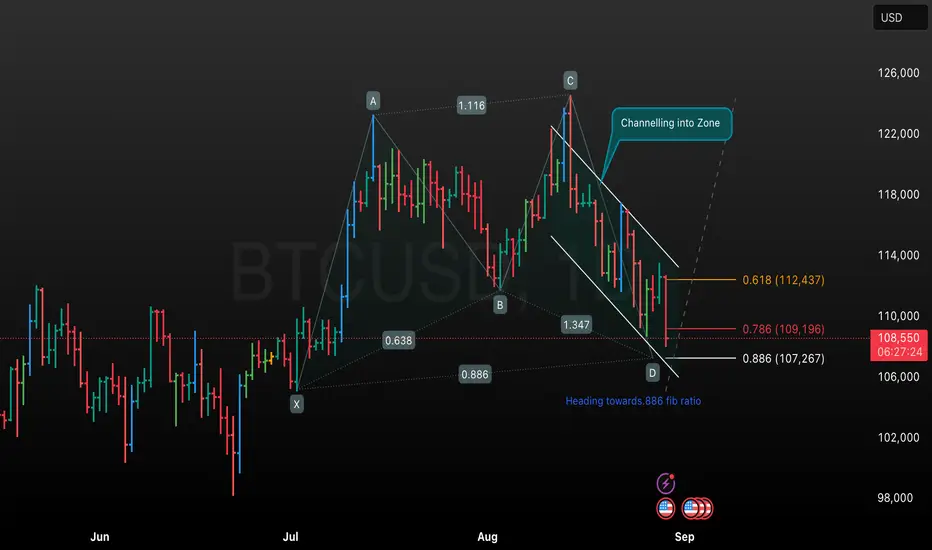
BTCUSD Harmonic Pattern & Fibonacci AnalysisChart Analysis
• The chart uses a harmonic pattern (possibly a Bat or Gartley pattern) marked by the points X, A, B, C, and D, with each leg labeled with its Fibonacci ratio (e.g., AB: 0.638, BC: 1.347, CD targeting 0.886).
• A trend channel is highlighted with the annotation “Channelling into Zon
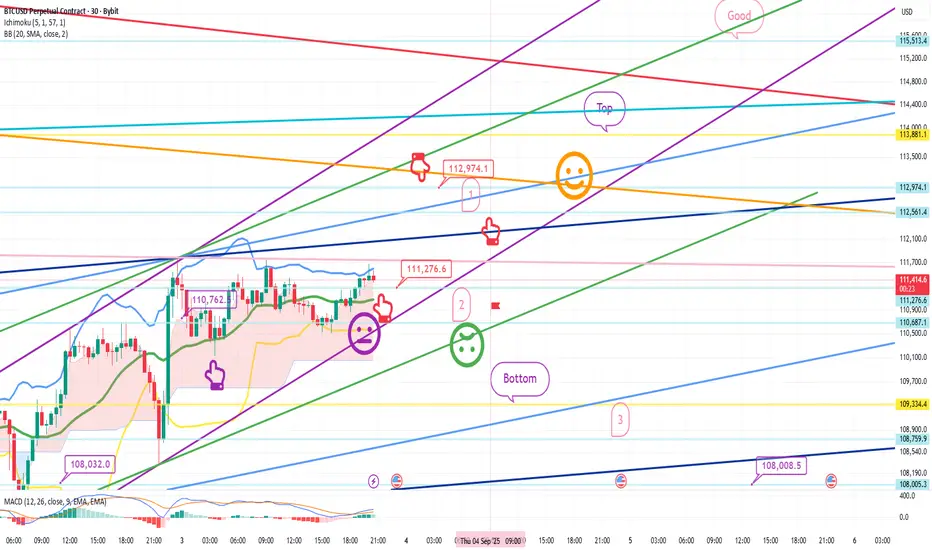
Bitcoin Bybit chart analysis September 3Hello
It's a Bitcoin Guide.
If you "follow"
You can receive real-time movement paths and comment notifications on major sections.
If my analysis was helpful,
Please click the booster button at the bottom.
This is a Bitcoin 30-minute chart.
The Nasdaq indicators will be released at 11:00 AM.
A
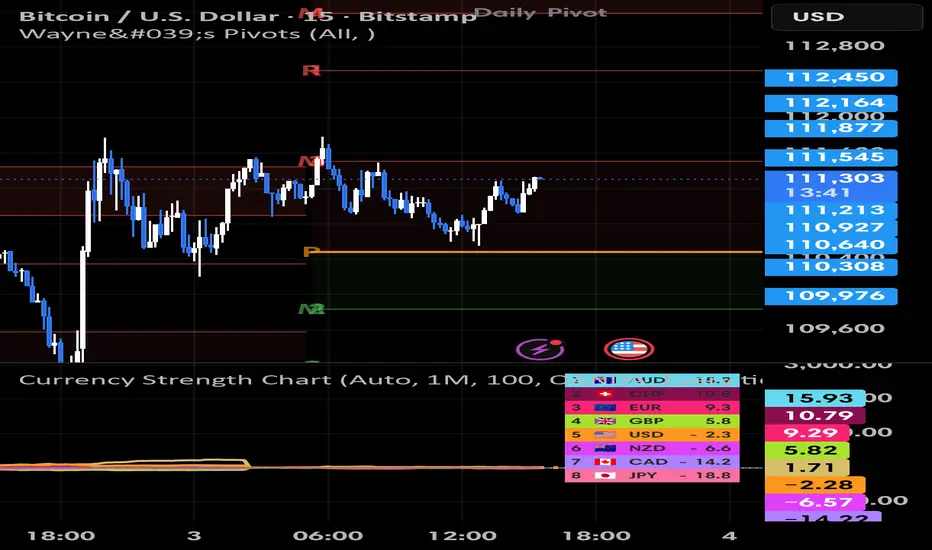
Bitcoin bullish breakout possible Bitcoin currently trading at 111250 and trying to test resistance at 111800 level If Bitcoin breaks resistance level then a target of 112450 can be achieved.Similarly if it goes down it can test 109700 level currently if dollar goes bearish today and tomorrow a bullish breakout possible.
Bitcoin – Bearish Scenario Moving as PlannedBitcoin – Bearish Scenario Moving as Planned
Hello traders,
BTC is moving exactly in line with the plan, reacting well within the channel and showing a pullback at the retest of the rising trend. Hopefully many of you managed to catch the short signal shared earlier.
Following the current momentu

BTC LONG AND HAVING SUPPORT OVER THE CHANNEL Chart Overview
• Pair/Timeframe: BTC/USDT – 4H
• Exchange: Bitget
• Pattern: Breakout from a falling wedge / descending channel, shifting momentum bullish.
• Indicators:
• EMA 9 (yellow) and EMA 20 (blue) are crossing bullishly.
• Volume spike supports the breakout.
⸻
Price Action
• BTC bro

BTC/USD – FVG Buy Zone Setup Targeting $113K🔎 Chart Overview (BTC/USD 30m)
Price is currently trading at $110,517.
EMA 70 (111,276) above price → short-term bearish.
EMA 200 (110,598) acting as immediate support zone.
📐 Trend & Channel Strategy
Market is moving inside an ascending channel (support & projection line).
Price recently retr

See all crypto ideas
GOLD 03/09: TIME TO SELL, WHERE TO BUY TODAY?1. Overall Analysis
Elliott Wave:
Wave (5) seems to have completed, signalling a possible distribution phase.
The market is likely moving into an ABC corrective structure, with Wave A expected to retrace to key Fibonacci levels before a Wave B rebound.
Smart Money Concept (SMC):
The Break of Structu

XAUUSD Gold Trading Strategy September 3, 2025XAUUSD Gold Trading Strategy September 3, 2025: Gold prices are stable, heading towards the $3,550 mark with ETF capital flows boosting and the market is also waiting for employment data and developments from the FED.
Basic news: Spot gold prices remained stable in today's Asian trading session, af

MARKET CONTEXT-Gold is in a strong uptrend, with strong momentum pushing the price above 3500 – an important psychological level.
-However, after reaching a peak around 3552, the price is now pulling back to the 3532 area.
➡️ On H1 & M15, the Higher High – Higher Low structure is still intact, but the big red can

GOLD crosses $3500! What’s next for Indian traders?Gold (XAUUSD) has shown massive momentum, moving nearly 50–60 points daily. Price is now reacting at an important FIBO extension level. Sellers are stepping in, but so far there is no strong confirmation on higher timeframes (H1–H2).
📊 MMFLOW VIEW
Sideways consolidation → Breakout → New ATHs eve

“XAUUSD – Strong Sell Setup from All-Time High Resistance“XAUUSD – Strong Sell Setup from All-Time High Resistance 🚨📉”
Currently, gold has reached a strong resistance zone around 3575 – 3600, where price is showing signs of exhaustion after a strong bullish rally. This area is a key supply zone and could trigger profit-taking or fresh short entries.
Fro

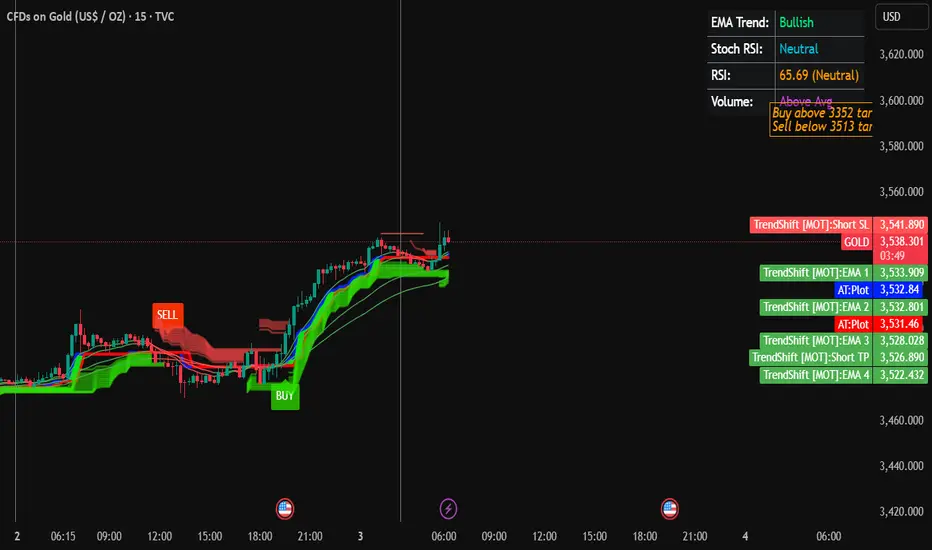
Gold Trading Strategy for 03rd September 2025📊 Gold Trading Plan
🔹 Buy Setup
Condition to Buy: Enter a Buy position only if the price closes above the high of the 15-minute candle at $3352.
Targets for Buy:
$3363
$3374
$3385
🔹 Sell Setup
Condition to Sell: Enter a Sell position only if the price closes below the low of the 1-hour candle at
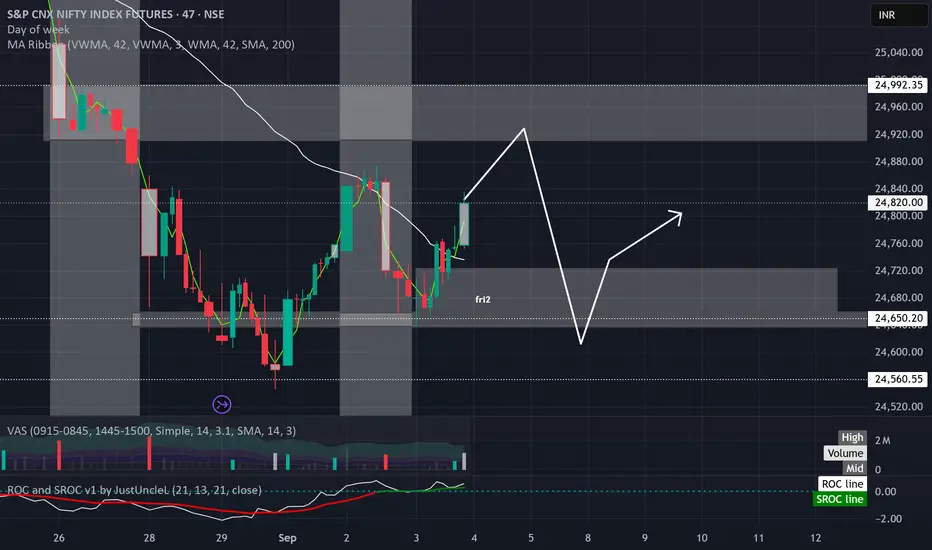
"Baby I Got You"
**🎭 Dear NIFTY, Playing the Same Old Tricks Again? We See You! 👀**
**The Classic NIFTY Playbook - Chapter 247:**
Oh look, NIFTY's at it again with the good old reliable scam! 🙄
**The Setup (We've Seen This Movie Before):**
• Creates "strong support" at 24,640 - because why not give retail hope?
XAUUSD – Breakout Sets the Stage for More UpsideXAUUSD – Breakout Sets the Stage for More Upside
On the Daily chart, gold has cleared the horizontal resistance around 3,500 , ending a prolonged consolidation phase and confirming the Ascending Triangle pattern . This signals that buyers remain firmly in control.
In the short term, a pullback

Gold Approaches All-Time High with Strong Bullish MomentumAnalysis:
Gold (XAU/USD) is showing strong bullish momentum after breaking through the buy zone around the $3,450 level. Price action has respected the ascending channel and successfully pushed above key resistance levels.
Currently, gold is trading at $3,473, with the next major target set at the

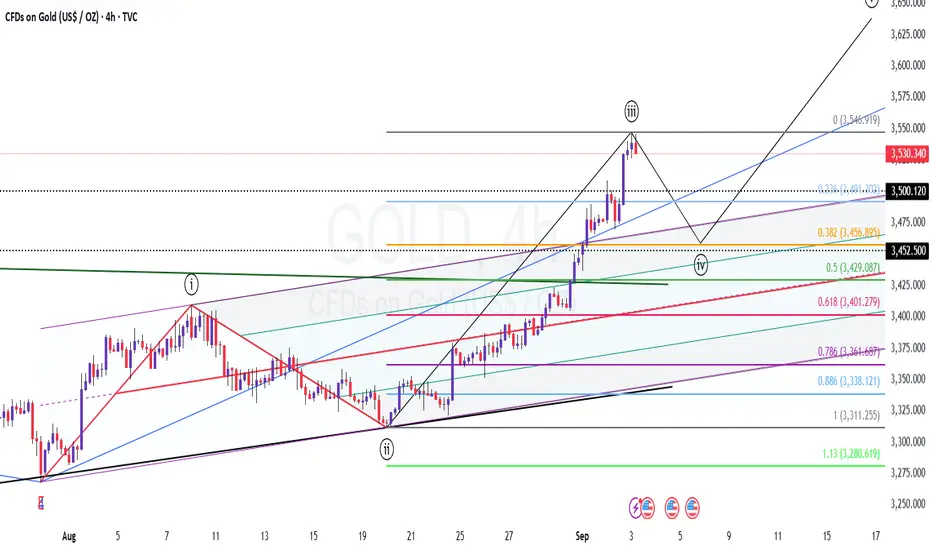
Gold - correction in 4th waveCMP: 3530
TF: 4 Hours
Dont jump to buy at this price.. Ideally the price should move below 3500 to complete the 4th wave correction..
EW counts and Pitchfork set ups are marked for the possible target location
Remember, this fall will be zigzag or complex.. so whipsaws can be seen often.
Sharing
See all futures ideas
GBPUSD(20250904)Today's AnalysisMarket News:
① Waller: I believe we should cut interest rates at the next meeting. Multiple rate cuts are possible in the future, but the exact pace depends on the data.
② Musallem: Current interest rates are appropriate, but there are risks in the job market.
③ Bostic: Concerned about inflation, I

EUROUSD📊 What is a Liquidity Sweep?
A liquidity sweep happens when price moves below/above a key support or resistance level to trigger stop-loss orders or capture liquidity before reversing in the opposite direction. Big players (institutions/smart money) push price into these zones to collect orders. Ret

EURUSD BUY PLAN - DAY TRADE SETUPEURUSD is showing strength on 1 HR Time frame, swept Asian Session liquidity of both sides. Now clear structure break upside, Plan for buy is market retrace towards FIB Area 0.79 aligned with ORDER BLOCK + FVG . Best entry if Market creates Inducement at Fib level 0.5 and retrace towards 0.79 and p

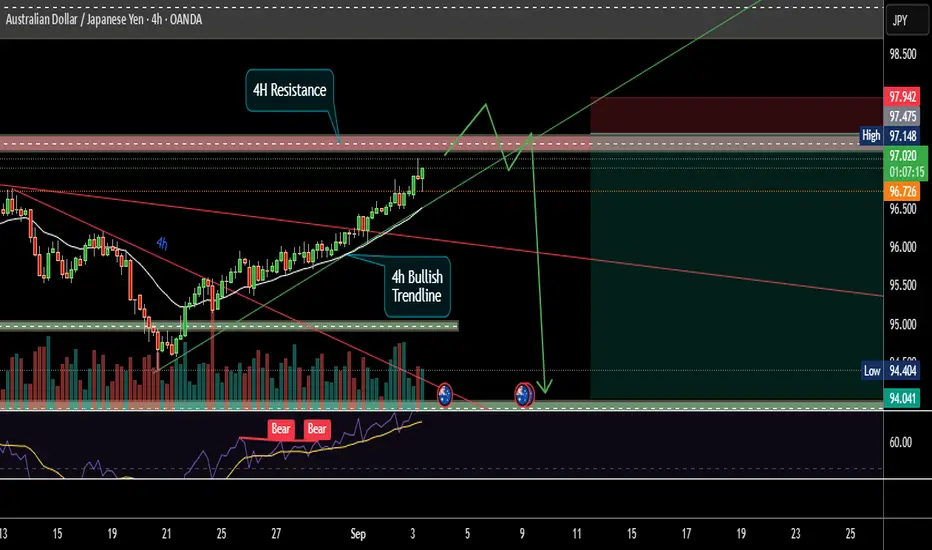
A beautiful AUDCHF high RnR scenarioAUDCHF is approaching 4H resistance zone which has already show rejection previously. There is also a steep bullish trend line creating a confluence. RSI has already shown Bearish Divergence. All these signaling a coming very good sell side opportunity. Below are points detailing the same.
1. Price
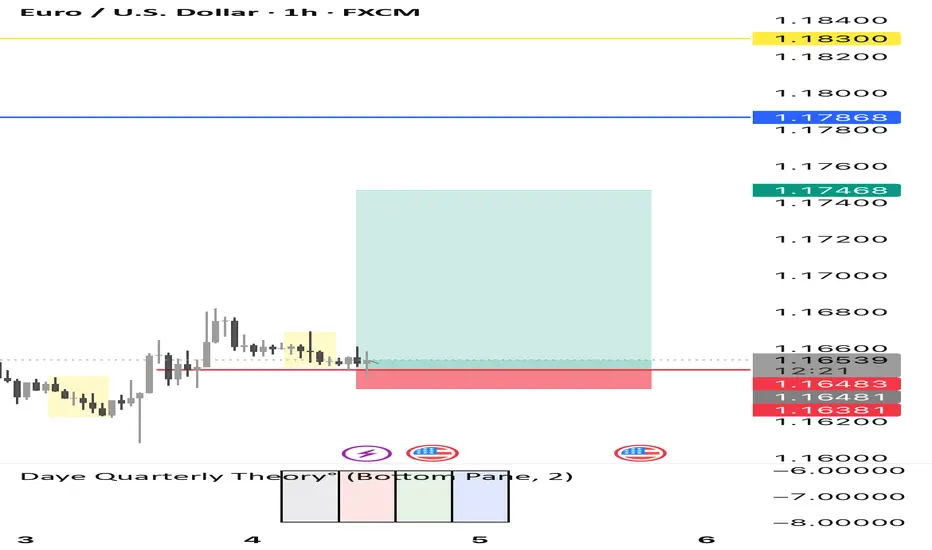
BUY EURUSDEUR/USD – Buy Setup 📈
Entry: 1.16564
Stop Loss: 1.16058
Take Profit: 1.18758
Reasoning: Price bounced from key supportwith bullish candlestick confirmation.

EUR/USD Long SetupPrice consolidating after recent downside move.
Entry taken from demand zone with stop below structure and target towards recent highs.
Looking for bullish continuation as liquidity builds to the upside.
REMEMBER THIS IS A HIGH RISK TRADE(Not the best setup possible)

EURUSD 1H Chart – Bullish Setup✅ Support: 1.1640–1.1650
🎯 Targets: 1.1746 / 1.1786 / 1.1830
⛔ SL: Below 1.1638
Bias: Bullish as long as above support. Upside momentum may push towards 1.1830.
#Forex #Trading #EURUSD #PriceAction
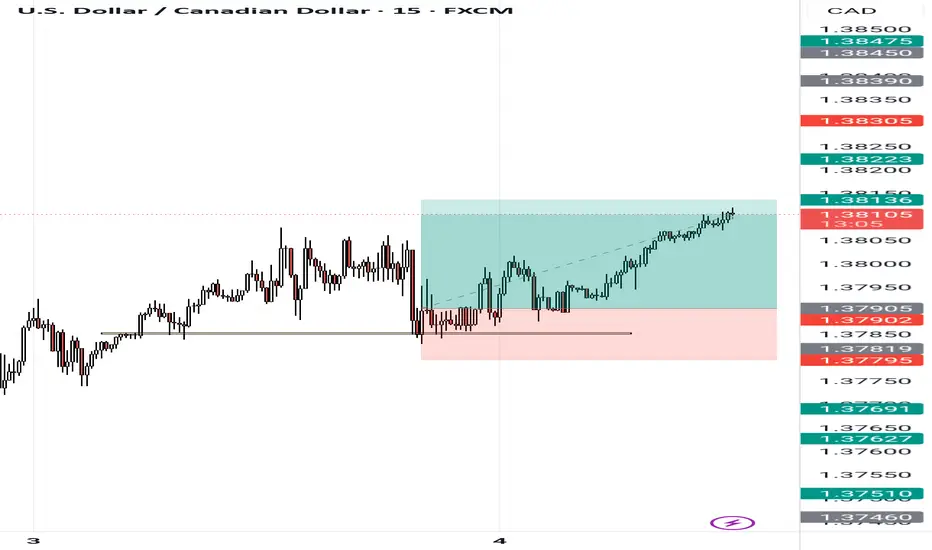
BreakOut Retest Strategy Price came back to a fresh supply zone.
First candle went bullish, second candle (50% wick / 50% body) showed rejection + sellers entering.
You entered sell after confirmation.
Stop above zone, TP far below → 1:8 RR achieved.
Key: fresh zone + rejection + patience → high probability trade.
Sell Trade - NZD/USDGreetings to everyone!
You can place a sell trade on NZD/USD and check out my chart for the ideal entry, stop-loss & target placement.
Remember :-
* Move your SL to breakeven once the trade reaches 1:1 R.
* Aim for a minimum reward of 1:1.5 R.
* Don't risk more than 3% of your total margin.

GBPNZD Market Outlook: Pound Strength vs Kiwi WeaknessGBPNZD Market Outlook: Pound Strength vs Kiwi Weakness
GBPNZD Analysis Report
🔎 Technical Outlook
The pair has shown a clear upward channel structure, followed by a sharp breakout with strong bullish momentum.
After topping out, price shifted into a downward corrective leg, suggesting rebalancing

See all forex ideas
| - | - | - | - | - | - | - | - | ||
| - | - | - | - | - | - | - | - | ||
| - | - | - | - | - | - | - | - | ||
| - | - | - | - | - | - | - | - | ||
| - | - | - | - | - | - | - | - | ||
| - | - | - | - | - | - | - | - | ||
| - | - | - | - | - | - | - | - | ||
| - | - | - | - | - | - | - | - | ||
| - | - | - | - | - | - | - | - |
Trade directly on the supercharts through our supported, fully-verified and user-reviewed brokers.


