JSW SteelAfter a long time price has formed a strong bull candle near the resistance zone. 1020 is important for the bulls to gain strength and sustain to move up.
Buy level if you are a cautious trader is above 984 - 988 zone with stop loss of 979 for the targets 996, 1003, 1011 and 1018. You can book profit or trail for further profit depending on bullish strength at the zone 1020.
Next resistance is seen at 1060 zone.
Same time you should keep these observations in mind before taking any trading decisions.
Up trend is slow and choppy though we have got good momentum today.
Price is near to the resistance zone 1020.
Bears are still hiding, that is why upward movement is slow. If they decide to take control, price can fall fast from the resistance zone.
Note : Always do your own analysis. Your decisions create changes in your capital only.
Community ideas

EMS LimitedEMS Limited is a multi-disciplinary EPC company, headquartered in Delhi that specializes in providing turnkey services in water and wastewater collection, treatment and disposal. EMS provides complete, single-source services from engineering and design to construction and installation of water, wastewater and domestic waste treatment facilities.
Right now Indian Market is not supporting any long position at this moment, but the EMS Limited chat looks very attractive. however I am sharing with you all. I hope you will like this publication. Thanks for watching & visiting again.

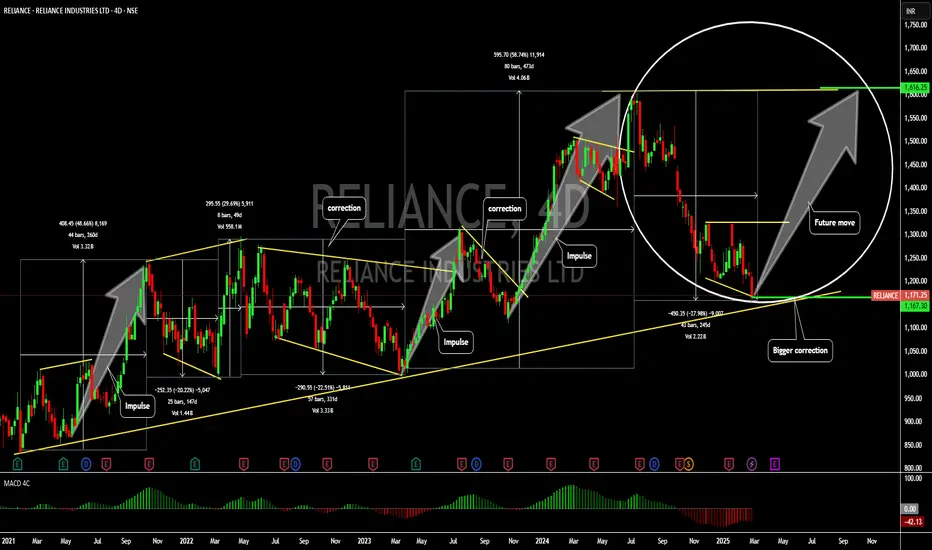
Best buying Opprtunity in Reliance stock Reliance Industries Announces ₹20,000 Crore Green Energy Joint Venture
Reliance Industries Limited (RIL) has partnered with a leading European firm to invest ₹20,000 crore in India’s renewable energy sector.
The joint venture aims to accelerate the development of solar power, wind energy, and green hydrogen production.
As part of this collaboration, advanced gigafactories will be established to manufacture solar photovoltaic (PV) modules, wind turbines, and electrolyzers, promoting indigenous production under the ‘Make in India’ initiative.
The project is expected to generate thousands of direct and indirect employment opportunities, particularly for engineers, technicians, and skilled professionals.
This strategic partnership will contribute significantly to reducing carbon emissions, aligning with India’s Net Zero Emission targets.
Additionally, the venture will enhance India’s position in the global renewable energy market by integrating next-generation energy solutions, smart grid technology, and AI-driven energy management systems.
Support Levels:
Current Support Zone: ₹1,205 - ₹1,214
Extended Support Level: ₹1,150
Major Support Zone: ₹999 - ₹1,019
Resistance Levels:
Immediate Resistance Zone: ₹1,298 - ₹1,316
First Short-term Target: ₹1,450
Second Short-term Target: ₹1,650
Major Resistance Zone: ₹1,578 - ₹1,611 (near all-time high)
The stock is currently testing the support zone of ₹1,205 - ₹1,214, and if this level breaks, the next downside level to watch is ₹1,150. On the upside, the ₹1,298 - ₹1,316 zone acts as resistance, with potential for further movement towards ₹1,450 and ₹1,650 if strength builds.
LIKE & SHARE , Comment For More Stock Analysis

Reliance- A great company to add to portfolio
Hello,
Reliance Industries Ltd. engages in hydrocarbon exploration and production, petroleum refining and marketing, petrochemicals, retail, and telecommunications. It operates through the following segments: Oil to Chemicals (O2C), Oil & Gas, Retail, Digital Services, Financial Services, and Others.
Quarterly Performance (3Q FY25 vs 3Q FY24)
Gross Revenue increased by 7.7% Y-o-Y to ₹ 267,186 crore ($ 31.2 billion)
JPL revenue increased by 19.2% Y-o-Y due to continuing flow through of tariff revisions for mobility services, and healthy growth in homes and digital services businesses.
RRVL revenue increased by 8.8% Y-o-Y with growth across consumption baskets driven by festive buying and wedding season.
Oil to Chemicals (O2C) revenue improved by 6% Y-o-Y with higher volumes and increased domestic product placement. Planned shutdown of major units during the same quarter last year impacted volumes.
Marginally lower KGD6 volumes and fall in price realisations for CBM and condensate led to 5.2% decline in Oil and Gas segment revenue.
EBITDA increased by 7.8% Y-o-Y to ₹ 48,003 crore ($ 5.6 billion)
JPL EBITDA increased by 18.8% Y-o-Y driven by higher subscriber base, improving ARPU
and favorable mix.
RRVL EBITDA increased by 9.5% with improved operational efficiencies and superior store operating metrics.
O2C EBITDA increased by 2.4% supported by higher volumes and operational flexibility.
Efficient feedstock sourcing, higher domestic product placement and improved polymer deltas offset weak fuel cracks.
Oil and Gas segment EBITDA decreased by 4.1% largely on account of decline in volumes and price realisations.
Depreciation increased by 2.2% Y-o-Y to ₹ 13,181 crore ($ 1.5 billion).
Finance Costs increased by 6.7% Y-o-Y to ₹ 6,179 crore ($ 722 million), primarily due to higher debt balance. However, net debt remained largely flat.
Tax Expenses increased by 7.8% Y-o-Y to ₹ 6,839 crore ($ 799 million).
Profit After Tax and Share of Profit/(Loss) of Associates & JVs increased by 11.7% Y-o-Y to ₹ 21,930 crore ($ 2.6 billion).
Capital Expenditure for the quarter ended December 31, 2024, was ₹ 32,259 crore ($ 3.8 billion).
Below are the opportunities for the business.
Reliance
Reliance Retail targets 20% annual growth, doubling the market’s 10% CAGR.
Reliance plans 20GW solar PV by 2026, battery production, and strategic investments in O2C and O&G.
Risks to consider before investing
High freight costs, limited market presence, and balancing sustainability with profitability amid global over-capacity.
Tight crude supply, regulatory impacts on fuel, and competition from Chinese exports and trade agreement imports.
Our view.
I see an opportunity to buy reliance from the current point both from a technical perspective as well as fundamental analysis. The company is well aligned to capitalise on future growth. Zero crossover on the MACD indicator will confirm the buy bias.
Good luck.
Nifty Descending Triangle Breakdown What’s Next?Hello friends! let’s dive into an ordinary yet insightful Nifty chart and explore the future possibilities together. Stay tuned for an easy-to-understand analysis!. The Indian stock market has witnessed a strong bearish move as the Nifty 50 index decisively broke a critical support level. The price action suggests a continuation of the downtrend, raising concerns for bullish traders and providing opportunities for short-sellers. Let’s analyze the current structure and potential price targets.
📌 Key Observations from the Chart:
🔻 Breakdown of 22,800 Resistance Level
The index was previously holding above 22,800, but the recent large red candle confirms a breakdown.
A failed attempt to reclaim this level signals continued bearish momentum.
📉 Bearish Momentum Strengthens
A decline of 1.86% (-420 points) in a single session reflects strong selling pressure.
The increased trading volume suggests institutional participation, adding weight to the bearish trend.
🔺 Descending Triangle Formation & Breakdown
The chart clearly illustrates a descending triangle pattern, a classic bearish continuation formation.
The lower highs (🔴 red markers) indicate sustained selling pressure, with each attempt to rise facing strong resistance.
The breakdown below the triangle’s lower boundary has confirmed further downside movement.
📊 Next Major Support at 21,200
The next key level to watch is 21,200, marked as a significant support zone.
If the price reaches this level, traders should monitor for potential reversal signals, such as bullish candlestick formations or divergence in indicators.
📢 Breakout Retest Observations
A retest of the 22,800 breakdown level is possible before further downside.
If price faces rejection at this level with high volume, it may signal further downside towards 21,200.
A successful reclaim of 22,800 could indicate a potential bullish reversal, making this level crucial to watch.
📈 Trading Strategy Based on Current Price Action:
🦅 For Bears (Short-Sellers):
Maintain a bearish bias as long as price stays below 22,800.
Watch for a retest of this level before initiating fresh short positions.
Target levels: 21,200 (first target) and psychological level of 21,000.
🐂 For Bulls (Long-Term Investors):
Wait for signs of reversal around 21,200 before taking long positions.
A strong bullish candle, bullish divergence, or confirmation from oscillators like RSI could indicate a potential bounce.
Only re-enter long positions if price reclaims 22,800 convincingly with strong volume support.
📢 Final Thoughts
The current market sentiment is bearish, with Nifty 50 breaking a key support zone and confirming a descending triangle breakdown. If selling pressure persists, the 21,200 level will be the next critical area to watch. Traders should closely monitor price action and volume for confirmation of further moves.
📌 Stay cautious, manage risk, and follow proper stop-loss strategies in this volatile environment.
💬 What are your views on the current market structure? Share your thoughts in the comments!
Best Regards- Amit

Cartrade tech price action analysisBased on the available information, here's an analysis of CarTrade Tech Limited's (CARTRADE) price action and financial performance:
## Recent Performance
CarTrade Tech Limited has shown strong financial performance in its latest quarterly report. For Q3 FY2024, the company reported:
- Revenue increase of 45% year-over-year, reaching ₹400 crore (USD 48 million)
- Operating income of ₹100 crore (USD 12 million), up 60% from the previous year
- Net profit surge to ₹50 crore (USD 6 million), a 70% increase year-over-year
The company's third-quarter 2025 earnings exceeded analyst expectations, with revenue beating estimates by 5.2% and earnings per share (EPS) surpassing forecasts by 41% .
## Market Position
CarTrade Tech maintains a strong position in the Indian online automotive marketplace:
- 25% market share in the online used car segment as of 2024
- Targeted 15% growth in marketplace transactions year-over-year
- Plans to expand offerings of electric and hybrid vehicles by 30% by mid-2024
## Future Outlook
Analysts have provided the following price targets for CARTRADE:
- Price target: ₹1,689.00
- Maximum estimate: ₹1,934.00
- Minimum estimate: ₹900.00
Revenue is forecast to grow at 15% per annum, indicating continued expansion .
## Investment Potential
CarTrade Tech has been identified as one of the top stocks that could potentially offer 15-30% returns in 2025, according to Nomura . This suggests positive sentiment among analysts regarding the company's future performance.
Given the company's strong financial results, market position, and positive analyst outlook, CARTRADE appears to be in a favorable position for potential price appreciation. However, investors should conduct their own due diligence and consider market risks before making investment decisions.

AHL -Bottom FishingThe stock price has dropped around 60-70% in the last 6 months. From an all-time high to an all-time low in just 6 months.
This time, it is consolidating at the lowest prices for a month.
If it gives a bounceback, it could be a good trade setup with a good risk-reward ratio.
The projected targets are 260/350 or more.
The setup remains active above the price of 180. It loses significance if sustained below 160.
All these illustrations are only for learning and sharing purposes. not a buy or sell recommendation.
All the best.

After 1-Year Consolidation, NH Near New Highs – What's Next?The stock was in a 1-year consolidation phase , struggling to break past a strong resistance zone. Throughout this phase, the 200 Exponential Moving Average (EMA) acted as a solid support level , with buying pressure emerging every time the price approached it.
During consolidation, low volume indicated accumulation , and a massive surge in volume was observed as the resistance level was breached, confirming institutional participation. The RSI coming out of range further strengthens the breakout confirmation; however, caution is needed as it is just below the overbought level.
A retest of the breakout zone would offer an ideal entry opportunity, provided there is follow-up buying to sustain momentum.
To manage risk effectively, a strict stop-loss should be placed below the previous resistance , which is now acting as support.
Disclaimer: The information and publications are not meant to be, and do not constitute, financial, investment, trading or any other types of advice or recommendations.

Shriram Finance Ltd Stock Analysis**GlobalTradeHub | Shriram Finance Ltd Stock Analysis**
**Fundamental Analysis:**
Shriram Finance, a leading NBFC in India, specializes in vehicle and MSME financing. Strong loan growth, improving asset quality, and steady NIMs support its fundamentals. However, risks include higher NPAs in the commercial vehicle segment and rising interest rates impacting borrowing costs.
**Technical Analysis:**
The stock is consolidating near ₹2,550 resistance. A breakout could push it toward ₹2,700. Strong support is at ₹2,400; a breakdown may lead to ₹2,250. RSI near 58 suggests moderate bullish momentum.
**Key Levels:**
- **Resistance:** ₹2,550 / ₹2,700
- **Support:** ₹2,400 / ₹2,250
**Conclusion:**
Shriram Finance remains a fundamentally strong NBFC. A breakout above ₹2,550 could drive further upside, while support levels offer potential buy zones. 📈🚀

Nifty 50 - Potential Deep Correction AheadAfter analyzing the current structure of the Nifty 50 index, I believe we're looking at a potential deeper correction in the market. The larger downtrend has been playing out with Wave A completing at 23,263.15. We're now in Wave C, and a deeper correction could be expected with Wave C potentially extending further down.
Key points:
Wave 5 might be Wave 3 and could indicate a bigger correction.
Wave C could target 21,292.70, with further downside potential.
The Max retracement for Wave 4 suggests a corrective rally without violating the start of Wave 1.
Fibonacci extension indicates a deeper retracement, possibly extending beyond the 1.618 level.
I believe there's a strong chance the market might head lower, and this could mark the start of a bigger trend reversal.
Would love to hear your thoughts and if others are seeing a similar pattern! Let's see how this unfolds.
Chart Details:
Timeframe: 4-Hour Chart
Indicators: Fibonacci retracements, wave counting
Key Levels:
Target for Wave C: 21,292.70 or lower
Max retracement for Wave 4: 22,720.30
1.618 extension: Lower levels are anticipated.

what Next in Gold
✅ Bearish Structure:
Price is in a clear downtrend, forming lower highs and lower lows on both 15-minute and 1-hour charts.
A descending trendline is acting as resistance.
✅ Order Block (OB) Rejection:
The price recently tapped into an order block near $2,882.439 and got rejected, confirming seller dominance.
This suggests that any retracement to this area could provide a potential short opportunity.
✅ Key Support & Resistance Levels:
Resistance:
$2,904.610 (Major Resistance) – A strong level where price previously reversed.
$2,882.439 (Order Block Resistance) – Key level where sellers stepped in.
Support:
$2,864.908 – Immediate support; a breakdown could lead to further decline.
$2,851.502 – Next key support level.
$2,833.971 – Major support zone where buyers may step in.
✅ Potential Trade Setups:
📉 Bearish Scenario:
If price rejects from the order block ($2,882 area) or the trendline, a short position could be considered targeting $2,864 - $2,851.
A break below $2,864 could accelerate selling pressure toward $2,833.
📈 Bullish Scenario:
A break and close above $2,882 could invalidate the bearish setup and push price towards $2,904, where major resistance lies.
📉 Bearish Setup (Short Trade)
🔹 Entry: $2,880 - $2,882 (Order Block & Trendline Resistance)
🔹 Stop-Loss (SL): $2,887 (Above the order block to avoid stop hunts)
🔹 Take-Profit (TP) Targets:
TP1: $2,864 (First support level)
TP2: $2,851 (Next key support)
TP3: $2,834 (Major support zone)
🔹 Risk-Reward Ratio (RRR): At least 1:3+ (Good setup if price rejects the OB)
✅ Confirmation:
Look for a rejection candle (like a bearish engulfing or pin bar) before entering.
If price closes above $2,887, exit short trades as it may flip bullish.
📈 Bullish Setup (Long Trade - If Structure Breaks)
🔹 Entry: Break & Retest of $2,882 (If price holds above this level)
🔹 Stop-Loss (SL): $2,875 (Below breakout zone to manage risk)
🔹 Take-Profit (TP) Targets:
TP1: $2,895
TP2: $2,904 (Major resistance)
🔹 Risk-Reward Ratio (RRR): 1:2 or higher
✅ Confirmation:
Wait for price to close above $2,882 on the 15M or 1H timeframe before entering.
If price gets rejected at $2,882, avoid longs and favor shorts.
Final Thoughts:
🚨 Gold remains bearish unless it breaks above $2,882 - $2,904.
📉 Sellers are in control below the order block, and a rejection from this zone may continue the downward move.
📊 Traders should watch price action at key support levels ($2,864 & $2,851) for possible reactions.
👉 Always follow TP/SL to protect your capital and maximize profits!
Stay tuned for updates once the confirmations are in place!
Please support me with your likes and comments to motivate me to share more analysis with you and share your opinion about the possible trend of this chart with me !
📢Best Regards , Silver Wolf Traders Community
Disclaimer: This is for educational purposes only.
Always trade responsibly and manage your risk effectively

#CHOLAFIN - VCP / C&H BO in DTF📊 Script: CHOLAFIN
Key highlights: 💡⚡
📈 VCP in DTF
📈 BO with Volume
📈 MACD gave a Bounce
📈 Price consolidated for 85Days
📈 One can go for Swing Trade
⚠️ Over All Market condition is bad, Practice paper trading
🟢 If you have any questions regarding the setup, please feel free to leave your inquiries in the comments, and I will respond promptly.
BUY ONLY ABOVE 1435 DCB
⏱️ C.M.P 📑💰- 1433
🟢 Target 🎯🏆 – 6%
⚠️ Stoploss ☠️🚫 – 2.90%
⚠️ Important: Always Exit the trade before any Event.
⚠️ Important: Always maintain your Risk & Reward Ratio.
✅#Boost, #Like & #Follow to never miss a new idea! ✅
Disclaimer: I am not SEBI Registered Advisor. My posts are purely for training and educational purposes.
Eat🍜 Sleep😴 TradingView📈 Repeat 🔁
Happy learning with MMT. Cheers!🥂

SRF - BREAKOUT TRADE OPPORTUNITYSymbol - SRF
CMP - 2750
SRF Limited, a diversified global player, operates in segments like chemicals, textiles, packaging films, and fluorochemicals. The company is a leader in its respective industries, offering products across industries ranging from automotive to pharmaceuticals. With a strong presence in both domestic and international markets, SRF has built a reputation for delivering innovation and sustainable solutions.
SRF stock has recently broken out of a significant resistance zone that had held for the last 3.5 years, signaling a potential shift in its price action. This breakout is a critical technical event, as it suggests that the stock may now enter a new phase of upward momentum, having overcome a major hurdle. Currently, the stock is in the process of retesting this breakout zone, which is a natural price action behavior that presents an attractive entry point for long positions. The stock is now trading at around 2750, providing a solid opportunity for investors who are looking for a favorable risk to reward setup.
Looking at the broader technical picture, the target for this breakout is 3500, which aligns with past resistance levels and technical projections. Given the strength of the breakout and the current retest of the breakout zone, this suggests that the stock could head toward the target level over the medium term. The stop loss for this trade can be placed at 2500, which provides a reasonable cushion in case the price action reverses.
From a fundamental perspective, SRF's consistent performance across its diverse business segments, strong market positioning, and impressive growth outlook support the case for a potential long-term bullish trend. The company’s fundamentals, coupled with this technical breakout, provide a solid base for investors to initiate long positions at these levels.
In conclusion, SRF’s recent price action and technical breakout suggest a promising opportunity for medium to long term investors. The stock offers a favorable risk to reward ratio at its current price level, and the target of 3500 looks achievable over the medium term. The downside risk appears manageable, with the stop loss placed at 2500
Disclaimer - Do not consider this as a buy/sell recommendation. I'm sharing my analysis & my trading position. You can track it for educational purposes. Thanks!

Gold Hot Streak: What’s Next This Week?The price has been climbing steadily, breaking through multiple levels, and it looks like it’s riding an ascending trendline on H4 (that green line sloping upward).
However, around February 11,14 and 21st, there’s a noticeable pullback or consolidation phase, with the price forming a small range before shooting up again. This suggests buyers stepped in at a key support area, pushing the price higher.
As of today, February 24, 2025, gold is looking pretty strong again, but we’re at a critical juncture. The price is sitting just above the daily open at 2940, still trading under PWH which is Immediate resistance,. Here’s what I think could play out this week:
If Bulls Stay in Control: If the price holds above 2940 and breaks R1 (2967.882), we could see a strong move toward 3000 (R2).
If Bears Step In: If the price fails to hold above 2940 and drops below the ascending trendline (around 2940 or under Weekly Pivot P, Watch Price action at Pivot P for this week ), we might see a pullback to S1 (2,891) or even deeper to S2 (2847). The recent overextension after the big move up could attract sellers looking to take profits or short the market.
I was expecting a pullback from Last week, and chances of pullback is still here and gold can re start the bull run within 6-7 Trading day (During this period a consolidation or correction chances are there) Overall gold is still bullish and as discussed in last week posts and I am still holding buy trade on both gold and silver , If Gold pullback and 2900 I will take some percentage of profit from both gold and silver.

Asian Paints cmp 2257.60 by Weekly Chart viewKeep the stock on radar basis Support Zone been tested retested for probable upside breakout movement attempts
Asian Paints cmp 2257.60 by Weekly Chart view
- Support Zone at 2115 to 2210 Price Band
- Gap Down Opening of 11-Nov-2025 will get a closure only on next upside
- Weekly Support at 2115 > 1930 > 1685 with Resistance seen at 2430 > 2665 > 2855
- Stock has been trading within 2560 to ATH 3590 price band for 4+ years, unable to break this range
- The stock has broken down from the price range but is attempting to reverse from the Support Zone
- Volumes were more on Selling side indicative of consistent weakness for the stock but taking some stable ground around Support Zone by Weekly Chart

Senores Pharma: Cup & Handle - Ready for Some Action?NSE:SENORES
Senores Pharma is forming a potential cup and handle on the daily timeframe. A breakout attempt on Feb 6, 2025, failed to sustain above ₹607.35 as selling pressure came in second half.
Now, the cup and handle pattern is progressing, making next week crucial. A close above ₹607.35 is the key level to watch for confirmation.
Volumes are rising, with today's volume (Feb 21, 2025) nearly 5x yesterday's. The stock's resilience despite market pressure indicates strength.
Cup and Handle pattern usually don't disappoint so would be interesting to watch.
Senores Pharmaceuticals is a research-driven company focused on developing specialty pharmaceutical products for regulated markets. The company has shown impressive financial performance:
Recent Financials (Q3 FY25):
Net Sales: ₹106.4 crore (up 35% YoY from ₹78.7 crore in Q3 FY24)
QoQ Performance: Increased from ₹104.4 crore in Q2 FY25 (up 1.92%)
EBITDA: ₹29.1 crore (up 92% YoY)
PAT: ₹17.2 crore (up 142% YoY from ₹7.1 crore in Q3 FY24)
9MFY25 Performance:
Total Revenue: ₹288.1 crore (up 157% YoY from ₹112.1 crore in 9MFY24)
PAT: ₹40.7 crore (up 162% YoY)
Market Position : The stock has outperformed its sector and the broader Sensex, achieving consecutive gains over the past month and trading above multiple moving averages.
Future Projections : Management anticipates a top-line growth of 50%-60% for FY26, with plans to launch five new products in the current quarter.
Strategic Focus : Continued investment in R&D and infrastructure development is expected to enhance manufacturing capabilities and expand product offerings.

Japan 225 Index key date and expectations tomorrow + 3 daysJapan 225 index has been in sideways move from oct 2024 onwards. On a daily chart, 19th Feb 25 is a key date and another on 25th Feb 2025. In between there are 2 trading days, 20th and 21st. So we expect market to move up from tomorrow till 25th Feb. Possibly on 25th Index may gap up and come down or will make a lower low day close.
Key dates : 19th ( today) and 25th ( after 2 trading days from today )
Expectation : we expect market to move up

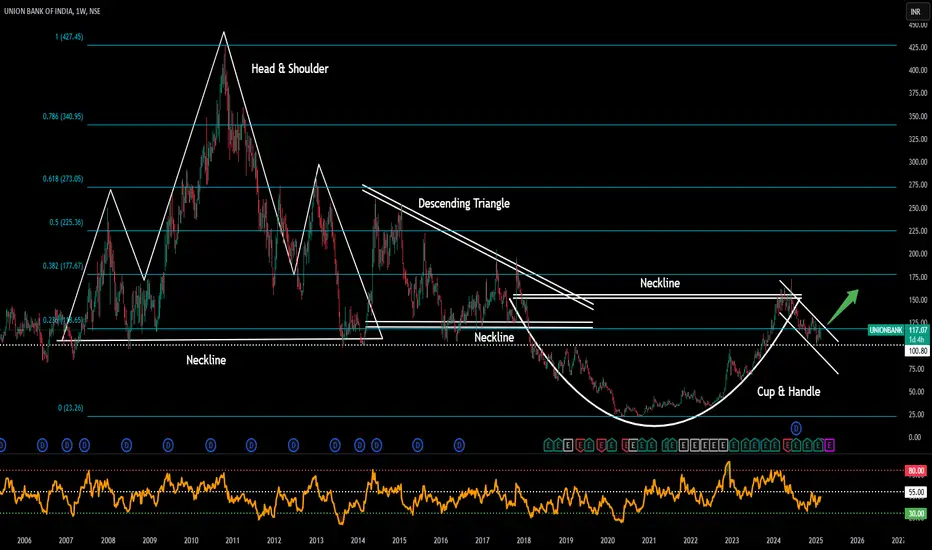
Union Bank Date 20.02.2025
Union Bank (Weekly)
Cmp 117.24
Technical Remarks :
1 Buy on breakout of handle + 23.6% of Fibonacci
2 100 is decent stoploss for swing traders & investors after breakout entry
3 Keep booking partial profits after every 3% rally from breakout
4 Wait for stock to close above handle on weekly basis
Fundamental Remarks :
Strengths
1 Company has a good Return on Equity (ROE) track record: 3 Years ROE 12.42%.
2 Good Capital Adequacy Ratio of 16.97%.
3The company has delivered good Profit growth of 67.47% over the past 3 years.
Limitations
1 The bank has a very low ROA track record. Average ROA of 3 years is 0.72%
2 CASA Growth of -1.68% YoY, which is very low.
3 High Cost to income ratio of 46.42%.
Regards,
Ankur
Bank nifty trades and targets for - 19/2/25Hello Everyone. The market was in a very tight range the previous day. Let the resistance or support range break with 15-minute candle before going for any trades. If we do trades in between these zones premium eating will happen and we end up seeing losses. Book profits every 100 points as we are getting very few trending moves. If the market opens flat then we can see continuation of trend. If it opens gap up then we need to see the resistance level to break before looking for CE trades. If it opens gap down then look for PE trades after support zone is broken. Let the market settle in first 15 to 30 minutes then look for directional trades.

ADANIENT Trade Setup | Educational Analysis Only📢 Disclaimer:
This analysis is purely for educational purposes and not a recommendation to buy or sell. I share these ideas to help others learn; you should always do your own analysis before making any trading decisions. 📊✅
📌 Market Overview & Trade Idea
ADANIENT is seeing a potential reversal zone forming. Based on technical analysis:
we can see a perfect ellipse has formed
✔️ Support Zone Identified – The price has reached a key level where it may reverse.
✔️ Potential Targets:
50% Target: ₹2,540.35
Final Target: ₹2,818.45
If the price respects the reversal zone, an uptrend might follow toward the targets. However, if it breaks below support, further downside is possible.
🔍 Find Your Own Entry Strategy!
To maximize confidence in a trade, look for strong candlestick confirmation before entering. For me, a strong hammer candle with a long wick and shadow would be a reliable sign of a reversal. 📉➡️📈
💬 What’s your favorite entry confirmation? Drop your thoughts in the comments! ⬇️

ONGC - Did You Get Trapped in an Irregular Flat? – Elliott Wave I Told You So… The Market Whispers! Can You Hear Them?
Back in April 2024, I warned you to be careful as the stock approached key resistance at 314, forming a Bearish Bat pattern with a Potential Reversal Zone (PRZ) between 300-275. The stock topped at 287, right at the edge of invalidation.
Yet, if you got convinced of the rally above 300, then unfortunately, no one can help—but I did my job of warning you months in advance.
This reminds me of BHEL, the stock we discussed a few days back.
Let us talk about ONGC.
The Irregular Flat structure caught many off guard. Did you get trapped? Because if the current wave unfolds impulsively, which it just started from the highs of 345, then welcome to reality!
Warning Through Last Idea in April 2024
As shown in the chart snapshot, how Irregular Flats look has been illustrated next to the price chart. I have depicted the irregular path of flats that could unfold.
This is how markets deceive, creating irregular structures that mislead traders. Elliott Wave calls this pattern an Irregular Flat—a trap that looks bullish before a sharp reversal wipes out weak hands.
The Lesson?
Patterns speak… if you listen carefully.
I shared my insights long before the structure unfolded—and yet, if you got trapped, you now know why.
Catch me later with another exciting idea of WaveTalks, Market Whispers! Can you hear them?
Disclaimer:
Trading in financial markets involves substantial risks. Consult your financial advisor before making decisions. This commentary is not a solicitation to buy or sell.

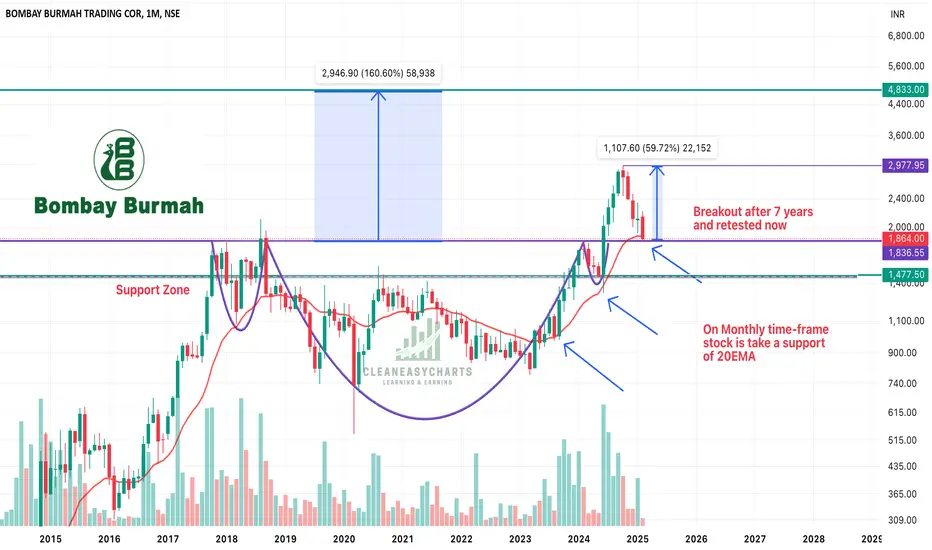
Bombay Burmah Trading Corp - Head & Shoulder Pattern & Retest!!Bombay Burmah had given breakout of Head & Shoulder pattern and now has entered retest zone on a monthly time frame. It is looking good and can move towards our targets as mentioned in the chart. Other factors:
1. Monthly Time frame set-up : Head & Shoulder Patter breakout and retest on a larger time frame is much stronger set-up. On a smaller time frame it can come down till support level given market conditions.
2. Stock price is taking EMA 20 as a support on MTF
3. Holds 50% in one of the largest FMCG Co. Britannia - FMCG sector should revive and should give tailwinds to this stock.
4. Hold many dimensional business and EPS is increasing on a YoY basis
Keep this stock in your radar!! Keep following @Cleaneasycharts as we provide Right Stock at Right Time at Right Price !!
Cheers!!!
NIFTY analysis based on Elliott Wave theoryNIFTY is looking like in wave (Z).
Now, wave (Z) is always in 3 moves (ABC).
If we take a look in 75 min chart of NIFTY, we may see wave (a) of wave (Z) finished on 12 Feb. The price is in wave B of wave (b) now.
It looks like Zig-zag pattern is forming and it is observed most of the times that, Wave B of Zig-zag takes at least equal time of wave A.
So we may assume that, wave (b) of Zig-zag will finish at least by 19 Feb near 50% to 61.8% And then we may expect a fall to form wave (c) of Zig-zag.
This analysis is based on Elliott Wave theory and Fibonacci.
This analysis is for educational purpose only.
