Breakout soon in Supreme Industries Supreme Industries – Cup & Handle Breakout Setup 🚀
Pattern: Cup & Handle formation nearing breakout
RSI: Above 65 and rising → momentum building
Trend: Price holding strong above EMA50
Volume: Steadily increasing
Enter after confirmation
Disc: For study, not a recommendation. DYOR
Community ideas

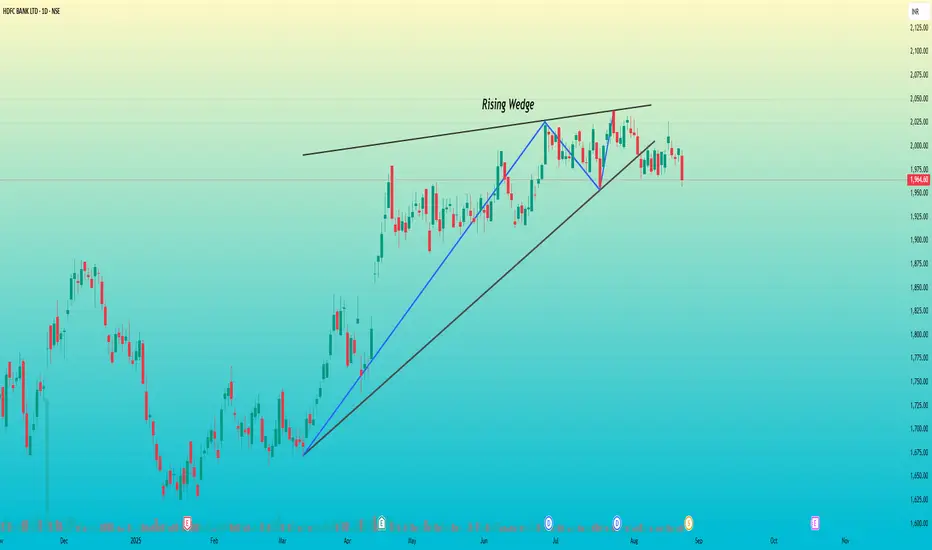
HDFC Bank – Rising Wedge Breakdown Signals Bearish Outlook📊 HDFC Bank Ltd – Daily Chart Analysis
🔹 Pattern Formation
A Rising Wedge pattern has developed on the daily timeframe.
The stock was in a strong uptrend since March, consistently forming higher highs and higher lows.
However, in recent weeks, the price struggled to sustain above the ₹2,025 – ₹2,050 zone, showing signs of exhaustion.
The wedge support has now been broken, with price closing near ₹1,964, confirming weakness.
Noticeable selling volume is accompanying the breakdown, strengthening the bearish case.
Lack of strong buying activity suggests buyers are losing control.
🔹 Key Levels to Watch
Immediate Resistance: ₹2,000 – ₹2,025 (any move above this will invalidate the bearish view).
Immediate Support: ₹1,950-55 (already tested, may break further).
Next Downside Levels: ₹1,925 → ₹1,900 → ₹1,875.
🔹 Trade Plan
📉 Short Bias: Below ₹1,975 with SL above ₹2,025.
🎯 Targets: ₹1,925 / ₹1,900 / ₹1,875.
📈 Invalidation: If price closes above ₹2,025 with strength, wedge breakdown fails and bullish trend may continue.
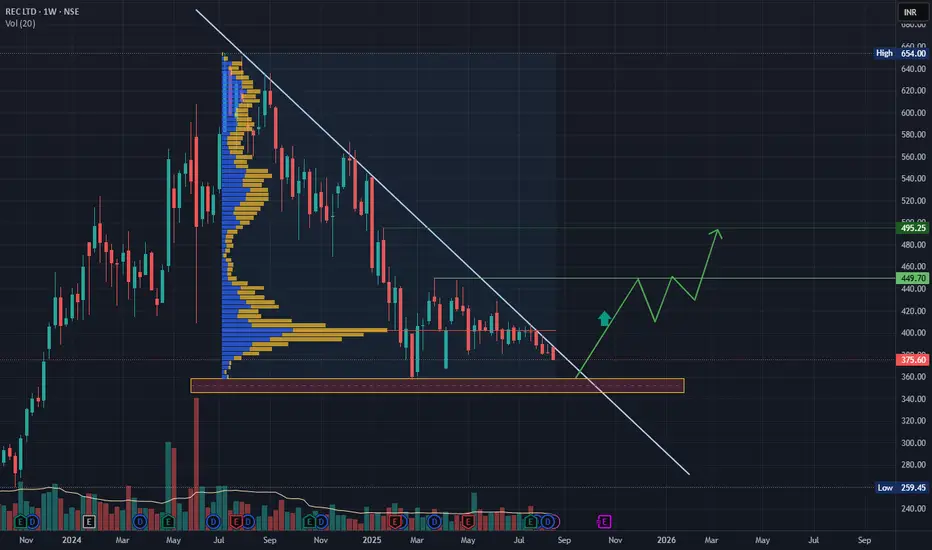
RECLTD Technical analysisRECLTD has declined approximately 40% and entered a consolidation phase since February 2025.
Based on my analysis, the stock may dip to around ₹357 before potentially reversing. However, if it closes above ₹400 with strong volume and sustains that level, it could signal a buying opportunity.
Target levels:
First target: ₹490
Second target: ₹560
Expected timeframe: By February/March 2026.
let see....
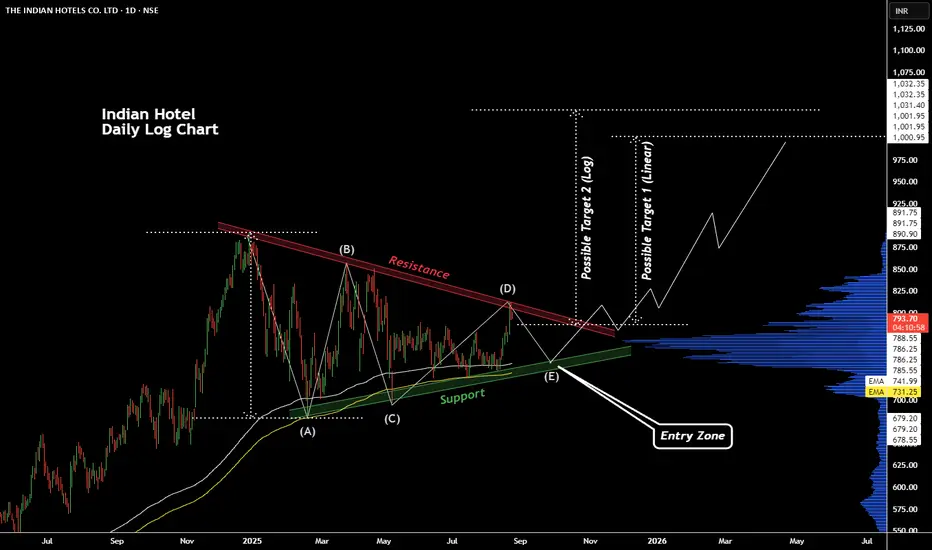
Trend continuation Pattern Observed in Indian Hotel StockTata Group's Indian Hotel Company's stock is moving sideways and forming Symmetrical Triangle (a trend continuation pattern). Presently near a resistance but the range of 740 to 730 can be a good support as we can see pattern boundaries, EMA supports and high volume activity in the same zone.
Cochin Shipyard LtdDate 21.08.2025
Cochin Shipyard
Timeframe : Day Chart
Company Overview
(1) Into shipbuilding (Defence, Commercial & Offshore), Ship repair, Marine Engineering Training and Strategic & Advanced Solutions.
(2) It has built and delivered 21 large vessels, 35 offshore support vessels, 93 small & medium vessels and 31 defence vessels
(3) Company is working on Zero emission Green Vessels including H2 Fuel Cell Vessel
Business Segment
(1) Ship Building 72%
(2) Ship Repair 28%
Order Book
(1) Order book stood at 21500 Cr
(2) 52% of the order book is for Green Vessels
The breakup of book is-
(1) Defense- 16064 Cr (78%)
(2) Commercial Domestic- 1260 Cr (6%)
(3) Commercial Export- 2668 Cr (13%)
(4) Subsidiaries- 696 Cr (3%)
(5) Ship Repair orders worth Rs 700 Cr
(6) The order pipeline stood at 9000 Cr
Capacity
(1) It has infrastructure that construct ships weighing up to 1.1 lakhs DWT as well as repair of ships weighing up to 1.25 lakhs DWT
(2) Located in Kochi, Kerala. Apart from this it has ship repair facilities in Mumbai, Kolkata, Andaman & Nicobar , Udupi and Howrah
Capacity Expansion
(1) International Ship Repair Facility (ISRF) costing Rs. 970 Cr with capacity of 6000T
(2) New Dry Dock costing Rs. 1799 Cr with capacity up to 70,000T
Valuations
(1) Market Cap = ₹ 44,900 Cr
(2) Stock P/E = 52.8
(3) ROCE = 20.1 %
(4) ROE = 15.8 %
(5) Book Value = 8X
(6) OPM = 20%
(7) Sales Growth = 22%
(8) Promoters = 68%
(9) DII = 6.33%
(10) FII = 3.87%
Regards,
Ankur

LIC (Life Insurance Corp of India) – At a Critical Support ZonePrice has pulled back into a strong demand zone, which has acted as a base since the early structure. If this zone holds, we could be looking at the start of Wave 5 thrust, with potential to retest recent highs near 980 and beyond.
The RSI is holding higher lows , suggesting underlying strength despite the correction.
However, risk management is key:
If 874 support fails, then Wave 4 might not be complete yet, and price could slide further to retest the long-term trendline support (currently aligned near 760).
The bullish invalidation for this count sits below 760.
So, the playbook is simple:
Above 874 → bias for Wave 5 continuation.
Below 874 → extended Wave 4 correction toward trendline.
Disclaimer: This analysis is for educational purposes only and does not constitute investment advice. Always do your own research (DYOR) before making trading decisions.

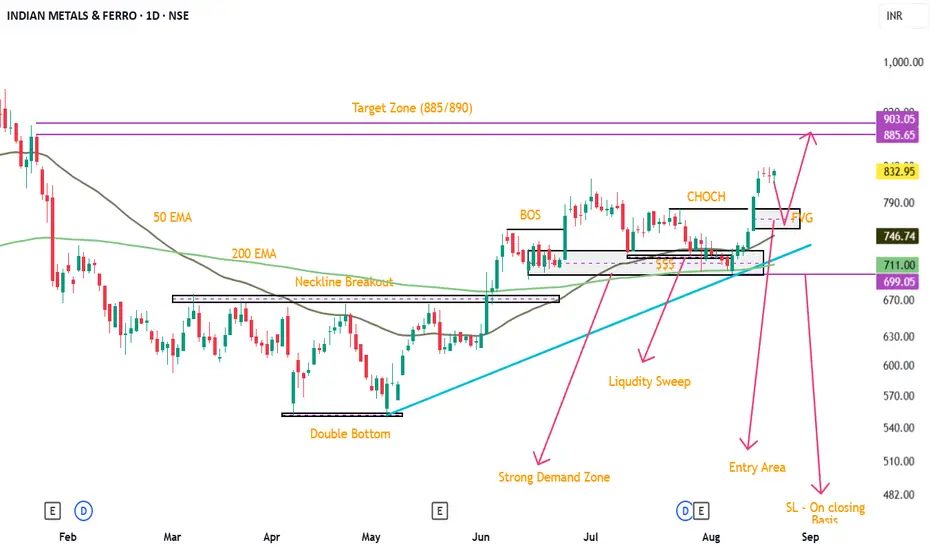
Suggest to buy for the target of 885/890.Technical Analysis :
Strategy : Price Action with SMC
Type of Trade : Swing Trading
Time Frame : Daily
=> The downtrend end is observed by Double Bottom
=> The trend reversal (uptrend) is confirmed by broken the Neckline (Previous LHs). Moreover, the 50 EMA is greater than 200 EMA.
=> In an Uptrend, identified the Strong Demand Zone
=> Demand Zone mitigation also done with Liquidity Sweep. In addition, the price is bounced from the 200EMA
=> After Liquidity Sweep, I expect that the price is reversed to reach the target zone by forming CHOCH
=> So, I expect that the price is trying to reach the Target after collecting the pending orders at the FVG area. Therefore, I marked the entry level zone @ FVG (765/770)
=> SL (700) is the recent swing low on closing basis, which is also marked.
Based on the above analysis on the daily time frame, suggest to buy for the target of 885/890.
== EDUCATIONAL PURPOSE ONLY ==
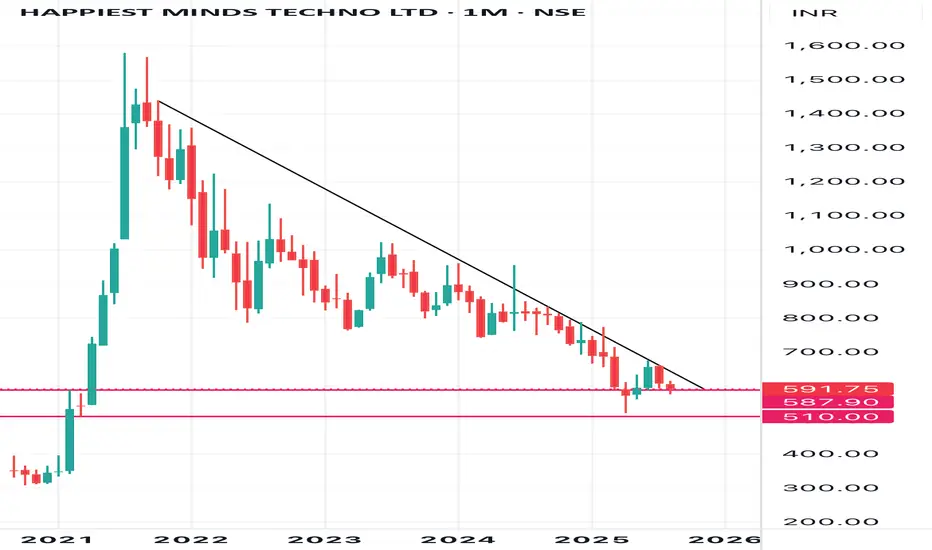
Happiest Minds: Charting a Course Through Digital TransformationThis is not just another stock; it's an opportunity to invest in the future of technology. Happiest Minds is on the front lines of the digital revolution, turning complex tech into seamless solutions for businesses worldwide.
Technical Analysis
The provided monthly chart shows that the stock is currently in a downward trend. The price has been following a well-defined downward trend line since its peak. However, it is now at a crucial level, having reached and reacted from a key monthly demand zone (support level). A sustained bounce from this level, coupled with a potential breakout above the downward trend line, could signal a reversal in the short-term trend.
Investment Highlights (The Bull Case)
* Pioneering Digital-First Model: The company’s core business is focused on next-gen services like Cloud, IoT, and Cybersecurity, making it a pure-play in the digital transformation space. This model positions it for long-term growth as enterprises continue to increase their digital spending.
* Strategic Focus on AI: Happiest Minds has proactively established a dedicated Generative AI Business Unit. This forward-looking approach positions it to capture a share of the rapidly growing AI services market, which is a key growth driver for the entire IT sector.
* Experienced Management & Clear Vision: Led by a seasoned management team, the company has a well-defined strategic roadmap, including a stated goal of reaching $1 billion in revenue by 2031. This provides a clear, long-term growth narrative for investors.
Key Risks & Concerns (The Bear Case)
* Growth and Margin Headwinds: Recent financial results indicate a sequential slowdown in growth and pressure on profitability. If the company fails to reverse this trend, its high valuation becomes difficult to justify.
* Premium Valuation: Despite the recent stock correction, the company continues to command a premium valuation compared to its peers. Its high P/E ratio implies significant future growth is already priced in, leaving little margin for error.
* Macroeconomic Environment: The broader IT services sector is facing a cautious global spending environment. This can impact new deal wins and client spending, posing a direct risk to Happiest Minds’ ability to secure future growth.
Conclusion
Happiest Minds stands at a pivotal point. While the company's long-term fundamental story remains compelling, a cautious stance is warranted due to near-term business headwinds and a demanding valuation. For those with a higher risk tolerance, the stock’s current position at a critical technical support level presents a potential short-term opportunity for a well-managed swing trade.
INFY Bullish Setup** IF you like my observation, please boost and follow for more content."
Ticker: INFY
Time Frame: 1-Hour
Trade Type: Bullish
Entry Point: 1486.20
Target Price (TP): 1589.15
Stop Loss (SL): 1417.45
Risk-to-Reward Ratio (RRR): 1:1.5
Trade Setup and Rationale:
Market Context:
INFY has been showing signs of recovery, breaking out of a corrective phase. The price is currently positioned for a potential uptrend, supported by a significant bullish pattern forming on the chart.
Entry Point (1486.20):
The price has recently tested a support zone and is now showing signs of a strong reversal. The entry point is set just above this level, ensuring a confirmation of the bullish trend before committing to the trade.
Target Price (1589.15):
The target is set at a key resistance level where price is expected to face potential selling pressure. This level aligns with previous highs and is a reasonable place to lock in profits while riding the trend.
Stop Loss (1417.45):
The stop loss is placed just below the recent swing low, ensuring that the trade has a controlled risk. This placement minimizes the risk of getting stopped out in case of minor fluctuations while keeping the risk-to-reward ratio favorable.
Trade Logic:
The trade is supported by a bullish breakout pattern with increasing volume. After a period of consolidation, price action is showing signs of upward momentum, making this a high-probability trade setup.
The risk-to-reward ratio of 1:1.5 offers a balanced risk for the potential reward, providing a good trading opportunity with a well-placed stop loss.
Volume Confirmation:
Volume is showing a steady increase as the price starts moving upward, indicating that market participants are supporting the bullish move.
Trend Confirmation:
The trend is confirmed by the price breaking above previous resistance, and the bullish setup aligns with the market structure.

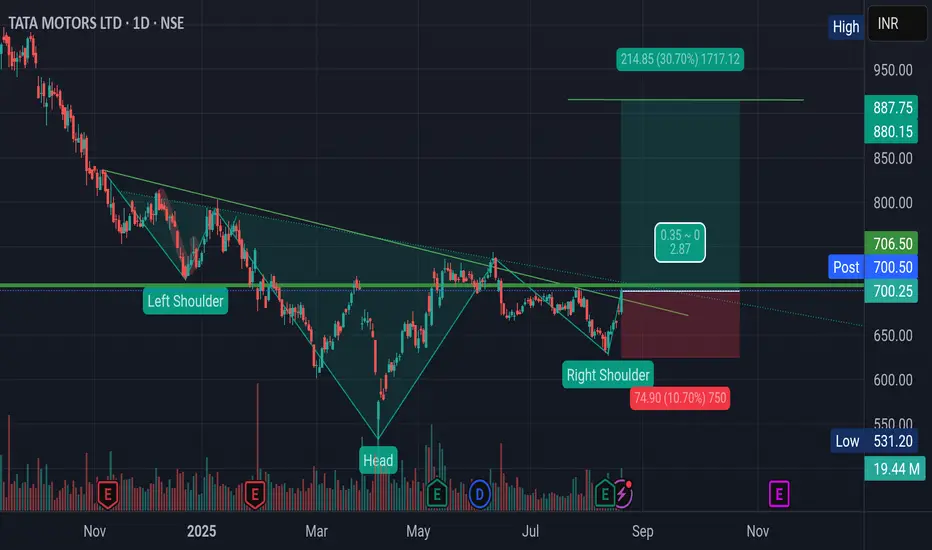
Inverted H&S Breakout in Tata MotorsMotor and electric Vehicle giant Tata Motors has given Breakout from Inverted Head and Shoulder pattern with good volume.
Once the price sustains and closes above Rs. 707. The stock should rally to its target of Rs. 880
One Should remain positive till price breaches and sustains below right Shoulder of the pattern.
The possibility of positive movement is fueled by the recent GST rate Cut possibility announced by PM modi. 👌
Also, there is positive news about fulfillment of Rare Earth Metals (very essential in EV vehicles) from China.😱
Note: This analysis is for Educational Purpose Only. Please invest after consulting a professional financial advisor.
ADANIGREEN big profits no price growth, can it 2x-3x in 5years??Company has delivered good profit growth of 106% CAGR over last 5 years
Debtor days have improved from 68.9 to 50.1 days.
Promoter holding has increased by 0.97% over last quarter.
company has been posting big profits in the recent past
Market Cap ₹ 1,52,842 Cr.
Stock P/E 82.3
ROCE 8.70 %
ROE 14.6 %
looks like a decent movement can happen above 1100 range
and lets look for a volume expansion
high probable if it breaks these levels this quarter!
this is a likely longterm play

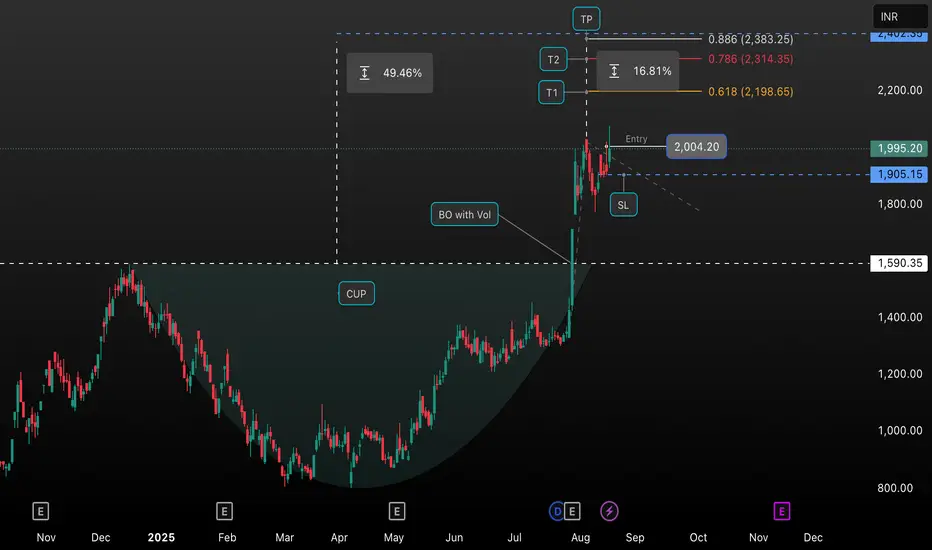
Cup and Handle Breakout Trade Setup on HIRECT (Daily Chart)This chart illustrates a classic “Cup and Handle” breakout pattern on HIRECT, identified on the daily time frame. After forming a well-defined cup, the stock witnessed a significant breakout with increased volume (“BO with Vol”), signaling strong bullish momentum. Entry was triggered at ₹2,004.20, just above the handle resistance, with a suggested stop-loss (SL) below the breakout level at approximately ₹1,905.15.
The chart highlights multiple target zones (T1, T2, TP), based on Fibonacci extension levels and price action analysis:
• T1: 2,198.65 (61.8% Fibonacci extension)
• T2: 2,314.35 (78.6% extension)
• TP (Target Point): 2,383.25 (88.6% extension)
The setup indicates a potential upside move of about 49.46% from the cup base to the target point. To manage risk, the stop loss is set below breakout support. This setup is ideal for traders seeking a high-probability entry following a technical breakout pattern in a trending stock.
MANAPPURAM FINANCE LTDMANAPPURAM – The stock has been in a strong uptrend channel, after hitting 285, it corrected and formed a falling wedge. Now it’s attempting a breakout above the wedge.
Buy above 270 with the targets of 285 and 300 | Stop loss 260

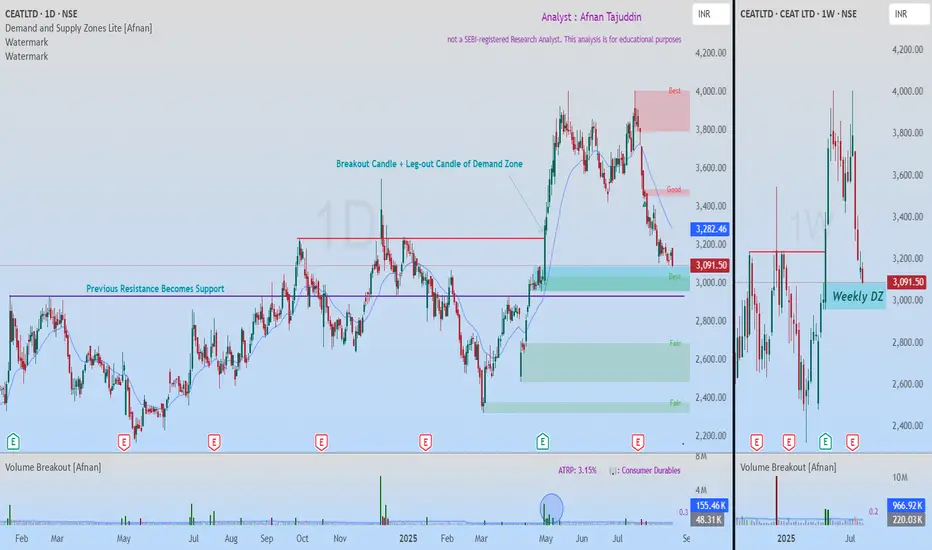
Smart Money Footprint Visible: Ceat Testing Powerful Demand ZoneBack on 24th July , I shared an idea on Ceat. That call didn’t play out and the Stop Loss (SL) got hit . No surprises there—SLs are simply the cost of doing business in this market. hitting SL is part of trading . The key is discipline – once SL is hit, we must exit without hesitation.
Now, Ceat seems to be offering us another opportunity . Let’s break it down.
📊 Why This Demand Zone Stands Out
The stock is approaching a very strong demand zone visible clearly on the weekly & Daily timeframe .
The leg-out candle that created this demand zone was powerful – it broke past previous resistance with a strong bullish move .
Follow-through from that breakout candle even took the stock to all-time highs . This tells us it’s not just an ordinary zone but one with institutional footprints.
Institutions often leave behind pending buy orders in such zones, or they may look to accumulate more here to defend their earlier positions.
This level first acted as resistance , then flipped into support —a classic price-action rotation.
📉 Volume Behavior 📉
On the breakout candle, volume was massive. But now, as price is pulling back, we can see volume exhaustion . To me, that signals a lack of real selling pressure. When supply dries up, it leaves the door open for demand to kick back in.
🔎 Confluences Adding Strength 🔎
Weekly demand zone lining up with a daily demand zone .
Traditional support level overlapping at the same price area.
Volume analysis confirming lack of strong selling.
🎯 Trading Plan 🎯
SL should be placed just below the support level to manage risk.
First target should be the nearest supply zone .
Till first target, the Risk-to-Reward (RR) ratio is about 1:3 , which makes it attractive.
If SL gets hit, simply exit the trade . No second thoughts.
What I find compelling here is the overlap: weekly demand, daily demand, and a long-tested support line all converging. That kind of alignment doesn’t come around every day. The probability of a bounce looks strong—but at the end of the day, risk management is what separates setups from disasters .
“Trading is not about being right every time. It’s about managing risk smartly and surviving long enough to catch the big moves.”
💡 The market will always offer another opportunity—our job is to stay disciplined, manage risk, and be ready when it comes. 🚀📈
⚠️ This analysis is purely for educational purposes only and is not a trading or investment recommendation . I am not a SEBI registered analyst .
PAYTM ANALYSISFOR LEARNING PURPOSE
PAYTM - The current price of PAYTM is 1151.30 rupees
I am going to buy this stock because of the reasons as follows-
1. It's coming out from a good consolidation base
2. It broke a strong resistance zone of last 3 year and now it's trying to go up
3. It is showing better relative strength as it stood strong in volatile times including last week.
4. The risk and reward is favourable. The good part- All the major bad news move has been recovered
5. The stock is acting as more of a leader in last few months. It has outperformed NIFTY as well as it's Sector
6. The stock did very bad after its IPO. Went down like anything. From its ATH, it went down by more than 84% and then it made a base and now it's trying to come out from that.
I am expecting more from this in coming weeks
I will buy it with minimum target of 35-40% and then will trail after that.
My SL is at 988.25 rupees
I will be managing my risk.

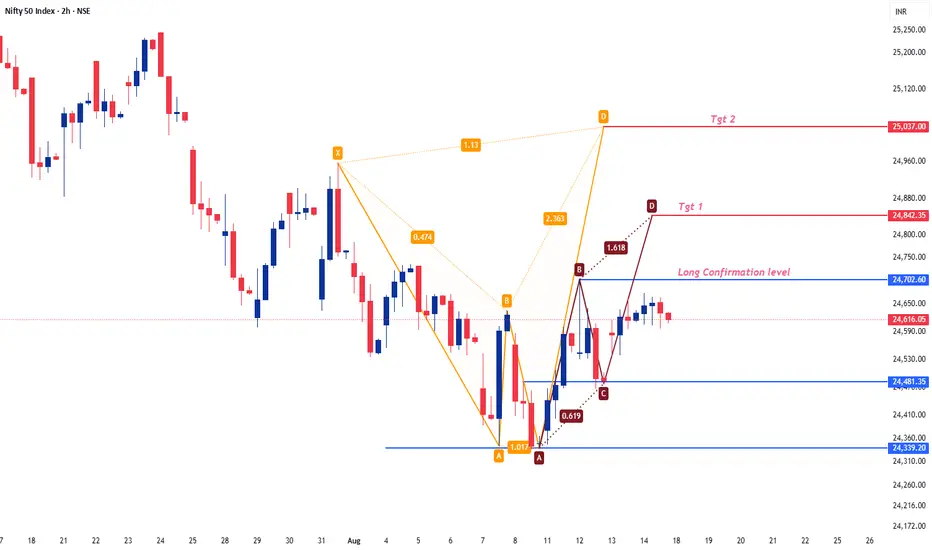
#Nifty Weekly Analysis 18-08-25 to 22-08-25#Nifty Weekly Analysis 18-08-25 to 22-08-25
24500-24700 is sideways Range for next week.
If Nifty sustains above 24700, more upside possible and Targets are 24880/25030.
Short level is below 24600 for the target of 24480/24330.
View: Upside to Sideways Market.
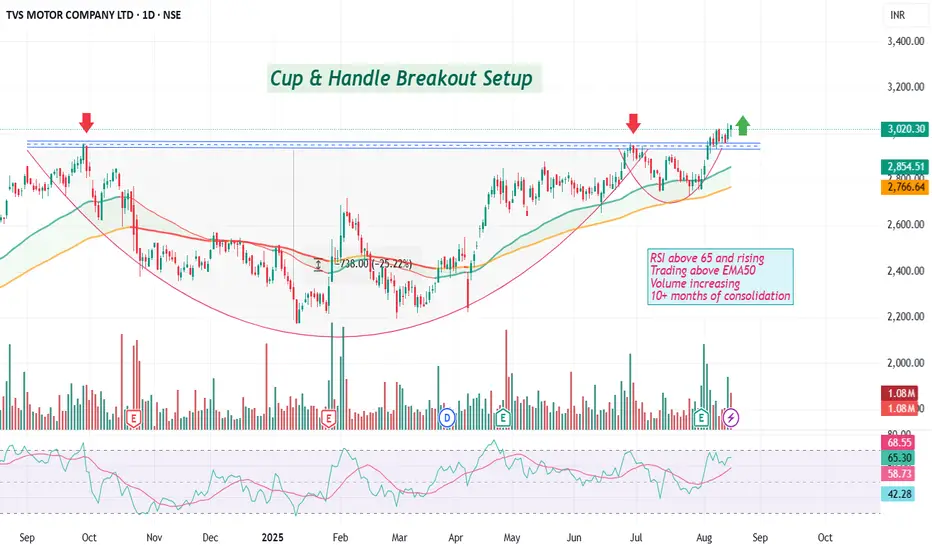
Breakout in TVS Motor CompPattern: Cup & Handle breakout after 10+ months of consolidation
RSI: Above 65 and trending higher → strong momentum
Trend: Price trading above EMA50 and major moving averages
Volume: Picking up, confirming breakout strength
📈 A sustained move above ₹3,000 zone can open the way for the next leg of rally.
Bias: Bullish as long as it holds above breakout level.
Disc: for study, not a recommendation. DYOR
Beautiful Cup & Handle Breakout in Rain IndustriesRain Industries has undergone a Huge consolidation between45-250 price range for 7 long years under a Perfect Cup & Handle pattern formation.
The pattern formed under a larger weekly time frame is a good advantage.
The recent volume spikes attributes to a tendency of break out in near term.
The price action can be followed up in below ways.
1. Becomes active once Weely candle closes above - 200.
2. Stop Loss - Weekly close below 115
3. Target 1 - 250
4. Target 2- 345-350 range
5. Target 3 - 450-455 (This will take more time, so as the price to retest the base of 250 range and pull back to 450).
This information is only for educational purpose, not for any recommendation.

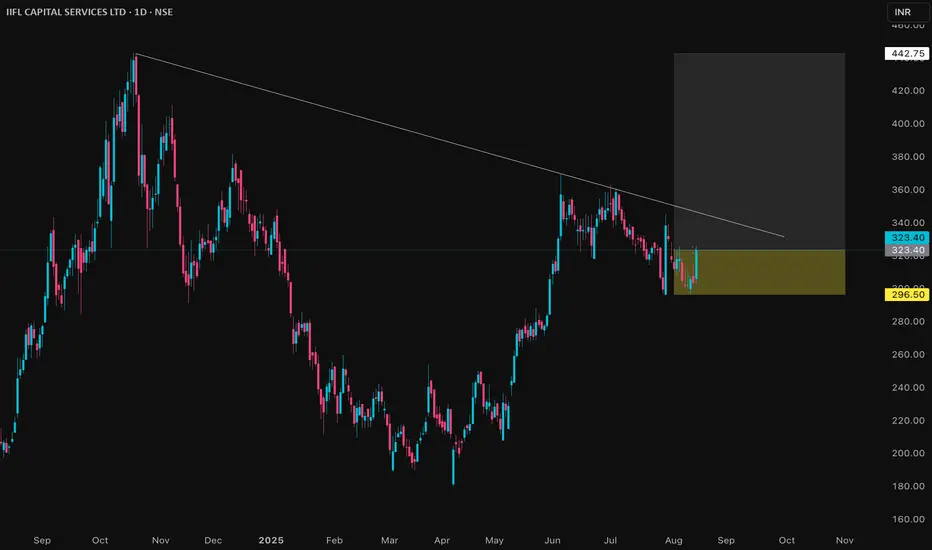
IIFLCAPS Price Action## IIFL Capital Services Ltd – Price Analysis (August 2025)
### Price & Market Metrics
- Current share price is approximately ₹323 as of August 13, 2025.
- Market capitalization is around ₹9,649 crore.
- 52-week price range is ₹170 (low) to ₹449 (high).
- All-time high was ₹449 on October 21, 2024.
- All-time low was ₹19.10 on October 15, 2019.
### Returns & Volatility
- Recent price movement shows some volatility, with the price trading mostly in the range of ₹300–₹330 over August 2025.
- The stock rebounded after hitting lows near ₹170 in April 2025.
- Trading volumes appear moderate with daily volumes in the range of 100,000 to 700,000 shares recently.
### Valuation & Financial Highlights (typical for financial services sector)
- Price/Earnings (P/E) ratio data was not specifically stated but likely moderate given sector norms.
- The company is part of the financial sector, focusing on capital markets and financial services.
### Qualitative Notes
- IIFL Capital has shown resilience after a significant dip in early 2025 and is maintaining a stable trading range.
- The company has a solid market capitalization reflecting its presence in the financial services industry.
- Volatility and price swings are typical of the capital markets sector, influenced by market conditions and investor sentiment.
### Summary
IIFL Capital shares are currently trading well below their all-time highs but have recovered from significant lows earlier in 2025. The stock displays moderate volatility consistent with the financial services sector and recently trades near ₹320. Market capitalization and trading volumes indicate solid investor interest. Valuation appears reasonable for its sector, but investors should watch for market volatility and financial sector dynamics in their decisions.
GOKUL AGRO#GOKULAGRO
Excellent results. Double digit growth with margins expansion.
15% sales growth YoY
32% profit growth YoY
Margins expansion at its peak.
EPS 4.85 vs 3.59
QoQ not comparable coz of consumption trend in business.

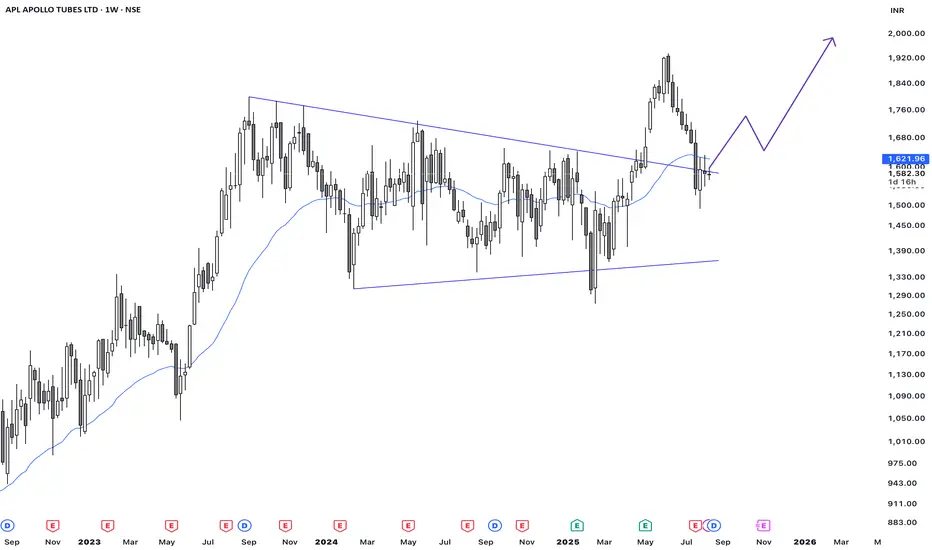
APL Apollo Tubes Ltd – Weekly Chart UpdateAPL Apollo Tubes Ltd – Weekly Chart Update: Breakout from Multi-Period Consolidation
Technical Structure:
The chart clearly shows a long consolidation between early 2023 and mid‑2025, bounded by converging trend lines forming a symmetrical wedge/triangle.
Recently, price decisively broke above the upper trendline, accompanied by a volume spike, signaling a classic bullish breakout scenario. A subsequent retest of the breakout zone (~₹1,580–1,600) appears to be underway—buyers holding this zone could pave the way for a continued rally .
Potential Targets and Setup:
• Entry Zone: Weekly close above 34 week moving average
• SL on entry: 1485
• First target: 1900
• If momentum sustains, keep trailing SL
• Invalidation: SL is hit or any opposing bearish signal on chart
Fundamentals:
• The technical breakout aligns with healthy fundamentals—strong ROCE/ROE and sustained revenue growth.
• Though valuations are rich (P/E ~55x, P/B ~10x), the quality of earnings and performance metrics justify the multiple.
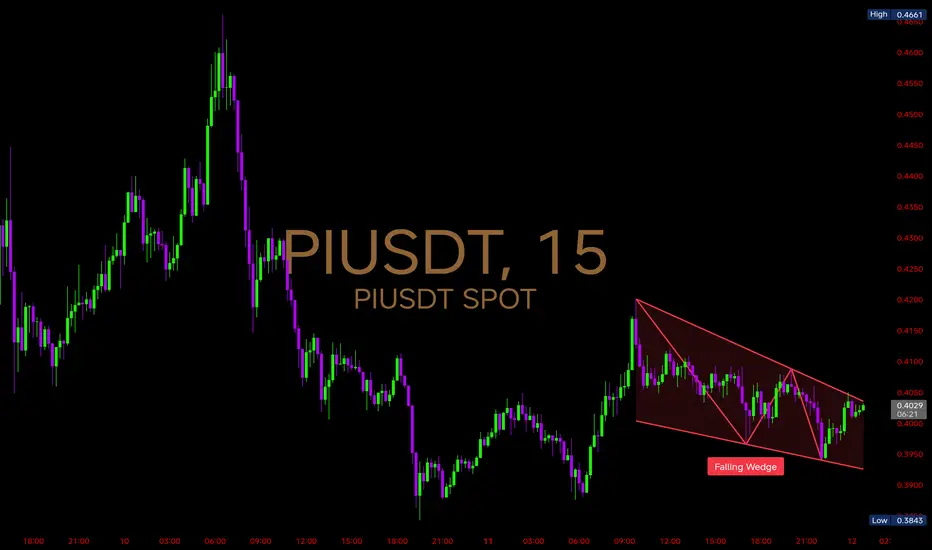
$PI 15mins Chart Analysis NASDAQ:PI 15mins Chart Analysis
Price is currently trading inside a falling wedge — a pattern often seen as a bullish reversal setup when confirmed with a breakout.
🔍 Key Observations:
Price is compressing between lower highs & higher lows within the wedge
Current range: 0.3843 (low) to 0.4050 (upper wedge resistance)
Breakout confirmation would require a close above 0.4100, ideally with volume expansion
Support at 0.3950 remains key for wedge integrity — losing it could delay reversal potential
📈 Probable Scenarios:
Bullish Case: Breakout above 0.4100 triggers short-term relief rally, potentially retesting 0.4200 zone
Bearish Case: Breakdown below 0.3950 could invalidate wedge and resume the corrective leg
This wedge could mark the early signs of seller exhaustion. Watch for breakout confirmation before anticipating stronger upside momentum.
BTC - 12thAug2025 - 4th wave bottom and 5th wave TP - 1248004th wave has fallen more because 2nd wave was also bigger. 4th wave bottom is expected in the zone marked in green where we have W formed support and this area is vital to call the trend is in bull trend and no change of character untill this area holds. my wave count is in line with all analysts so far and if this support is broken then BTC is too much manipulation, This view is shared before important US data so stay cautious in money management. Its good level to buy BTC and hold at least 60% long as its a key technical support area and potential move to new ATH from here with out further down move.
