EPL Ltd (NSE: EPL) – A Multi-Year Breakout in the Making?Pattern: Symmetrical Triangle | Timeframe: Monthly | CMP: ₹208
Potential Target: ₹430+ | Key Resistance: ₹259.50 | Support: ₹170.20
📐Technical Breakdown
EPL Ltd has been forming a massive symmetrical triangle for over 3 years – a classic pattern that signals a strong directional move ahead. The breakout in 2023 failed to sustain, but what followed was more bullish: a textbook retest of the breakout zone, holding above long-term support at ₹170.
The current monthly candle is showing signs of reversal right at the converging trendline – suggesting bulls are stepping back in. 📈
---
🔥Why EPL Could Explode:
* ✅ Breakout from a multi-year consolidation
* ✅ Strong bounce from trendline support
* ✅ Huge price contraction = energy building up
* ✅ Target of ₹430 implies 100%+ upside
* ✅ Solid risk-reward setup for*swing/positional trades
---
🛡️Risk Management:
Below ₹170 = setup invalidation. Keep stop-losses tight if trading short-term.
💬 What’s Your View?
Do you think EPL is gearing up for a major move? Drop your thoughts in the comments!
#StockMarket #EPL #NSEStocks #ChartPatterns #BreakoutStocks #HiddenGems #SwingTrade #PositionalTrading #TechnicalAnalysis #TrianglePattern #MultiYearBreakout #TrendReversal #TradingViewIndia #MidcapStocks #SmartMoney #VolumeBreakout #LongTermInvesting
Community ideas

TATAMOTORS - Long for 15 %valuation is decent at current price level
after falling for 8 months, price acion is showing trend reversal
sequence of change is marked with numbers in chart
price crossed 18 day EMA and defended it thrice
on friday , price bounced from 18&50 day EMA crossing pivot level with a wite marbozu
expecting 15 % run in 1 month
target and SL marked

Solar Industry (NSE) at Make-or-Break Level ? NSE:SOLARINDS
Summary:
📈 Key Levels
Breakout: Cleared resistance at 13,300 with a strong bullish engulfing candle.
Pattern: Bullish Flag & Pole (pole size: 3,777.80 points) suggests a measured move target of 17,077.80.
Trend: Price above 20/50/200 EMAs on daily, weekly, and monthly timeframes.
Risk: Overbought RSI (14) and bearish MACD crossover hint at potential consolidation.
________________________________________________________________________________
Technical Analysis
1. Bullish Structure Confirmed 🚩
Bullish Engulfing Candle : Broke above critical resistance at 13,300 (near all-time high), signaling bullish momentum.
Flag & Pole Pattern: The "pole" (3,777.80-point rally) followed by a consolidation "flag" suggests a potential repeat of the uptrend post-breakout. Historical symmetry often sees targets equal to pole size.
2. Trend Alignment ✅
Multi-Timeframe Support: Price trades above all key EMAs (20, 50, 200) on daily, weekly, and monthly charts, confirming a strong bullish bias.
3. Divergence Alert ⚠️
RSI (14): Overbought at 70+ warns of short-term exhaustion.
MACD: Bearish crossover on daily charts adds caution.
---------------------------------------------------------------------------------------------------------------------
Trade Setup
Entry Zone:
Aggressive: Current price (above 13,300).
Conservative: Retest of 13,300 as support.
Targets: 17,077.80 (measured move: 13,300 + 3,777.80).
Stop Loss: 13,000 (low of the bullish engulfing candle) or 12,640 (prior swing low) for wider risk tolerance.
Risk Management
Position Size: Risk ≤1-2% of capital.
Confirmation: Watch for a daily close below 13,000 to invalidate the setup.
Conclusion
The Solar Industry (NSE) is at a critical juncture: bullish momentum clashes with overbought signals. While the Flag & Pole pattern and EMA alignment favor a rally to 17,077+, traders must respect the RSI/MACD divergence. A decisive hold above 13,300 could fuel the next leg up, but a breakdown below 13,000 may trigger profit-taking.
Key Action: Monitor price action above 13,300 for confirmation!
📊 Chart Attached | Like/Follow for updates!
Disclaimer: This is not financial advice. Always conduct your own analysis.
#NSE #SolarStocks #TechnicalAnalysis #BreakoutAlert

Short Sunpharma on technical analysis till 1680Siunpharma looks week in daily chart and seems it can fall 1680 zone as per price support on that area where bulls vcan activate and bears will close their position.
📈 Technical Indicators
Moving Averages: Strong Sell
Technical Indicators: Strong Sell
RSI (14): 31.939 (Approaching oversold territory)
MACD (12,26): -13.57 (Bearish)
ADX (14): 30.04 (Indicates trend strength)
Williams %R: -97.69 (Oversold)
🔍 Demand & Resistance Zones
Demand Zone: ₹1,840–₹1,850
Sellers' Liquidity Zone: ₹1,920
Major Resistance: ₹1,960 (All-time high on Sep 30, 2024)
📌 Trade Setup
Entry: Consider long positions near ₹1,850 or upon breakout above ₹1,860
Targets:
Target 1: ₹1,920
Target 2: ₹1,960
Stop-Loss: Below ₹1,820
Risk-Reward Ratio: Minimum 1:2
🧠 Fundamental Insights
Analyst Consensus: Buy
12-Month Price Target: Average ₹2,051.84 (Upside of ~14.98%)
EPS Growth Forecast: 12.3% per annum
Revenue Growth Forecast: 9.8% per annum
Return on Equity Forecast: 16.9% over 3 years
🧬 Recent Developments
Acquisition: Acquired Checkpoint Therapeutics for $355 million in March 2025, enhancing oncology portfolio
Earnings Beat: Q3 FY25 EPS of ₹13.40 vs. estimate of ₹11.98; Revenue of ₹136.75B vs. estimate of ₹133.98B

XAUUSD Ultimate Bullish TargetsBulls - Assemble!
XAUUSD has recently shown a decent pullback. It opens new doors for all traders having a bullish view on Gold. According to my analysis, Gold is mirroring it's previous bull run moves, with a few extra volume bursts (50-100 pips) here and there.
So, the max upside potential for Gold is 3680 - 3700 which is Approximately 4000 pips from the current price (3300). This would be my absolute last target, after which it should see a decent correction once again because that would be extremely overbought region.
Refer to the chart for key reversal zones.
Let's see what happens.
Trade Safe, Don't overleverage your positions.
Cheers!

Shriram Pistons - Wedge BO NSE:SHRIPISTON Made Beautiful Chart Structure today after Q4 Results with Good Price and Volume action.
Wedge Breakout Pattern History:
The chart displays a remarkable track record of successful wedge breakout patterns, which has become a defining characteristic of this stock's technical behaviour:
Past Wedge Breakout Sequence:
First Wedge (2022-2023): Initial falling wedge formation around the ₹550-700 range, which broke out to the upside and catalysed a strong rally.
Second Wedge (Mid-2023): Formed after the first major run-up at the ₹1,000-1,200 level. This wedge breakout propelled the stock toward the ₹1,600 level.
Third Wedge (Early 2024): A more compact wedge pattern around ₹1,800-2,000 that triggered another significant upward move.
Fourth Wedge (Recent): The latest wedge formation, which has just broken out with today's massive 14% price surge.
Pattern Reliability:
What makes this technical setup particularly compelling is the consistency of these wedge patterns:
Each wedge has followed a similar compression pattern
All previous breakouts have led to substantial price advances
The patterns have maintained their predictive validity across different market cycles
The breakouts have consistently occurred on higher-than-average volume (implied by the large price bars)
Current Breakout Analysis:
Today's 14% surge represents a powerful breakout from the most recent wedge pattern:
The breakout has occurred with exceptional momentum (nearly 20% gain on a weekly TF)
The price action has cleared both the upper trendline resistance and previous swing highs
The stock is now approaching its all-time high of ₹2,399.00
Price Structure & Technicals:
Beyond the wedge patterns, the stock shows several positive technical characteristics:
Consistent stair-step pattern of higher lows and higher highs
Each consolidation period (wedge) has been followed by robust expansion
Primary trend remains strongly bullish with price well above major moving averages (implied)
Each breakout has established a new support level at the previous resistance
Projection Based on Historical Pattern:
Given the stock's history of successful wedge breakouts:
The measured move projection from this breakout suggests a potential target in the ₹2,400-2,600 range
The stock could reach new all-time highs if the pattern's reliability continues
Previous breakouts have generally resulted in 20-30% moves from the breakout point
Key Levels to Watch
Immediate Resistance: ₹2,399.00 (all-time high)
Support: ₹1,950-2,000 (previous wedge upper boundary, now potential support)
Secondary Support: ₹1,800 (previous consolidation level)
Conclusion:
Shriram Pistons & Rings demonstrates a remarkably consistent pattern of wedge breakouts that have reliably preceded significant price advances. Today's powerful breakout continues this technical signature, suggesting the potential for further upside if historical pattern reliability maintains.
Keep in the Watchlist.
NO RECO. For Buy/Sell.
📌Thank you for exploring my idea! I hope you found it valuable.
🙏FLLOW for more
👍BOOST if useful
✍️COMMENT below with your views.
Meanwhile, check out my other stock ideas on the right side until this trade is activated. I would love your feedback.
Disclaimer: "I am not SEBI REGISTERED RESEARCH ANALYST AND INVESTMENT ADVISER."
This analysis is intended solely for informational and educational purposes and should not be interpreted as financial advice. It is advisable to consult a qualified financial advisor or conduct thorough research before making investment decisions.

SEQUENT SCIENTIFIC By KRS Charts8th May 2025 / 10:30 AM
Why SEQUENT SCIENTIFIC?
1. Technically it is showing Potential for movement.
2. In Past Already Got More than 50% Returns but important thing is as per Dow Theory it is making Higher Low.
3. In 1D TF multiple Breakouts with Above avg Volume is visible.
4. This is 1M Time Frame , so View is Medium to Long term.
T1 is already Achieved in Past but again after Retracement T1 & T2 will be same as before from current price.

Bullish trap in CESC: Ascending channel.Two points are showing a bullish trap in CESC chart (daily timeframe):-
1. Prices are exhausting in the channel. A volume spike is needed for the channel breakout, which is missing here.
2. Prices made higher highs, but RSI made lower highs, showing divergence. This means there are good chances for a bearish breakout.
3. A failed breakout from the lower channel will pull prices back to test the higher trendline of the channel. RSI breaking the 75+ will be a bullish signal for the prices to go for the higher targets.

Google: A compelling buy at the current priceHello,
As Warren Buffett famously said, "Be fearful when others are greedy, and greedy when others are fearful." This mindset is particularly relevant right now with Alphabet Inc.
Despite being a company whose products we use daily—and will likely rely on even more in the future—Alphabet's stock recently declined following comments from Apple’s Eddie Cue regarding a drop in Safari search traffic. This has sparked concerns about Google's dominance in search and its ad revenue streams. Analysts are also highlighting growing competition from AI-driven platforms such as OpenAI, Grok, and Perplexity, raising questions about the future growth of Google Search.
While the headlines may seem discouraging, we remain confident in Google’s enduring leadership in the search space, underpinned by its unmatched scale, infrastructure, and user base. We also believe the market continues to underestimate how far ahead Google truly is in artificial intelligence.
In our view, this dip represents a strategic buying opportunity for long-term investors. Below is our in-depth analysis of Alphabet and why we believe it remains a strong investment.
Alphabet, Inc is a holding company, which engages in the business of acquisition and operation of different companies. Google Services includes products and services such as ads, Android, Chrome, devices, Google Maps, Google Play, Search, and YouTube. Google Services generates revenues primarily from advertising; fees received for consumer subscription-based products such as YouTube TV, YouTube Music and Premium, and NFL Sunday Ticket, as well as Google One; the sale of apps and in-app purchases and devices.
KEY NOTES FROM THE Q1 2025 EARNINGS CALL
Revenue up to $ 90.23 Billion (Q1 2024: $ 80.54 Billion)
Operating income for quarter one 2025 at $ 30.61 Billion (Q1 2024: $ 25.47 Billion)
Net income for quarter one 2025 at $ 34.54 Billion (Q1 2024: $ 23.66 Billion)
Diluted Earnings per share closed at $ 2.81 as at 31st March 2025 (2024: $ 1.89). Alphabet’s Board of Directors declared a quarterly cash dividend of $0.21 representing a 5% increase from the previous quarterly dividend of $0.20.
Cash and cash equivalents remained flat as of the end of March 31 2025 at $ 23.26 Billion (2024: $ 23.47 Billion)
Google advertising continues to do the heavy lifting for the alphabet business contributing $ 66.89 Billion of the total $90.23 Billion. Google Services includes products and services such as ads, Android, Chrome, devices, Google Maps, Google Play, Search, and YouTube. Of this amount, the breakdown is as below
Google search & other: $ 50.70 Billion
Youtube ads: $ 8.93 Billion
Google Network: $ 7.26 Billion
Other services offered by the platforms contributed revenues as below
Google subscriptions, platforms & devices: $ 10.38 Billion
Google cloud: $ 12.26 Billion
Other bets: $ 450 million. Other Bets is a combination of multiple operating segments that are not individually material.
Hedging gains: $ 260 million
The company announced a share buyback program of up to $70 billion of its class A and class C shares. The buy backs will be executed through open market purchases or through privately negotiated transactions.
Business Opportunities/Strengths
Alphabet’s advertising business is firmly embedded in digital advertising budgets, allowing it to capitalize on the ongoing growth in digital ad spending.
The significant cash flows from advertising enable Alphabet to reinvest in growth areas like Google Cloud, AI-enhanced search, and innovative ventures such as Waymo. (Waymo is Alphabet's autonomous driving technology subsidiary, focused on developing self-driving cars and related technologies.)
With a strong foothold in the public cloud market, Alphabet has a substantial opportunity as a major provider for enterprises transitioning to digital platforms.
Risks to consider
Although Alphabet is working to diversify, text-based advertising remains its primary revenue source, presenting a concentration risk.
Ongoing investments in emerging, sometimes unproven technologies through its Other Bets segment continue to strain cash flows.
Increasing regulatory scrutiny of Alphabet's search dominance worldwide could lead to significant market disruptions through structural reforms.
Recommendation
We view Alphabet as a solid business with diverse solutions ranging from advertising, cloud business and driverless cars as well. While we acknowledge that the antitrust cases have continued to make headlines, we encourage investors to remain invested and focused on the business’s strengths. The business has unique products that will have the ability to remain leaders for a very long period of time. Android is the operating system for the majority of the world’s smartphones with more than two-thirds of all smartphones in the world running it. Virtually all smartphones, other than those manufactured by Apple, run on Android. We see this remaining as a google strength for a very long time. The Google Play Store’s unmatched ecosystem creates significant barriers for competing operating systems, limiting their access to critical applications. The recent correction on US technology companies provides us with a solid buying price for some of these great companies. Alphabet alone corrected by about 31% and has since bounced back.
We see the current price as a great entry price for long term investors based on both technical and fundamental analysis with a target price of $ 203.

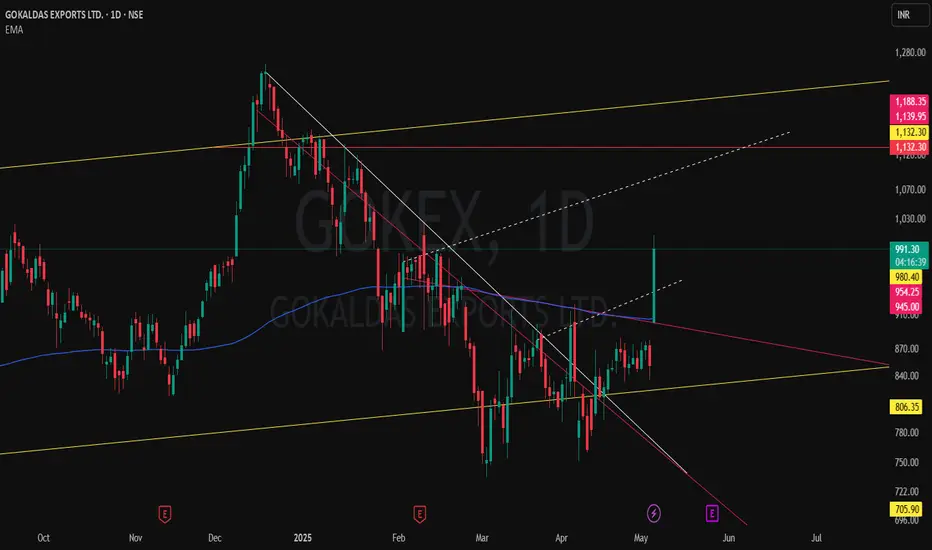
Massive Breakout Loading? GOKEX Smashes Through Triple TimeframeGOKALDAS EXPORTS LTD (GOKEX) is showing serious strength with a powerful breakout candle currently in play – but the real story is the multi-timeframe technical alignment:
📏 MTF Structure
Yellow Parallel Channel from Monthly shows a long-term structure still intact.
Red Horizontal Resistance marks the previous MTF peak – now under threat.
🔻 WTF Pressure
Pink Counter-Trendlines acted as significant resistance on the Weekly – both pierced.
⚡ DTF Precision
White CT Line (Daily) finally broken with conviction.
Dotted White Lines reveal multiple hidden resistances — all cleanly taken out by today's surge.
📊 Volume & Candle Strength
Volume spiking, price up over 16% intraday — just waiting on confirmation at close.
🧠 Watch Closely: A close above today’s highs could flip this into a full-blown A+ breakout setup.
Fresh Possible Supply Zones Spotted! | 15-Min Chart Analysis🟣 Nifty 50 Index – Fresh Possible Supply Zones Spotted! | 15-Min Chart Analysis
📅 Date: May 7, 2025 | 🕒 Timeframe: 15-Minute
Hello Traders 👋
Today’s chart highlights two potential supply zones on the Nifty 50 index that could play a crucial role in the short-term price movement. Supply zones are areas where sellers have previously stepped in, often leading to price reversals or consolidations. As price approaches these levels again, we may witness similar behavior.
🔲 Supply Zone 1: 24,558.35 – 24,589.15
This upper zone formed after a strong up-move followed by aggressive selling pressure. It indicates the presence of strong sellers. If Nifty retests this area, look for signs of reversal like bearish candles or rejection wicks.
🔲 Supply Zone 2: 24,391.30 – 24,449.60
A more recent and sharper reaction zone. This is where we saw an intraday rejection today, suggesting sellers are active even at slightly lower levels. This could act as the first resistance on any intraday pullback.
🧠 What Should Traders Watch For?
Wait for price to enter the supply zone and show signs of rejection.
Use confirmation tools like candlestick patterns, RSI divergence, or volume drop.
Ideal for sell-on-rise setups with proper stop loss above the supply zone.
Avoid trading blindly inside the zone—confirmation is key.
📌 Note: These zones are not guaranteed reversal points but serve as high-probability areas for potential resistance. Combine them with your strategy for better results.
💬 Feel free to drop your thoughts or ask questions in the comments. Follow for more such real-time chart breakdowns.

Alembic Ltd – Inverted Flag Pattern Forming | Breakout Trade SetAlembic Ltd appears to be forming a classic inverted flag pattern on the daily chart:
Bearish Flagpole: A strong and sharp downward move from ~₹148 to ₹88 established the flagpole.
Bullish Flag (Retracement Channel): Since March, the price has been moving in a parallel rising channel — a typical retracement phase.
The price is currently near the lower trendline of the flag, suggesting a potential entry point for a breakout trade.
Support zone : Around ₹100–₹101 near the lower channel boundary.
Target: ₹113–₹115 (upper boundary of the flag channel).
Stop-Loss: Below the lower trendline of the flag (~₹96), or tighter based on risk preference.
Bias:
Neutral to slightly bullish in the short term as long as price stays within the flag.
Watch for a volume-supported breakout above recent swing highs (~₹105) to confirm momentum toward the target.

IOC - Poised for good up Move?After a big drop of nearly 40 percent from the top, the stock started consolidating and moving up, making a nice rounding bottom type of pattern. It started making higher highs and higher lows and moving past the short-term moving averages. Now, it has also gone past the 200 DMA and also crossing above an important pivot. We can see all the parameters like the relative strength, money flow, absolute strength are all positive. Also, it has come out with very good results for the fourth quarter with a good jump of nearly 58 percent in net profit. We can see the volume is also increasing along with the buying pressure. Now it is setting up nicely for a big up move. So this is a stop we should be watching.

DLFHello & welcome to this analysis
In the hourly time frame after a steep correction followed by consolidation its now on the verge of an Inverse Head & Shoulder breakout above 695 for probable upward levels of 740 & 800.
It has very good support near 670 as shown by the Ichimoku Kumo
All the best

HEROMOTOCO negative chart of value consolidation ?Hero MotoCorp Ltd. seems to have made interesting negative chart formation with following:
1. RSI taking resistance at 60 levels and slipped below 60 on daily chart.
2. RSI slipped below 40 on weekly chart
3. Price trading below 50 EMA, 100 EMA, 200 EMA and 20 SMA on daily chart and slipped below 20 SMA and 50 EMA during last trading session.
4. Stock Slipped below 20 SMA weekly during last week
5. Next Major support is near 200 Week EMA i.e. 3545 and 50 month EMA at 3500
levels
Lets See How it evolves from here
Disclaimer: NOT A BUY / SELL RECOMMENDATION I am not an expert I just share interesting charts here for educational purpose and not to be taken as buy/sell recommendation. Please seek expert opinion before investing and trading as trading/ investing in market is subject to market risks. I do not hold any position in the stock as on date but I may look to take some position with my own Risk Reward matrix.

TataMotors - 45% Discount from PeakTata motors , a premier automobile company has fallen for 50% from peak and now available at 45% discount. study the stock for following reasons.
No 1 Indian Auto companies in terms of Market Share
Price to Earning < 10
Dividend yield .47%
Operating Profit Margin > 10%
34% Share Holding by institution
Disclaimer: please study and take any investment decision after consulting your financial advisor

BULLISH HAPPIEST MINDSWave analysis of happist minds reveals that it has completed correction by forming a,b and c waves . wave b being a contrscting triangle.the thrust out of triangle has resulted in wave c to the downside.now the trend should progress towards upside to the levels of 2500 levels.
that should happen by forming a 5 wave impulse waves in smaller time frames like 15 minutes or huorly.and ensuing correction in three waves.
if trend is not up then whole thing will be larger A,B and C correction.then C wave will be shallow. may not reach beyond 800 levels. it may find resistance there and follow downslide.

Rounding Bottom Breakout in United SpiritsUnited Spirits has given Rounding bottom Breakout on the daily charts. This pattern is very powerful and now this stock can provide a return of 15% in near term.
On the monthly chart, the stock has a long white bodied candlestick which signifies strength and possible bullish bias.
On the Daily Chart,the stock is trading above its 11 and 22 day EMA, RSI is at 69 and MACD is above zero line suggesting positive momentum.
Volume- The volume has increased towards the breakout which suggests the possible upmove.
CMP- Rs.1570
Price Target - Rs1800
SL- 1525 ( Below the neckline)
Disclaimer: This is not a buy/sell recommendation. For educational purpose only. Kindly consult your financial advisor before entering a trade.

SARLAPOLY - Cup & Handle Breakout With Fibonacci Confluence📊 SARLAPOLY – Cup & Handle Breakout with Fibonacci Confluence
🕰️ Timeframe: 1D | 📐 Pattern: Cup Formation + Trendline Breakout
🔍 Technical Overview:
SARLAPOLY has completed a Cup pattern and given a strong breakout above the descending trendline resistance, accompanied by a massive volume spike.
The breakout aligns well with the 61.8% Fibonacci retracement level (~₹100.94), increasing confidence in the breakout's validity.
🔑 Key Technical Levels:
🔵 Resistance / Upside Targets:
₹117.88 (Fib 78.6%)
₹120.00
₹123.68
₹125.00
₹127.90
₹132.25 (100% Fib retracement)
🔴 Support Zones:
₹101.13 (recent breakout level / Fib 61.8%)
₹94.66 (previous resistance zone – now support)
₹91.27 (Fib 50%)
₹69.07 (23.6% Fib + structure support)
📊 Volume & Indicators:
📈 Breakout Volume Surge – Volume confirmation indicates institutional interest and breakout strength.
🧮 Fibonacci Retracement – Plotted from swing low (₹50.30) to swing high (₹132.25), gives clear confluence zones.
🔺 Trendline Breakout – Downward sloping trendline broken cleanly, confirming bullish intent.
☕ Cup Formation – Classic rounding bottom visible, suggesting accumulation phase is complete.
🧠 Bias: Bullish
📉 Watch for a retest around ₹100–₹101 zone as a potential re-entry point with SL below ₹94.66 for positional swing.
⚠️ Disclaimer: This is an educational analysis and not financial advice. Always do your own research before making investment decisions.
📈 Follow @PriceAction_Pulse for more price action setups, breakout alerts, and swing trade ideas!
💬 Comment below if you’re watching SARLAPOLY for the next leg up 📊

Vishal Mega Mart Ltd (VMM) Cup and Handle BO with good volumeThe chart you've provided is a **cup and handle breakout pattern** for *Vishal Mega Mart Ltd (VMM)*, which is a classic bullish continuation pattern in technical analysis.
### Key Observations:
1. **Cup and Handle Formation**:
- The "cup" part of the pattern formed over February to mid-April.
- The "handle" formed shortly after and broke out with a strong bullish candle on April 30.
2. **Breakout Details**:
- Breakout above the resistance zone of **₹113.50–₹117.41**.
- The stock closed at **₹118.48**, up **10%** on high volume—indicating strong buying interest.
3. **Price Target Projection**:
- Depth of the cup is approximately **₹17.56**.
- Projected target from breakout point (₹117.41) is around **₹127.50**, which is also marked on the chart.
4. **Volume Confirmation**:
- Significant volume spike on the breakout day supports the validity of the breakout.
### Summary:
This breakout is a bullish signal, and the target is around **₹127.50**, as long as the price sustains above the **₹113.50** support zone. A retracement to retest this breakout zone is possible, but the pattern remains valid unless it breaks below this support.

Nifty Iron Condor – Range-Bound Strategy for May Expiry!Hello Traders!
This post is for those who want to generate passive monthly income by leveraging the power of non-directional option selling . Based on current Nifty structure and OI data, I have spotted a range-bound opportunity — perfect for executing a safe, hedged Iron Condor Strategy .
Why This Strategy Now? (Based on Chart Analysis)
Resistance Zone: 25000–25200 (Heavy supply, multiple rejections visible)
Support Zone: 23400–23250 (Major bounce levels, strong OI support)
Nifty is currently trading near 24325, well inside this range — perfect for deploying a neutral premium-eating setup.
Strategy Setup (Iron Condor – 29 May 2025 Monthly Expiry)
Sell 25200 CE @ ₹124.25
(Resistance-based upper strike)
Buy 25800 CE @ ₹38.60
(Hedge to protect against breakout)
Sell 23400 PE @ ₹157.05
(Support-based lower strike)
Buy 22800 PE @ ₹91.40
(Hedge to protect against breakdown)
Strategy Highlights
Why This Works? (OI Logic + Technical View)
Strong resistance visible at 25000–25200 zone with increasing call OI
Solid put writing seen at 23400 & 23500 strike — confirming downside support
Volatility is stable, time decay is in our favor — making this ideal for Iron Condor sellers.
Risk Management & Exit Plan
Exit early if either side breaks with volume
Don’t hold till expiry — aim to exit around 70–80% of max profit
Always keep SL alert at breakeven range breakouts
Rahul’s Tip
“Option writing is not for thrill, it’s for discipline. Iron Condor is a weapon when range is visible — use it like a sniper, not a gambler.”
Conclusion
If you believe Nifty is likely to stay between 23400–25200 for the next few weeks, this Iron Condor setup offers great risk-managed income potential. Use proper lot sizing and risk control — and let theta do the work for you!
Have you ever deployed an Iron Condor on Nifty? What was your experience? Drop your thoughts in the comments!
If you found this post valuable, don't forget to LIKE and FOLLOW !
I regularly share high-quality trading setups based on real analysis, OI data, and smart risk management strategies.
Disclaimer: This analysis is for educational purposes only. Please consult a financial advisor before making investment decisions.

MAZAGON DOCK ROUNDING BOTTOM BREAKOUTMazagon dock breaking rounding bottom
with huge volume, bullish RSI
defence sector in focus
#target 3250 after breaking 3150
NO BUY/SELL RECOMENDATION

Cup and Handle - ManappuramManappuram
Manappuram Finance is a Non-Banking Finance Company (NBFC), which provides a wide range of fund based and fee based services including gold loans, money exchange facilities, etc. The Company is a Systemically Important Non-Deposit taking NBFC(NBFC-ND).
Recent Important NEWS
Bain Capital will acquire an 18.6% stake in Manappuram Finance, a leading Indian gold loan company, through a primary infusion and secondary sale. The investment includes a mandatory open offer, potentially increasing Bain's stake to 41.7%. The deal, subject to regulatory approvals, aims to propel the company's growth.
Cup & Handle Pattern
Stock Weekly chart formed Cup and Handle pattern , retest confirmation also done 220 level. Expected target 350 and sustain above 500+++ possibility high. Duration 1 to 2 year. Stop loss continue 2 week closing based below 220.
