SBICARD Price is at break even levelSBICARD made a like double bottom in daily time frame and the price is currently trading at the neckline of the double bottom. If it breaks the neckline, a momentum setup will be formed here and we will entre on the breakout candle. The stoploss below the breakout candle and target will be Rs 808.
Community ideas

Bata India Ltd. bottom fishing opportunity The chart of Bata India Ltd. is showing a bullish breakout from a Symmetrical Triangle Pattern. As the stock nears the apex of the triangle, a breakout above the descending trendline at approximately ₹1,500-₹1,550 would confirm the upward momentum. This breakout, accompanied by strong volume, signals the potential for a substantial price movement. The target for this bullish move can be projected to ₹2,000-₹2,200, based on the height of the triangle. Traders can enter above ₹1,500-₹1,550, with a stop-loss placed near ₹1,400, offering a favorable risk-reward setup as the stock breaks out of its consolidation phase.

NIFTY'S DARK CLOUD COVR WILL IT FORM BOTTOM OR FALL FURTHER ?
Nifty 50 which has formed this two candle pattern (green Candle followed by Red candle covering almost 50% or more of previous green candle body) in some instances it is perfect Dark Cloud Cover Candle Pattern
Just check similar pattern was formed on following dates
15-oct -24 --- Followed by bearish trend and fall in prices
17-Nov-24 --- Followed by Bearish trend and fall in prices
16-Dec 24 --- Followed by Bearish Trend and fall in prices.
So Now what does it hold ?
Just check closely Prior to 16th Dec 2024
1. Nifty was forming Lower top and Lower Bottom
2. RSI was sloping down wards
However during 3rd Dec,24 to 15 Dec 24 nifty formed a High top and
Formed Higher bottom on 1st Jan-2025.
and RSI is now sloping upwards
Now same pattern appears on NIFTY chart again
what do you think will happen on index now ? Share your views
Will Nifty hold its higher low and move upwards ?
Or
Will it continue its down trend again ?

Bullish Reversal from Order Block at TrendlineKey Observations:
Order Block: A strong bullish order block is aligned with the ascending trendline near ₹500-₹491, suggesting a high-probability support zone.
Trendline Support: The price is respecting a long-term ascending trendline, which acts as a dynamic support level.
Change of Character (ChoCh): A bullish change of character has occurred, breaking out of the downtrend channel.
Trade Plan:
Entry:
Early Entry: Near ₹525 on a retest of the breakout zone.
Conservative Entry: Near ₹500-₹491, aligning with the order block and trendline.
Stop Loss:
Below ₹490, invalidating the bullish order block and trendline support.
Targets:
Target 1: ₹580 (recent swing high).
Target 2: ₹638 (pattern projection based on the breakout move).
Risk-Reward Ratio:
Highly favorable, especially for an early entry near the trendline.
Indicators for Confirmation:
RSI: Currently rebounding from oversold levels, showing bullish momentum. A sustained RSI above 50 will further confirm strength.
Volume: Watch for increasing volume near the breakout or retest zones.
Strategy Notes:
Early Entry Caution: For aggressive traders, entering near ₹525 may involve higher risk. Monitor for confirmation (e.g., bullish candlestick patterns or volume spikes).
Scaling In: Consider scaling into the position if the price holds the ₹500-₹491 zone with bullish price action.
Exit Plan: Trail your stop-loss as the price moves towards targets to lock in profits.

Chart Analysis for Bajaj Finserv Ltd. (Weekly Timeframe)The stock is forming a bullish triangle pattern, a classic continuation pattern signaling potential upside. The price is respecting the ascending trendline, showing strong support near ₹1,700 levels, while the upper resistance line has been tested multiple times. This signifies increasing buyer strength.
Key Levels to Watch:
• Support: ₹1,698
• Resistance (Breakout Level): ₹2,050
• Target Price (Post Breakout): ₹2,336 (derived from the triangle’s height projection).
• Stop Loss: ₹1,515 (below the trendline support).
Short-Term Long Trade Setup
• Entry: Around ₹1,700, once the price shows bullish confirmation (e.g., reversal candlestick patterns or high volume).
• Target: ₹2,050 (short-term) and ₹2,336 (medium-term).
• Stop Loss: ₹1,515 to manage risk effectively.
Market Sentiment:
The stock shows a bullish structure, supported by prior consolidation and breakout potential. Patience is key for confirming a breakout above ₹2,050 before expecting the measured move towards ₹2,336.
DISCLAIMER- Please do your own research before investing in the market. This is for educational purposes only

Bajaj Finserv Short Term TradeThe level around 1555 is an important support zone
Price has been approaching this zone with a falling atr,
and then shown some consolidation near the zone,
now there has been a rise from that level with a surge in volume and atr
Thus there is a short term trade,
tgt 1714, sl 1580

Exide Industries Seems to be well consolidatedExide has been in downtrend for past 3 months,from October 24.It has just shown a small break out after 3 months of fall.RSI is showing positive divergence,I feel the stock may touch Rs 516 /548 level as per fibonocci retracement.
Critical Break out at Rs 445
Time Frame 45-60 days
We can buy with a very small SL-Rs 408

LUPIN : 5 Months Consolidation breakout LUPIN is showing 5 Months Consolidation breakout after a long 9 years breakout ... Potential upside possible 65-70%..
All data is available in public domain..
CMP : 2360
TG : 3400
SL : Below 9 Weekly EMA
Stock's selection based on 5 Point Analysis:
1: Idea : Breakout.
2: Support : Volume, Delivery.
3: Technical : 21/55/200-EMA, RS>0, RSI & Super trend up.
4: Fundamental : PE, PAT, Industry & peer PE and sector performance.
5: Timing : Entry Timing on Daily chart.
Disclaimer : It is my personal view as a trader and for educational purpose only. Equity market involves risk .
Please consult your financial adviser before taking any decision.

Bluestar Ltd: Cup & Handle Breakout SetupPattern: Cup & Handle Formation
Timeframe: Daily
Entry Level: Above 2160
Stoploss: 1970
Positional View: A breakout above 2160 could trigger a strong upward move. The Cup & Handle pattern indicates bullish sentiment, and this setup has the potential for a good positional trade.
Note: Wait for a decisive close above 2160 before entering the trade.

COCHIN SHIPYARD LTD LONG ANALYSIS 29.12.24COCHIN SHIPYARD LTD LONG Analysis 29.12.24
Investment type : Mid term (6-12 months)
CMP : 1539.05
R:R = 1:3.5
Expected Gains : 40-90%
Bullish Levels :
Level 1 : 1741.45
Level 2 : 2097.60
Level 3 : 2470.45
Level 4 : 2933.15
Stop loss : 1150.00
This tech. analysis is purely for educational purpose only we did not recommend to invest as per our analysis.
For investment please consult financial advisor.

Siemens - Low Risk SetupCMP 6546 on 28.12.24
For the last 6 months, the price has been oscillating between 8000 and 6500. This moment again comes near the level of 6500.
If it bounces back from here, may go into a bullish phase again. One may look for a long setup at this point because of the good risk-reward ratio.
The setup remains active above 6550. If it sustains below 6450, the setup goes weak.
Before entering, one should wait for the reversal signs according to their setups.
All this illustration is only for learning and sharing purposes, it is not a piece of trading advice in any form.
All the best.

I just spot bough 100% SOLBanana Zone commence?
Interest rates will lower next year.
I just could not be in stables right now. It just did not seem right.
I don't have the time to be day trading, although I have recognized set ups that I may take the time to trade during trending days. Pullbacks end with small bodied candles which provide tight SL scalp opportunities. Impulsive days may have 3 or 4 pullbacks and breakout setups before the price action does wide shakeout, double bottom patterns. Solana in the intraday also tends to end trends with diagonals, up or down. Break out and retests are very common especially at the beginning of trends. I have noticed I also tend to have a bearish bias at all times, and my eyes have been trained more for bearish setups. The bullish retests tend to be more volatile, I have noticed.
Perhaps I will spot sell at a future date. In a couple weeks even. I do not expect the next month to see parabolic action. I anticipate consolidation, but that is my bearish mindset talking. I am not bullish enough?
The boxes set context to the chart. Its a copy paste of the current pullback.

LUPIN Poised for a Strong Upside MoveLUPIN is exhibiting a multi year breakout with strong support at current levels, indicating significant upside potential in the next 3–6 months. This technical setup suggests a robust foundation for a sustained rally, making it an attractive choice for swing and positional traders. If you have a different perspective or insights, feel free to share your thoughts!

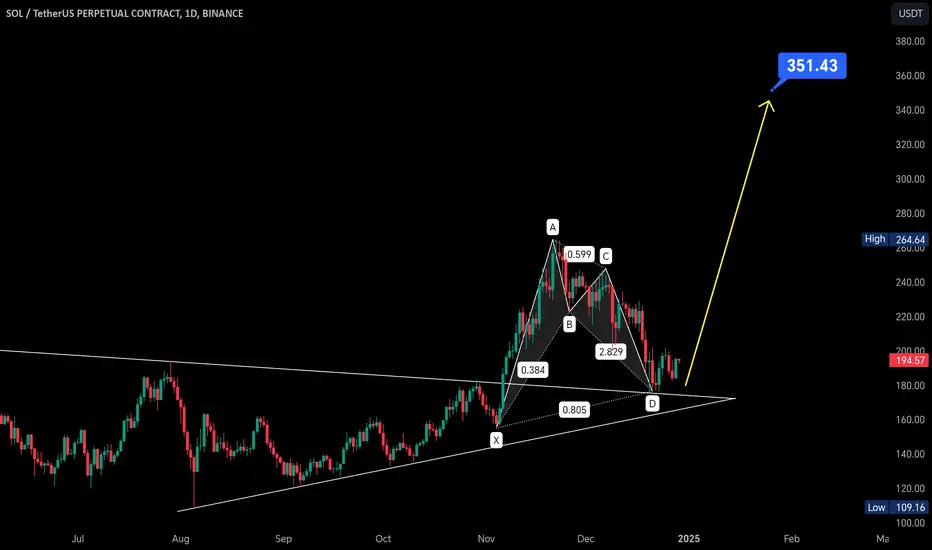
$SOL Price Analysis: $350 and $400 Targets in SightSolana has clearly retested the previous symmetrical triangle and has now formed a bullish Shark pattern. Additionally, it is consistently forming higher lows on the daily chart. The RSI has also bounced back from the oversold region, further supporting a bullish outlook. All these indicators suggest that Solana is poised for a strong upward movement. My price targets for this potential rally are $350 and $400.
Oberoi Reality Analysis1. Trend:
• The stock is in an uptrend within a defined channel.
• It is currently near the upper resistance of this channel.
2. Support and Resistance Levels:
• Resistance levels are visible around ₹2,343 and ₹2,315.
• Support levels are approximately at ₹2,236, ₹2,083, and ₹1,970.
3. Moving Averages:
• The stock price is trading well above the 50-day (yellow), 100-day (green), and 200-day (red) moving averages, indicating bullish momentum.
4. Volume:
• The recent candles have slightly lower volumes, suggesting weaker buying momentum at the current levels.
5. RSI (Relative Strength Index):
• The RSI is near 70, which indicates the stock is in an overbought zone. This could signal a potential correction or consolidation in the near term.
Technical Outlook:
• Bullish Case:
• If the stock breaks above ₹2,343 with strong volume, it could continue its uptrend to new highs.
• Bearish Case:
• A failure to hold current levels might lead to a pullback toward support at ₹2,236 or ₹2,083.
Recommendation:
• Watch for a breakout or rejection at the ₹2,343 resistance.
• If holding the stock, consider trailing your stop-loss near ₹2,236.
• For fresh entry, wait for a correction near support levels or a breakout above resistance with volume confirmation

Himadri Speciality Chemical Ltd. Himadri Speciality Chemical Ltd. is a leading player in the chemical industry, primarily engaged in the manufacturing of carbon materials and chemicals.
Profitability: The company's profitability has been on an upward trajectory, with significant growth in net profit margins and overall financial stability.
Technical Analysis: On the technical front, Himadri Speciality Chemical Ltd. is exhibiting a Head and Shoulders pattern on the daily time frame, indicating a potential target of 670++

“Cummins India at a Crucial Juncture: Breakout or Breakdown?”The stock has recently tested a key support zone near ₹3,200, coinciding with a long-term descending trendline and the 200-day moving average (yellow line). The price action suggests indecision, making this a crucial level to watch for both buyers and sellers.
Bullish Scenario
1. If the stock sustains above the ₹3,200 level and breaks out of the descending trendline, it could signal bullish momentum.
2. Key upside resistance levels to monitor:
• ₹3,356
• ₹3,800
• ₹4,132
3. A breakout above ₹4,132 could indicate further upward potential.
Bearish Scenario
1. A decisive breakdown below ₹3,200, backed by high volume, might lead to bearish continuation.
2. Potential downside levels to watch:
• ₹3,000
• ₹2,800
3. Failure to reclaim the 200-day moving average may strengthen bearish sentiment.
Conclusion
Traders should wait for a clear price action signal – either a breakout above the descending trendline or a breakdown below the support zone. Keep an eye on volume and broader market trends for confirmation.
You can adjust this to match your style before publishing!
Disclaimer:
This analysis is for educational and informational purposes only and should not be considered as financial advice. Please conduct your own research and consult with a financial advisor before making any investment decisions. Trading involves significant risk, and past performance is not indicative of future results.

KSCL Trade set upIn the short term, KSCL's price action appears to be mixed:
The stock recently experienced a decrease of 3.95% in a 24-hour period, with the price dropping to 876.85 INR.
However, it has also shown some bullish signals, with a 5.89% price increase from 1060.55 INR to 1123.05 INR in a recent trading session.

NAM_INDIA Near Support areaNippon India Assest Management has formed a Rounding basing pattern and given a breakout .
Currently price is trading near Support zone and breakout area.
Pattern base range target plotted on chart.
We can also see that previous resistance currently acting as support.
Chart share here is for educational purpose only and not any buy and sell recommendation.

EMMBI (M) chart looking good for breakout.🔥 Trending Stock Alert: EMMBI (M) 🚀
📈 Big Breakout Potential!
After a 5-year consolidation phase (2019-2024), EMMBI has flipped the script—transitioning into a solid uptrend and ready to make waves!
✨ Key Levels to Watch:
🎯 Targets: 220 | 260
🛑 Stop Loss: 140
💰 CMP: 168
💡 Momentum traders, this could be the game-changer you’ve been waiting for!
📊 Ready to Ride the Wave?
⚠️ Disclaimer: Educational content only. Not financial advice—do your research!

Potential Swing Long: Dabur
Dabur is near a major support zone, it has respected this level from 2020.
Waiting for a dead cat bounce from the support level.
Once the downtrend line is broken and price gives a positive close above it we can initiate a long i.e 515 level.
Early Entry can be initiated with a strict SL, if a bear traps occurs below accumulation phase we can increase quantity.
Note: This is just for analysis purpose, please do your own research before punching any orders.
🔍 For more technical analysis and trade setups, make sure to follow me on TradingView

KSL Daily and Weekly breakout 34% upmove possibleThis is price breakout stategy . you can use different timeframes as daily, weekly, monthly .
I scan stocks daily and try to find breakout structure after long consolidation and confirms with different timeframe and then draws some levels as price action then we make a perfect plan for entry, stoploss and target
If you like my ideas then support me .

krishna defence - next bull run is coming soonTrade Setup - KRISHNADEF (NSE)
Scenario: Bullish breakout from a rounding bottom pattern with a close above the 50% Fibonacci retracement level.
Entry:
Trigger: A candlestick close above ₹723 (the 50% Fibonacci level). This confirms a break above the rounding bottom pattern and suggests strong upward momentum.
Confirmation (Optional): You could wait for a second confirming candle close above ₹723 to further validate the breakout.
Stop Loss:
₹630.00 (as marked on the chart). This limits your risk by defining the point at which you'll exit the trade if the price moves against you.
Targets:
Target 1: ₹811 (38.2% Fibonacci retracement) - A common first target in this scenario.
Target 2: ₹919 (23.6% Fibonacci retracement) - A more ambitious target if momentum continues.
Target 3: ₹1,095.60 (as marked on the chart) - The most ambitious target, potentially based on previous resistance or a significant Fibonacci extension level.
Rationale:
Rounding Bottom: This pattern suggests a gradual shift in sentiment from bearish to bullish, with the potential for a significant upward move.
Fibonacci Confluence: The 50% retracement level is a key level in Fibonacci analysis. A break above it adds to the bullish case.
Stop Loss Placement: The stop loss below the recent swing low helps protect your capital if the breakout fails.
Trade Management:
Trailing Stop: Consider using a trailing stop loss to lock in profits as the price moves in your favor. You could trail your stop loss below the most recent swing low or use a moving average.
Partial Profits: You could take partial profits at each target level to reduce risk and secure some gains.
Important Considerations:
Timeframe: The timeframe of this chart is crucial. If it's a weekly chart, this setup implies a longer-term trade. A daily chart suggests a shorter-term trade.
Volume: Observe volume during the breakout. Increasing volume adds conviction to the move.
News and Events: Be aware of any news or events that could impact the stock price.
Risk Management: Only risk capital you can afford to lose. This trade setup, like any other, has no guaranteed outcome.
