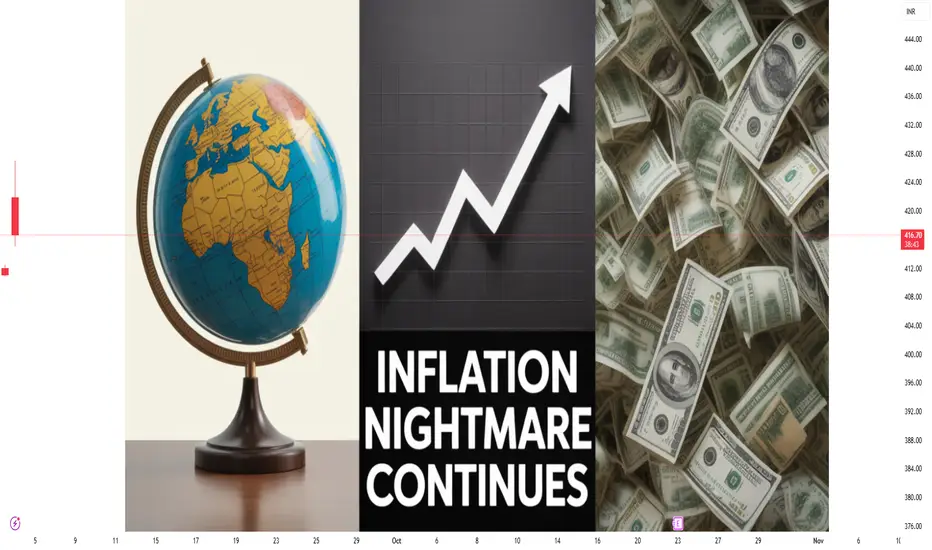
Inflation Nightmare1. Introduction: Understanding Inflation
Inflation is one of the most powerful forces shaping economies, markets, and daily life. It refers to the general increase in prices of goods and services over time, reducing the purchasing power of money. While moderate inflation is normal in growing economies, an inflation nightmare occurs when prices spiral out of control, destabilizing societies and threatening livelihoods.
To visualize:
If a loaf of bread cost ₹50 last year but now costs ₹100, people feel the direct pinch.
If wages don’t rise as fast as prices, living standards fall.
If inflation expectations rise, people rush to buy today rather than tomorrow, fueling more inflation.
An inflation nightmare is not just about economics; it is also about psychology, politics, and survival.
2. Normal Inflation vs. Inflation Nightmare
Mild/healthy inflation (2–4% per year): Supports growth, encourages spending and investment.
High inflation (6–10% per year): Hurts savings, reduces confidence, and strains households.
Hyperinflation (50%+ per month): Total collapse of currency value, leading to social unrest and chaos.
An inflation nightmare lies in the last two categories—when price rises become unbearable and unpredictable.
3. Causes of Inflation Nightmare
(a) Demand-Pull Inflation
“Too much money chasing too few goods.” When demand surges faster than supply, prices rise. Example: booming economies after wars.
(b) Cost-Push Inflation
When production costs (wages, raw materials, oil, transport) rise, businesses pass costs to consumers. Example: Oil price shocks in the 1970s.
(c) Monetary Expansion
Excessive printing of money by central banks dilutes value. Example: Zimbabwe (2008), Venezuela (2010s).
(d) Supply Chain Disruptions
Pandemic lockdowns, trade wars, and shipping crises push prices higher. Example: Global supply crunch during COVID-19.
(e) Geopolitical Conflicts
Wars and sanctions disrupt trade flows, raising energy and food costs. Example: Russia-Ukraine war impacting wheat, oil, and gas prices globally.
(f) Inflation Expectations
If people believe inflation will rise, they demand higher wages, buy goods early, and businesses raise prices preemptively—creating a self-fulfilling spiral.
4. The Anatomy of an Inflation Nightmare
An inflation nightmare often unfolds in three stages:
Warning Signs – Rising food, rent, and fuel prices, currency weakening, fiscal deficits.
Acceleration Phase – Prices rise monthly, people lose trust in currency, hoarding begins.
Crisis & Collapse – Hyperinflation, barter trade, dollarization, social unrest, political change.
5. Global Case Studies of Inflation Nightmares
(a) Weimar Germany (1920s)
Reparations after WWI and money printing caused hyperinflation.
At peak, prices doubled every 3 days.
Workers were paid twice daily, rushing to buy bread before prices rose.
(b) Zimbabwe (2008)
Government printed excessive money.
Inflation reached 79.6 billion % in one month.
100 trillion Zimbabwean dollar notes became worthless.
(c) Venezuela (2013–2019)
Oil crash + political instability.
Inflation crossed 1,000,000%.
Shortages of medicine, food, and essentials.
(d) Turkey (2021–2023)
Currency crisis and unorthodox monetary policy.
Inflation surged above 80%.
People shifted savings to dollars and gold.
(e) Argentina (Recurring crises)
Chronic fiscal deficits and weak currency.
Inflation near 100% in 2022–2023.
Savings eroded, economy dollarized unofficially.
These examples show how inflation nightmares devastate middle-class savings, destroy business confidence, and topple governments.
6. Impact of Inflation Nightmare
(a) On Households
Shrinking purchasing power.
Rising food, rent, and utility costs.
Erosion of savings and pensions.
Decline in living standards.
(b) On Businesses
Rising input costs.
Uncertainty in planning and investment.
Pressure to increase prices, risking demand collapse.
(c) On Investors
Bonds and fixed deposits lose value.
Stock markets volatile.
Safe havens like gold and real estate gain.
(d) On Governments
Pressure to increase subsidies and social spending.
Difficulty in borrowing as bond yields rise.
Risk of political instability and protests.
(e) On Global Trade
Exchange rate volatility.
Higher import bills for energy and food.
Capital flight to stable economies.
7. Why Inflation Nightmares are Dangerous
Uncertainty: People don’t know future prices, making planning impossible.
Wealth Destruction: Savings, pensions, and salaries evaporate in real terms.
Inequality: Rich hedge via assets, poor suffer most.
Loss of Trust: Citizens lose faith in government and currency.
Social Chaos: Strikes, protests, and riots often follow.
8. Inflation Nightmare in the 2020s Context
COVID-19 pandemic: Stimulus packages + supply bottlenecks fueled inflation.
Russia-Ukraine War: Spikes in oil, gas, and food prices globally.
Climate Change: Crop failures push food inflation higher.
De-dollarization debates: Weakening confidence in traditional reserve currencies.
Countries like Sri Lanka (2022) faced an inflation nightmare with shortages of fuel, medicine, and food—leading to political collapse.
9. Coping Mechanisms during an Inflation Nightmare
(a) Individual Level
Shift savings to inflation-protected assets (gold, real estate, equities).
Cut discretionary spending.
Focus on skills that secure wage growth.
(b) Business Level
Hedge raw material costs.
Diversify suppliers.
Innovate with technology to reduce costs.
(c) Government Level
Tight monetary policy (raise interest rates).
Fiscal discipline (reduce deficit spending).
Strengthen currency reserves.
Subsidies for essentials to protect poor households.
10. Lessons from History
Prevention is better than cure: Once hyperinflation starts, it is hard to stop.
Trust is key: Currency depends on people’s confidence.
Independent central banks are vital for credibility.
Diversification of economy prevents over-dependence (like Venezuela on oil).
Conclusion
An inflation nightmare is more than rising prices—it is the collapse of trust in money itself. History shows how devastating it can be, destroying middle-class security, collapsing businesses, and reshaping politics.
While moderate inflation is a sign of growth, uncontrolled inflation can become a nightmare—haunting economies for decades. The key lies in responsible policies, diversified economies, and resilient households.
Just like nightmares disturb our sleep, inflation nightmares disturb the dream of economic stability.
Harmonic Patterns
Divergence SecretsIntroduction to Options Trading (Educational Foundation)
Options are one of the most important financial instruments available in modern markets. For a beginner, understanding them may feel overwhelming at first, but with the right approach, they can become a powerful tool for investment, speculation, and risk management.
An option is a financial contract that gives its holder the right (but not the obligation) to buy or sell an asset, such as a stock, at a predetermined price, within a fixed time frame.
There are two major types of options:
Call Option – Provides the right to buy the underlying asset at a fixed price (called the strike price).
Put Option – Provides the right to sell the underlying asset at a fixed price.
For example:
Imagine you believe Infosys stock, currently at ₹1600, will rise soon. Instead of buying the stock directly, you can buy a call option with strike ₹1650. If Infosys rises to ₹1700, your option increases in value, and you earn profit without investing the full cost of shares.
This flexibility is what makes options attractive—but also dangerous if used without proper strategies.
Why Beginners Need Strategies Instead of Random Trades
Options can generate huge profits, but they can also cause significant losses. Many beginners are tempted to “buy cheap options” hoping for quick riches. Unfortunately, statistics show that most lose money in the long run.
The reasons are:
Options lose value with time decay (Theta).
Market moves are unpredictable; random bets rarely succeed.
Beginners underestimate risk exposure.
That’s why structured strategies are necessary. A strategy gives:
Clarity – A defined plan for entry and exit.
Risk management – Limited losses instead of unlimited risk.
Flexibility – Ability to profit in different market conditions (bullish, bearish, sideways, or volatile).
In education terms: A strategy is like a map. Just as students need a study plan to pass exams, traders need strategies to succeed in markets.

Part 1 Support and ResistenceLong Straddle (High Volatility Bet)
Best for: Beginners who expect big move but don’t know direction.
Market Outlook: High volatility (e.g., before results, elections).
How it works:
Buy a call and a put at same strike price.
Example:
Nifty at 22,000.
Buy 22,000 call at ₹150.
Buy 22,000 put at ₹160.
Total cost = ₹310.
If Nifty moves strongly (up or down), one option gives profit. If Nifty stays flat, you lose premium.
✅ Pros: Profit in any direction.
❌ Cons: Expensive, loses money in sideways market.
Long Strangle (Cheaper Volatility Bet)
Similar to straddle but uses different strike prices.
Example: Buy 21,800 put + 22,200 call.
Cheaper than straddle but requires bigger move for profit.
Iron Condor (Sideways Market Strategy)
Best for: Beginners who think market will stay in range.
Market Outlook: Neutral.
How it works:
Sell an out-of-the-money call.
Buy a further out-of-the-money call.
Sell an out-of-the-money put.
Buy a further out-of-the-money put.
This creates a “range” where you earn profit.
✅ Pros: Works best in stable market.
❌ Cons: Complicated, limited profit.

Part 2 Master Candlestick PatternIntroduction to Options Trading (Basics)
Options trading is one of the most exciting areas in the stock market. Unlike buying and selling shares directly, options allow traders to control a stock without owning it fully. This gives leverage (more exposure with less money), but it also carries risks.
An option is a contract that gives you the right (but not the obligation) to buy or sell a stock at a certain price before a certain date.
Call Option: Right to buy at a fixed price (strike price).
Put Option: Right to sell at a fixed price.
For example:
Suppose Reliance stock is ₹2500. You buy a call option with strike price ₹2600 (expiry in one month). If Reliance goes up to ₹2800, your option value rises, and you make profit without investing huge capital.
Options can be used in different ways:
To speculate (bet on direction)
To hedge (protect investments)
To earn income (through writing options)
But for beginners, blindly speculating with options is risky. That’s why strategies are important—they give a structured approach to trading instead of gambling.
Why Beginners Need Strategies Instead of Random Trades
Most new traders jump into options because they see “quick profits.” However, around 80-90% of beginners lose money in options. The main reason is lack of planning.
Here’s why strategies matter:
Risk Control: Options have unlimited loss potential if traded recklessly. Strategies limit risk.
Consistent Approach: Instead of random bets, strategies follow defined rules.
Flexibility: Strategies allow traders to profit in different market conditions (up, down, sideways).
Capital Efficiency: Beginners usually have limited funds; strategies help them maximize capital use.
Example:
Instead of buying a random call option (which can expire worthless), a beginner can use a bull call spread, reducing risk while still having profit potential.

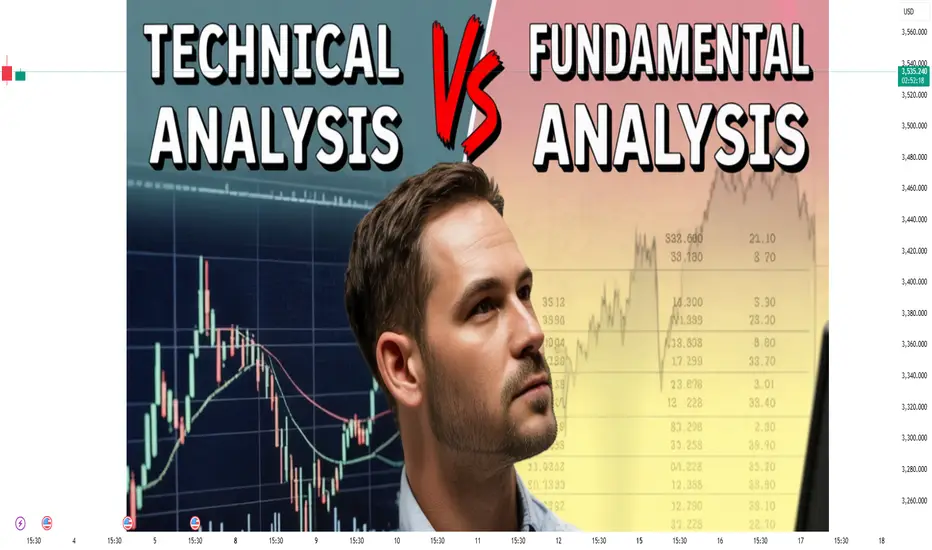
Technical Analysis and Fundamental AnalysisIntroduction
In the world of financial markets—whether equities, commodities, currencies, or bonds—two primary schools of thought dominate the decision-making process of traders and investors: technical analysis (TA) and fundamental analysis (FA). Both are distinct in methodology and philosophy, yet they share a common goal: to forecast future price movements and identify profitable opportunities.
Technical analysis focuses on price action, charts, patterns, and market psychology, whereas fundamental analysis centers on intrinsic value, economic indicators, company performance, and long-term outlooks. Traders and investors often debate which approach is superior, but in practice, many combine elements of both to create a more holistic strategy.
This essay provides an in-depth exploration of technical and fundamental analysis, covering their history, principles, tools, strengths, weaknesses, and practical applications.
Part 1: Technical Analysis
1.1 What is Technical Analysis?
Technical analysis is the study of historical price data and volume to forecast future market movements. Unlike fundamental analysis, it does not concern itself with “why” the price moves, but rather “how” it moves. The basic premise is that market action discounts everything, meaning all known information—economic, political, psychological—is already reflected in the price.
Traders using technical analysis believe that patterns repeat over time due to human behavior and market psychology. By analyzing charts, they aim to identify trends and capitalize on them.
1.2 History of Technical Analysis
The roots of TA trace back to Charles Dow, co-founder of the Wall Street Journal and the Dow Jones Industrial Average. His writings in the late 19th century evolved into what we now know as Dow Theory.
Japanese rice traders developed candlestick charting in the 1700s, which still plays a major role in modern trading.
Over time, charting techniques evolved into a sophisticated discipline supported by algorithms and computers.
1.3 Core Principles of Technical Analysis
Market Discounts Everything
All available information is already reflected in the price.
Price Moves in Trends
Markets follow trends—uptrend, downtrend, or sideways—and these trends are more likely to continue than reverse.
History Repeats Itself
Patterns of market behavior tend to repeat because human psychology does not change.
1.4 Tools of Technical Analysis
(a) Charts
Line Charts – simple, connect closing prices.
Bar Charts – show open, high, low, close (OHLC).
Candlestick Charts – visually appealing, show the same OHLC but easier to interpret.
(b) Price Patterns
Continuation Patterns: Flags, Pennants, Triangles.
Reversal Patterns: Head and Shoulders, Double Top/Bottom, Cup and Handle.
(c) Indicators and Oscillators
Trend Indicators: Moving Averages (SMA, EMA), MACD.
Momentum Oscillators: RSI, Stochastic Oscillator.
Volatility Indicators: Bollinger Bands, ATR.
Volume Indicators: On-Balance Volume (OBV), Volume Profile.
(d) Support and Resistance
Support: a level where demand outweighs supply, preventing further decline.
Resistance: a level where supply outweighs demand, preventing further rise.
(e) Advanced Tools
Fibonacci Retracement and Extensions.
Elliott Wave Theory.
Ichimoku Cloud.
Volume Profile Analysis.
1.5 Advantages of Technical Analysis
Provides clear entry and exit signals.
Works well for short-term and medium-term trading.
Easy to visualize with charts.
Reflects collective psychology and herd behavior.
1.6 Limitations of Technical Analysis
Subjective interpretation: two analysts may read the same chart differently.
Works best in trending markets, less effective in choppy markets.
False signals can lead to losses.
Relies on past data, which may not always predict future movements.
Part 2: Fundamental Analysis
2.1 What is Fundamental Analysis?
Fundamental analysis evaluates a security’s intrinsic value by examining economic, financial, and qualitative factors. It seeks to answer: Is this stock (or asset) undervalued or overvalued compared to its true worth?
Investors use FA to make long-term decisions, focusing on earnings, growth potential, competitive advantages, management quality, and macroeconomic conditions.
2.2 Core Principles of Fundamental Analysis
Intrinsic Value vs. Market Price
If the intrinsic value is greater than market price → Buy (undervalued).
If the intrinsic value is less than market price → Sell (overvalued).
Economic and Business Cycles Matter
Markets are influenced by GDP growth, inflation, interest rates, and other macroeconomic variables.
Long-Term Focus
Fundamental analysis is best suited for long-term investors, not short-term traders.
2.3 Types of Fundamental Analysis
(a) Top-Down Approach
Starts with the global economy, then narrows to sectors, and finally selects individual companies.
(b) Bottom-Up Approach
Focuses on company-specific factors first, regardless of broader economy or sector.
2.4 Tools of Fundamental Analysis
(a) Economic Indicators
GDP growth, unemployment rates, inflation, interest rates, currency fluctuations.
(b) Industry and Sector Analysis
Porter’s Five Forces model.
Sector growth potential.
(c) Company Analysis
Quantitative Factors (Financial Statements)
Income Statement (revenue, profit, margins).
Balance Sheet (assets, liabilities, equity).
Cash Flow Statement.
Financial Ratios: P/E, P/B, ROE, ROA, Debt-to-Equity, etc.
Qualitative Factors
Management quality.
Competitive advantage (moat).
Brand value, innovation, customer loyalty.
(d) Valuation Models
Discounted Cash Flow (DCF).
Dividend Discount Model.
Price-to-Earnings and other multiples.
2.5 Advantages of Fundamental Analysis
Provides deep insights into intrinsic value.
Helps long-term investors make informed decisions.
Identifies undervalued and overvalued opportunities.
Considers broader economic and company-specific realities.
2.6 Limitations of Fundamental Analysis
Time-consuming and requires access to reliable data.
Assumptions in valuation models can be subjective.
Does not provide short-term entry/exit signals.
Markets can remain irrational longer than expected.
Part 3: Technical vs. Fundamental Analysis
Feature Technical Analysis Fundamental Analysis
Focus Price action, charts, patterns Intrinsic value, financial health
Time Horizon Short-term to medium-term Long-term
Tools Used Indicators, oscillators, chart patterns Financial statements, ratios, DCF
Philosophy “Price discounts everything” “Price may diverge from true value”
Strengths Timing trades, market psychology Identifying strong companies/assets
Weaknesses Subjective, false signals Time-consuming, subjective assumptions
Part 4: Practical Applications
4.1 Traders Using Technical Analysis
Day traders, scalpers, and swing traders rely heavily on technicals.
Example: A trader identifies bullish divergence in RSI and enters a long position.
4.2 Investors Using Fundamental Analysis
Long-term investors like Warren Buffett use FA to buy undervalued companies.
Example: Buying a company with consistent free cash flow, strong moat, and low debt.
4.3 Combining Both Approaches (Techno-Fundamental)
Many professionals combine both methods:
Use fundamental analysis to select strong companies.
Use technical analysis to time entry and exit points.
Part 5: Case Studies
Case Study 1: Reliance Industries (India)
FA View: Strong business diversification, consistent earnings growth, high market share in telecom and retail.
TA View: Technical breakout from a consolidation zone often triggers big moves.
Outcome: FA supports long-term investment, TA helps with timing.
Case Study 2: Tesla (US)
FA View: High valuation multiples, but strong growth prospects in EV industry.
TA View: Volatile price patterns with frequent trend reversals.
Outcome: Investors may hold long-term based on fundamentals but traders rely on charts to manage risk.
Part 6: Criticism and Debate
Critics of TA argue that past price cannot reliably predict future performance.
Critics of FA argue that intrinsic value is subjective, and markets often misprice assets for extended periods.
In reality, both methods reflect different perspectives: TA focuses on “when” to trade, FA focuses on “what” to trade.
Conclusion
Technical analysis and fundamental analysis are two complementary pillars of market research. While TA is driven by patterns, psychology, and momentum, FA is grounded in data, earnings, and long-term value.
For traders, technical analysis is often the weapon of choice due to its short-term applicability. For investors, fundamental analysis provides the framework for wealth creation over time. However, the most successful market participants often blend the two—using fundamentals to identify what to buy and technicals to determine when to buy or sell.
In the ever-evolving financial markets, neither approach guarantees success. Markets are influenced by countless variables—economic, geopolitical, and psychological. But by understanding both technical and fundamental analysis deeply, one can develop a balanced perspective and navigate uncertainty with greater confidence.
FII and DII: The Backbone of Indian Capital Markets1. Introduction
The Indian stock market is one of the most dynamic and closely watched financial markets in the world. Every day, billions of rupees are traded, with share prices moving up and down in response to domestic and international events. Behind these movements lie the activities of two important groups of investors: Foreign Institutional Investors (FII) and Domestic Institutional Investors (DII).
While retail investors, high-net-worth individuals (HNIs), and proprietary traders also play an important role, FIIs and DIIs often act as the market movers. Their investment decisions not only influence short-term market trends but also shape the long-term growth of the financial ecosystem.
In this write-up, we will cover the concepts of FII and DII, their differences, importance, regulatory framework, market impact, historical trends, pros and cons, and their role in shaping India’s economic future.
2. Understanding FII (Foreign Institutional Investors)
2.1 Definition
Foreign Institutional Investors (FIIs) are investment institutions or entities registered outside India that invest in Indian financial markets. These include:
Pension funds
Hedge funds
Sovereign wealth funds
Insurance companies
Mutual funds
Investment banks
FIIs enter Indian markets with the objective of generating returns, benefiting from India’s growth story, and diversifying their global portfolio.
2.2 Role in the Market
They bring foreign capital into the country.
Improve liquidity by trading in large volumes.
Provide global perspective in terms of valuation and growth potential.
Help Indian markets integrate with the global financial system.
2.3 Types of FIIs
Foreign Portfolio Investors (FPIs): Invest mainly in stocks, bonds, and derivatives without having controlling stakes.
Foreign Direct Investors (FDI entities): Unlike FPIs, they invest for ownership and long-term control (factories, joint ventures, etc.).
Sovereign Wealth Funds (SWFs): Government-owned investment vehicles.
Hedge Funds & Private Equity Funds: High-risk, high-return players.
3. Understanding DII (Domestic Institutional Investors)
3.1 Definition
Domestic Institutional Investors (DIIs) are investment institutions incorporated within India that invest in Indian markets. Examples include:
Indian mutual funds
Insurance companies (LIC, ICICI Prudential, HDFC Life, etc.)
Banks
Pension funds (EPFO, NPS)
Indian financial institutions
3.2 Role in the Market
Provide stability to the market during volatile phases.
Act as a counterbalance to FIIs.
Channelize domestic savings into productive assets.
Support government disinvestment programs (for example, DIIs buying stakes in PSUs).
3.3 Sources of Funds for DIIs
Household savings through SIPs and insurance premiums.
Contributions to provident funds and pension schemes.
Long-term institutional reserves.
4. Difference Between FII and DII
Aspect FII (Foreign Institutional Investors) DII (Domestic Institutional Investors)
Origin Outside India Within India
Nature of Capital Foreign inflows Domestic savings
Impact Short-term market movers, high volatility Provide long-term stability
Currency Risk Subject to forex fluctuations No currency risk
Motivation Purely profit-driven Mix of profit motive & national economic interest
Regulation SEBI + RBI + FEMA regulations SEBI + Indian financial regulators
Market Behavior Highly sensitive to global cues (US Fed policy, crude oil prices, dollar index, etc.) More sensitive to domestic economy (inflation, fiscal policies, RBI policy, etc.)
5. Regulatory Framework
5.1 Regulation of FIIs
Securities and Exchange Board of India (SEBI): Registration and compliance.
Reserve Bank of India (RBI): Foreign exchange rules under FEMA.
Limits on investment: Sectoral caps (e.g., banks, defense, telecom).
5.2 Regulation of DIIs
SEBI: Oversees mutual funds, insurance companies, and pension funds.
IRDAI: Regulates insurance companies.
PFRDA: Governs pension funds.
RBI: Regulates banking institutions.
6. Importance of FIIs in India
Liquidity Provider: FIIs inject huge volumes of foreign capital.
Valuation Benchmarking: Their global comparison of valuation metrics helps align Indian markets with international standards.
Rupee Strength: FII inflows support India’s forex reserves and currency.
Economic Growth: Funds raised by companies through markets are fueled by FIIs.
However, FIIs can also exit quickly, causing sharp falls.
7. Importance of DIIs in India
Counterbalance to FIIs: When FIIs sell, DIIs often buy, preventing market crashes.
Utilization of Household Savings: Converts Indian savings into stock market capital.
Long-term Focus: Unlike FIIs, DIIs are not quick to exit.
Support in Government Policies: DIIs participate in PSU disinvestment.
8. Historical Trends: FII vs DII in Indian Markets
2003–2008: FIIs were dominant, driving the bull run before the global financial crisis.
2008–09 Crisis: FIIs pulled out massively, leading to a crash. DIIs helped stabilize.
2013: "Taper tantrum" – FIIs exited due to US Fed tightening.
2016 Demonetization & GST era: FIIs cautious, DIIs (via mutual fund SIP boom) became strong.
2020 COVID Crash: FIIs sold aggressively, but DIIs bought the dip.
2021–22 Bull Run: Both FIIs and DIIs invested heavily.
2022 Russia-Ukraine War & US Fed hikes: FIIs sold; DIIs supported the market.
9. Market Impact of FIIs and DIIs
Short-term trends: Often dictated by FII activity.
Long-term growth: Driven by DII investments.
Volatility: Sharp swings occur when FII flows are large.
Index levels: FIIs have a heavy influence on NIFTY, Sensex due to large-cap focus.
10. Pros and Cons of FII and DII
Pros of FIIs
Bring foreign capital.
Enhance market efficiency.
Create global visibility for Indian companies.
Cons of FIIs
Can cause volatility.
Sensitive to global events.
Currency depreciation risks.
Pros of DIIs
Provide stability.
Channelize domestic wealth.
Long-term focus.
Cons of DIIs
Limited fund pool compared to FIIs.
Sometimes influenced by government policies.
Conclusion
The interplay between Foreign Institutional Investors (FIIs) and Domestic Institutional Investors (DIIs) is the heartbeat of India’s capital markets. While FIIs provide the oxygen of foreign capital and liquidity, DIIs act as the backbone of resilience and stability. Together, they create a balanced ecosystem where volatility is managed, growth is fueled, and investor confidence is nurtured.
For retail investors, closely tracking FII and DII activity can provide deep insights into market direction. For policymakers, balancing both sources of funds ensures that India’s financial markets remain globally competitive yet domestically stable.
In the future, as India’s economy grows and becomes more integrated with the global financial system, the partnership of FIIs and DIIs will play a decisive role in shaping India’s financial destiny.

Part 9 Trading Masterclass With ExpertsIntroduction to Options
An option is a type of derivative contract. A derivative derives its value from an underlying asset, which could be a stock, index, commodity, currency, or bond. When you buy or sell an option, you don’t directly own the asset but instead own the right to buy or sell it at a pre-agreed price within a specific period.
At its core, an option is a contract between two parties:
The buyer (holder) of the option, who pays a premium for rights.
The seller (writer) of the option, who receives the premium and carries obligations.
Unlike shares, where ownership is straightforward, options deal with probabilities, rights, and conditions. This makes them flexible but also more complex.
Key Features of Options
Before diving deeper, let’s simplify the main features:
Underlying Asset – The financial instrument on which the option is based (e.g., Reliance Industries stock, Nifty50 index).
Strike Price (Exercise Price) – The price at which the underlying asset can be bought or sold.
Expiration Date (Maturity) – The last date the option can be exercised.
Option Premium – The cost of buying the option, paid upfront by the buyer to the seller.
Right but Not Obligation – The buyer can choose to exercise the option but is not compelled to.

Part 7 Trading Masterclass With ExpertsOptions Greeks and Their Role
Every strategy depends heavily on the Greeks:
Delta: Sensitivity to price changes.
Gamma: Rate of change of delta.
Theta: Time decay of option value.
Vega: Sensitivity to volatility.
Rho: Sensitivity to interest rate changes.
Traders use Greeks to fine-tune strategies and manage risk exposure.
Risk Management in Options
Risk control is crucial. Key principles:
Never risk more than you can afford to lose.
Use spreads instead of naked options.
Monitor Greeks daily.
Diversify across strikes and expiries.
Set stop-loss and exit plans.

Part 6 Institutional Trading Advanced & Professional Strategies
(a) Butterfly Spread
Combination of 3 strike prices (buy 1 low strike call, sell 2 middle strike calls, buy 1 high strike call).
Profits from minimal price movement.
(b) Calendar Spread
Sell near-term option and buy long-term option at the same strike.
Profits from time decay difference.
(c) Ratio Spread
Buy 1 option, sell 2 options at different strikes.
Increases reward potential but adds risk.
(d) Box Spread
Arbitrage-like strategy combining bull and bear spreads.
Used by professionals for risk-free returns (if pricing inefficiency exists).

Part 3 Institutional Trading Popular Basic Strategies
(a) Covered Call
Buy the underlying stock and sell a call option.
Used to earn extra income if you already own shares.
Risk: Stock price falls.
Reward: Premium + limited upside.
(b) Protective Put
Buy stock and simultaneously buy a put option.
Acts like insurance — protects against downside risk.
Example: If you own TCS stock at ₹3500, buy a 3400 put.
Risk: Premium paid.
Reward: Unlimited upside with limited downside.
(c) Long Call
Buy a call option expecting the price to rise.
Limited risk (premium paid), unlimited reward.
Example: Buy Nifty 20,000 CE at 100 premium.
(d) Long Put
Buy a put option expecting a fall in price.
Limited risk (premium), large profit potential in downturns.

Part 1 Ride The Big Moves Introduction to Options Trading
Options are one of the most versatile financial instruments in modern markets. Unlike stocks, where you directly buy or sell ownership in a company, options give you the right but not the obligation to buy (Call Option) or sell (Put Option) an underlying asset at a predetermined price within a specific period.
What makes options special is their flexibility. They allow traders to speculate, hedge, or generate income depending on market conditions. This versatility leads to the creation of numerous option trading strategies — each designed to balance risk and reward differently.
Understanding these strategies is crucial because trading options blindly can lead to substantial losses. Proper strategies help traders make calculated decisions, limit risk exposure, and maximize potential returns.
Basic Concepts in Options
Before diving into strategies, let’s clarify some key terms:
Call Option: Gives the holder the right (not obligation) to buy an asset at a specific strike price before expiry.
Put Option: Gives the holder the right (not obligation) to sell an asset at a specific strike price before expiry.
Strike Price: The pre-agreed price at which the option can be exercised.
Premium: The price paid to buy the option contract.
Expiry Date: The last date when the option can be exercised.
In-the-Money (ITM): When exercising the option is profitable.
Out-of-the-Money (OTM): When exercising the option is not profitable.
At-the-Money (ATM): When the strike price is equal to the current market price.
Options strategies are built by combining calls, puts, and underlying assets in different proportions.

Swing Trading in IndiaIntroduction
Trading in financial markets can take several forms – from ultra-fast intraday scalping to long-term investing. Somewhere in the middle lies swing trading, a popular strategy used by thousands of Indian traders. Swing trading involves holding positions for a few days to a few weeks, aiming to capture “swings” or price movements within a trend.
In India, swing trading has gained momentum because of:
Rapid growth in retail participation.
Increased availability of market data and technical tools.
Expanding knowledge of trading strategies via online platforms.
For traders who cannot monitor markets minute-by-minute but still want more active involvement than long-term investing, swing trading offers the perfect balance.
This guide will explore the concept, strategies, tools, psychology, regulations, and practical approach to swing trading in India, so you can decide whether it’s the right path for you.
Chapter 1: What is Swing Trading?
Swing trading is a medium-term trading style where traders aim to capture price “swings” within an ongoing trend. Unlike day traders, swing traders don’t close positions within a single session. Unlike long-term investors, they don’t hold for months or years.
Key traits of swing trading:
Holding period: 2 days to 3 weeks (sometimes longer).
Tools: Technical analysis + fundamental triggers.
Objective: Capture 5–20% moves within trends.
Market segments: Stocks, indices, commodities, and even forex (via INR pairs).
Example:
Suppose Reliance Industries is trading at ₹2,500. A swing trader identifies a bullish breakout pattern with potential upside to ₹2,750 over the next two weeks. They buy at ₹2,500 and exit around ₹2,720–2,750, capturing a swing of ₹220–250 per share.
Chapter 2: Swing Trading in the Indian Context
The Indian stock market is unique compared to Western counterparts. Swing traders here face:
Volatility: Indian markets, especially midcaps and smallcaps, are prone to sharp moves – great for swing traders.
Liquidity: Nifty 50 and large-cap stocks offer ample liquidity, reducing slippage.
Sectoral rotation: Money frequently shifts between IT, banking, FMCG, auto, and PSU sectors – providing swing opportunities.
Regulations: SEBI monitors derivatives trading, margin requirements, and insider trading laws. Swing traders need to stay compliant.
In India, swing trading is particularly popular in:
Cash market (equity delivery): Traders hold stocks for days/weeks.
F&O segment: Traders use futures for leverage or options for directional bets.
Commodity markets (MCX): Gold, silver, crude oil are swing-trading favorites.
Chapter 3: Why Swing Trading Appeals to Indians
Less stress than intraday: No need to stare at screens all day.
Higher returns than investing: Captures shorter-term volatility.
Works for part-time traders: Office-goers and students can swing trade with end-of-day analysis.
Multiple strategies possible: From trend-following to reversal trading.
Leverage with control: Futures and options allow amplified gains (though also higher risks).
Chapter 4: Tools & Indicators for Swing Trading in India
1. Chart Types:
Candlestick charts (most popular).
Line or bar charts for trend clarity.
2. Timeframes:
Swing traders often analyze:
Daily charts → primary decision-making.
Weekly charts → trend confirmation.
Hourly charts → fine-tune entries/exits.
3. Popular Indicators:
Moving Averages (20, 50, 200 DMA): Identify trend direction.
Relative Strength Index (RSI): Overbought/oversold levels.
MACD: Trend momentum and crossover signals.
Bollinger Bands: Volatility breakouts.
Volume Profile: Strength of price levels.
4. Support & Resistance:
Key price levels form the backbone of swing trading strategies.
Chapter 5: Swing Trading Strategies for Indian Markets
1. Trend Following Strategy
Buy in uptrend pullbacks; sell in downtrend rallies.
Example: Nifty uptrend → enter on retracement to 20-DMA.
2. Breakout Trading
Identify stocks consolidating in a range.
Buy when price breaks resistance with volume.
Example: HDFC Bank breaking ₹1,700 after long consolidation.
3. Reversal Trading
Catch turning points using RSI divergence or candlestick patterns.
Example: Bullish hammer at support in Infosys after a downtrend.
4. Sector Rotation Strategy
Track money flow between sectors (e.g., IT rally ending, auto sector heating up).
Buy leading stocks in the next favored sector.
5. Swing Trading with Options
Use call options for bullish swings.
Use put options for bearish swings.
Advantage: Limited risk, high reward potential.
Chapter 6: Risk Management in Swing Trading
Risk management separates professionals from gamblers.
Position Sizing: Never risk more than 1–2% of capital per trade.
Stop Losses: Always define exit levels. Example: Buy at ₹1,000 → SL ₹950.
Risk-to-Reward Ratio: Target minimum 1:2 or better.
Diversification: Avoid overexposure to a single stock or sector.
Avoid Overnight Leverage in F&O: Gap-ups or gap-downs can destroy capital.
Chapter 7: Psychology of Swing Trading
Trading is 70% psychology, 30% strategy.
Patience: Wait for setups; don’t force trades.
Discipline: Stick to stop-losses and profit targets.
Detachment: Don’t fall in love with stocks.
Consistency: Small, steady profits beat big, inconsistent wins.
Chapter 8: Regulatory & Tax Considerations in India
SEBI Regulations: Ensure you’re compliant with margin rules and leverage restrictions.
Brokerage Charges: Delivery, intraday, and F&O charges vary. Choose wisely.
Taxation:
Profits from swing trading are considered short-term capital gains (STCG) → taxed at 15%.
If classified as business income (frequent trading), normal slab rates may apply.
Keep detailed records for filing.
Chapter 9: Swing Trading Example in India
Imagine you spot Tata Motors consolidating between ₹850–₹880 for two weeks. A breakout above ₹880 with heavy volume suggests bullish momentum.
Entry: Buy at ₹885.
Stop Loss: ₹850 (support).
Target: ₹950 (next resistance).
Holding Period: 7–12 trading days.
Outcome: If target achieved, you gain ₹65/share. With 200 shares, profit = ₹13,000.
Chapter 10: Common Mistakes Indian Swing Traders Make
Chasing stocks after news-driven rallies.
Ignoring broader market trends (Nifty/Sensex direction).
Overusing leverage in F&O.
Constantly shifting strategies.
Emotional decision-making during volatility.
Conclusion
Swing trading in India offers an exciting middle ground between long-term investing and high-stress intraday trading. With the right blend of technical knowledge, discipline, risk management, and patience, swing traders can consistently extract profits from the market.
But remember: swing trading is not gambling. It’s about planning trades, managing risks, and letting the market do its job. Success doesn’t come overnight – but with dedication, Indian traders can thrive in this style.
High Frequency Trading (HFT)Chapter 1: What is High Frequency Trading?
High Frequency Trading (HFT) is a subset of algorithmic trading that uses powerful computer systems and high-speed data networks to execute trades at extremely fast speeds—often in fractions of a second.
Key characteristics of HFT include:
Ultra-fast execution: Trades are placed and canceled in microseconds.
High order volume: Thousands of orders are placed daily, though most are canceled before execution.
Short holding periods: Trades last seconds or less. Unlike long-term investors, HFT firms hold securities for very brief periods.
Market-making role: Many HFT strategies focus on providing liquidity by constantly buying and selling.
Profit from tiny spreads: Instead of making large profits per trade, HFT firms profit from small spreads, repeated thousands of times a day.
In simple terms, HFT is about turning fractions of a cent into big profits by trading at lightning speed.
Chapter 2: The Evolution of High Frequency Trading
1. Early Days of Trading
In the 1980s and 1990s, most trading was still manual. Orders were shouted on trading floors.
The introduction of electronic exchanges like NASDAQ in the U.S. began shifting trading to computers.
2. Rise of Algorithmic Trading
By the early 2000s, algorithms started replacing human traders in executing orders.
These algorithms could split large orders, reduce costs, and minimize market impact.
3. Birth of HFT
In the mid-2000s, faster data networks and co-location services (placing servers directly next to exchange servers) gave rise to High Frequency Trading.
By 2009, it was estimated that over 60% of U.S. equity trading volume came from HFT.
4. Current State
Today, HFT is used globally across equities, futures, options, and even forex markets.
Firms spend billions on technology infrastructure to gain even nanosecond advantages.
Chapter 3: How Does High Frequency Trading Work?
HFT relies on three essential pillars:
1. Technology Infrastructure
Colocation: Placing servers physically near stock exchange servers to reduce transmission time.
Fiber-optic and microwave networks: Data is transmitted at near-light speed between exchanges.
Supercomputers and low-latency systems: Capable of processing massive data and placing orders instantly.
2. Algorithms
Algorithms are the “brains” of HFT. They analyze market data, identify opportunities, and place trades automatically.
These algorithms are designed to spot inefficiencies that exist only for milliseconds.
3. Market Data Access
HFT firms subscribe to direct market feeds, receiving real-time price updates faster than ordinary traders.
They use this information to predict short-term price movements.
Chapter 4: Key Strategies in HFT
1. Market Making
HFT firms continuously post buy (bid) and sell (ask) orders.
They profit from the bid-ask spread.
Example: Buying a stock at $50.01 and selling at $50.02.
2. Arbitrage
Exploiting small price differences across markets.
Types include:
Exchange Arbitrage: Price difference between two stock exchanges.
Statistical Arbitrage: Using mathematical models to predict relationships between securities.
Index Arbitrage: Profit from differences between a stock and its index value.
3. Momentum Ignition
Algorithms detect trends and push prices in a certain direction, profiting from momentum.
4. Liquidity Detection
Algorithms try to identify large institutional orders and trade ahead of them.
5. Latency Arbitrage
Exploiting delays in price reporting between exchanges.
Chapter 5: Benefits of High Frequency Trading
Supporters argue that HFT improves markets in several ways:
Liquidity Provision: HFT firms make markets more liquid by constantly buying and selling.
Tighter Spreads: Increased competition reduces the cost of trading for all investors.
Efficiency: HFT ensures that prices reflect available information faster.
Market Access: Investors can execute trades quicker and at better prices.
Cost Reduction: By automating trading, HFT reduces brokerage and transaction costs.
Chapter 6: Criticisms and Risks of HFT
Despite benefits, HFT is controversial. Critics highlight:
Unfair Advantage
Retail and institutional investors cannot compete with nanosecond speeds.
HFT creates a two-tier market where “fast traders” dominate.
Market Manipulation
Some HFT practices resemble manipulation (e.g., “spoofing” where fake orders are placed to mislead).
Flash Crashes
In May 2010, the U.S. stock market experienced a “Flash Crash”, where the Dow dropped nearly 1,000 points in minutes before recovering. HFT was partly blamed.
Liquidity Mirage
Liquidity provided by HFT can disappear instantly during stress, making markets unstable.
Systemic Risk
Reliance on algorithms means errors can cause massive disruptions.
Chapter 7: Regulation of HFT
Governments and regulators have introduced rules to address risks:
U.S. SEC and CFTC
Monitoring HFT firms closely.
Requiring disclosure of algorithmic strategies.
European Union (MiFID II)
Demands HFT firms be properly registered.
Introduces circuit breakers to prevent flash crashes.
India (SEBI)
Introduced co-location services but with strict monitoring.
Considering minimum resting times for orders to reduce excessive cancellations.
Circuit Breakers Worldwide
Exchanges use automatic halts to prevent market meltdowns.
Chapter 8: Case Studies
1. The 2010 Flash Crash
The Dow Jones dropped 9% in minutes.
HFT amplified the crash by withdrawing liquidity.
2. Knight Capital Incident (2012)
A trading algorithm malfunction cost Knight Capital $440 million in 45 minutes.
Highlighted risks of poorly tested algorithms.
3. India’s NSE Co-location Controversy
Certain brokers allegedly received faster data access.
Raised questions about fairness in Indian markets.
Chapter 9: HFT and Global Markets
HFT is not limited to the U.S. It is now common across:
Europe: Major in London, Frankfurt, Paris.
Asia: Japan, Singapore, and India are growing hubs.
Emerging Markets: As technology spreads, HFT is entering Brazil, South Africa, etc.
Each market has its own regulations, but the global trend is clear: HFT is becoming a dominant force in financial markets worldwide.
Chapter 10: The Future of HFT
The future of High Frequency Trading is shaped by:
Artificial Intelligence & Machine Learning
Algorithms will become more adaptive and predictive.
Quantum Computing
Could reduce processing time further, creating ultra-fast HFT.
Tighter Regulations
Governments may impose stricter controls to protect investors.
Global Expansion
HFT will penetrate deeper into developing markets.
Ethical Debate
Questions about fairness will continue, especially with retail investor growth.
Chapter 11: Ethical and Social Considerations
Fairness vs Innovation: Should markets reward speed over analysis?
Social Value: Does HFT add value to society or only enrich a few?
Job Impact: Replacing human traders with algorithms.
Trust in Markets: Too much reliance on HFT could erode investor confidence.
Conclusion
High Frequency Trading is one of the most transformative developments in modern finance. It merges finance, mathematics, computer science, and telecommunications into a single ecosystem where speed is money.
To its supporters, HFT is a vital innovation—improving liquidity, reducing costs, and making markets more efficient.
To its critics, it is a dangerous distortion—favoring the few, destabilizing markets, and risking systemic failures.
The reality likely lies in between. HFT is here to stay, but it requires responsible regulation, ethical oversight, and technological safeguards to ensure it serves the broader economy.
Ultimately, High Frequency Trading reflects the story of modern markets: a race for speed, efficiency, and profit—where technology shapes the future of finance.

Things Traders Should Avoid1. Ignoring Risk Management
One of the biggest mistakes traders make is trading without a clear risk management plan. Risk management is the backbone of trading. Without it, even the best strategies will eventually fail.
Key Errors to Avoid:
Over-leveraging: Using high leverage magnifies both profits and losses. Many traders blow up accounts by taking oversized positions.
Not using stop-loss orders: Some traders believe they can manually exit trades at the right time. In reality, markets move too fast, and emotions cloud judgment.
Risking too much on one trade: A common guideline is not to risk more than 1–2% of trading capital per trade. Ignoring this rule can wipe out months of profits in a single mistake.
No position sizing strategy: Jumping into trades with random lot sizes leads to inconsistent results.
👉 Example: Imagine a trader with $10,000 capital risks $5,000 on one trade because they feel “confident.” If the trade goes wrong, half the account is gone. Recovering from such a loss requires a 100% gain, which is extremely difficult.
2. Overtrading
Overtrading happens when traders place too many trades, often driven by greed, boredom, or revenge trading.
Mistakes Within Overtrading:
Chasing the market: Entering trades without proper signals because of fear of missing out (FOMO).
Revenge trading: After a loss, trying to “get back” money quickly by doubling positions.
Trading without rest: Markets will always offer opportunities. Overexposure reduces focus and increases mistakes.
👉 Example: A trader loses $200 on a bad trade. Instead of stopping to analyze the mistake, they place another trade with double the position size, hoping to win back losses. Often, this leads to an even bigger loss.
3. Lack of Trading Plan
Trading without a structured plan is like sailing without a compass. A trading plan defines when to enter, when to exit, how much to risk, and which strategies to follow.
Common Errors:
Random decision-making: Buying or selling based on gut feeling.
No journal keeping: Traders who don’t document their trades cannot identify patterns in their mistakes.
Constantly changing strategies: Jumping from one method to another without giving it time to work.
👉 Example: A trader buys a stock because they “heard on TV it’s going up.” Without entry rules, stop-loss, or profit target, the trade is based purely on luck.
4. Letting Emotions Control Decisions
Trading psychology is often more important than technical skills. Emotional trading leads to poor decisions.
Emotional Traps:
Fear: Prevents traders from taking good trades or causes them to exit too early.
Greed: Leads to holding onto winning positions for too long until profits disappear.
FOMO: Entering trades late because others are profiting.
Ego & overconfidence: Refusing to admit mistakes, holding onto losing trades in the hope they recover.
👉 Example: A trader buys a stock at ₹500, it rises to ₹550, but instead of booking profit, greed makes them wait for ₹600. The stock falls back to ₹480, turning profit into loss.
5. Trading Without Education
Many beginners jump into trading with little knowledge, believing they can “figure it out as they go.” This often ends in losses.
What Traders Avoid Learning:
Market fundamentals: Basic concepts like how interest rates, inflation, or company earnings affect prices.
Technical analysis: Chart patterns, indicators, and price action signals.
Risk-reward ratio: Understanding whether a trade is worth the potential risk.
Brokerage & fees: Ignoring transaction costs that eat into profits.
👉 Example: A new trader hears about “options trading” and buys random call options without knowing how time decay works. Even though the stock moves slightly in their favor, the option premium decays, and they lose money.
6. Relying Too Much on Tips & News
Traders who depend solely on TV channels, social media influencers, or WhatsApp tips rarely succeed.
Mistakes:
Acting on rumors: Many news stories are exaggerated or already priced in.
Not verifying sources: Following random advice without checking fundamentals or technicals.
Late entry: By the time news is public, smart money has already acted.
👉 Example: A trader buys a stock after hearing “strong quarterly results” on TV. But by then, the stock is already up 10%. The trader enters late and suffers when the price corrects.
7. Ignoring Market Trends
Fighting the trend is one of the costliest mistakes. Many traders try to “pick tops and bottoms” instead of riding the trend.
Errors:
Catching falling knives: Buying a stock just because it “has fallen too much.”
Selling too early in a bull run: Going short against strong upward momentum.
Not respecting price action: Ignoring charts that clearly show the trend direction.
👉 Example: During a bull market, a trader repeatedly short-sells thinking “this rally can’t last.” Each time, they lose money as the market keeps moving higher.
8. Poor Time Management
Successful trading requires patience and timing. Rushing into trades or neglecting the right timeframes leads to losses.
Errors:
Day trading without time: Traders with full-time jobs trying to scalp during lunch breaks.
Ignoring timeframes: Using a 1-minute chart for long-term investments or a daily chart for intraday scalps.
Not waiting for setups: Jumping in before confirmation.
👉 Example: A trader sees a stock forming a breakout pattern but enters early. The stock pulls back before breaking out, hitting their stop-loss.
9. Overcomplicating Strategies
Many traders load their charts with 10+ indicators, hoping for a perfect signal. In reality, complexity leads to confusion.
Mistakes:
Indicator overload: RSI, MACD, Bollinger Bands, Stochastic, all at once.
No price action focus: Forgetting that price itself is the ultimate indicator.
Constant tweaking: Changing settings after every losing trade.
👉 Example: A trader waits for five indicators to align before trading. By the time the signals confirm, the price has already moved.
10. Lifestyle & Psychological Habits to Avoid
Trading is not just about charts and strategies—it’s also about mindset and lifestyle.
Mistakes:
Lack of sleep: Fatigue reduces focus and increases impulsive decisions.
Trading under stress: Personal problems or financial pressure cloud judgment.
Unrealistic expectations: Believing trading will double money every month.
Neglecting health: Sitting for hours without breaks affects mental sharpness.
👉 Example: A trader under debt pressure tries to make “quick money” by doubling account size. Stress pushes them into risky trades, worsening the situation.
11. Not Adapting to Market Conditions
Markets are dynamic. A strategy that works in a trending market may fail in a range-bound market.
Errors:
Rigid strategies: Refusing to adapt when volatility changes.
Ignoring global events: Economic data, elections, or geopolitical tensions affect all markets.
No backtesting: Not testing strategies across different conditions.
👉 Example: A trader uses breakout strategies during low volatility. Instead of clean moves, the market fakes out, hitting stop-loss repeatedly.
12. Treating Trading Like Gambling
Trading is about probabilities, not luck. When traders treat it like a casino, losses are inevitable.
Mistakes:
All-in bets: Putting entire capital on one trade.
No analysis: Buying or selling randomly.
Relying on luck: Believing one “big trade” will make them rich.
👉 Example: A trader bets entire account on a penny stock hoping it will double. Instead, the stock crashes, wiping them out.
Conclusion
Trading can be rewarding, but only for those who avoid the common traps. The key things traders should avoid include:
Ignoring risk management
Overtrading
Trading without a plan
Emotional decision-making
Relying on tips and news
Fighting the trend
Poor time management
Overcomplicating strategies
Unrealistic expectations
The markets will always be uncertain. A trader’s job is not to predict perfectly but to manage risk, follow discipline, and protect capital. By avoiding the mistakes outlined above, traders can significantly improve their chances of long-term success.
Trading Master Class With ExpertsWhat are Options? (Basics)
An Option is a financial contract between two parties:
Buyer (Holder): Pays a premium for the right (not obligation) to buy/sell.
Seller (Writer): Receives the premium and has an obligation to honor the contract.
There are two basic types:
Call Option (CE) – Right to buy.
Put Option (PE) – Right to sell.
Example:
Suppose Infosys stock is trading at ₹1500. You buy a Call Option with a strike price of ₹1550 expiring in 1 month. If Infosys goes above ₹1550, you can exercise your right to buy at ₹1550 (cheaper than market). If it doesn’t, you just lose the small premium you paid.
This flexibility is the beauty of options.
Key Terms in Options Trading
Before diving deeper, let’s understand some key terms:
Strike Price: The fixed price at which you can buy/sell the asset.
Premium: The price paid to buy the option.
Expiry Date: The date on which the option contract expires.
Lot Size: Options are traded in lots (e.g., 25 shares per lot for Nifty options).
In-the-Money (ITM): When exercising the option is profitable.
Out-of-the-Money (OTM): When exercising would cause a loss.
At-the-Money (ATM): When the strike price = current market price.
Option Buyer: Pays premium, has limited risk but unlimited profit potential.
Option Seller (Writer): Receives premium, has limited profit but unlimited risk.
Types of Options – Calls and Puts
Call Option (CE)
Buyer has the right to buy.
Profits when the price goes up.
Put Option (PE)
Buyer has the right to sell.
Profits when the price goes down.
Example with Reliance stock (₹2500):
Call Option @ 2600: Profitable if Reliance goes above ₹2600.
Put Option @ 2400: Profitable if Reliance goes below ₹2400.

Part 2 Master Candlestick PatternOptions in Global Markets
US Market: Options on stocks like Apple, Tesla, S&P500.
Europe: Eurex exchange trades DAX options.
India: NSE is Asia’s largest derivatives market.
Global options markets allow hedging and speculation across geographies.
The Psychology of Options Trading
Fear and greed dominate decisions.
Beginners often chase quick profits.
Professionals focus on probabilities, not predictions.
Patience and discipline are key.
Future of Options Trading
Increasing retail participation in India.
Weekly expiries, more instruments expected.
AI & Algo trading to dominate.
More global integration with India’s markets.

Part 1 Master Candlestick PatternOptions vs Stocks/Futures
Stocks: You own a part of the company.
Futures: Obligation to buy/sell in future.
Options: Right, but not obligation, with flexibility.
Common Mistakes by Beginners
Over-leveraging with big lots.
Only buying cheap OTM options.
Ignoring time decay.
Not using stop-loss.
Blindly copying tips without understanding.
Risk Management in Options
Never risk more than 2–5% of capital in one trade.
Use stop-loss orders.
Avoid holding losing options till expiry.
Use spreads to limit risk.
Keep emotions under control.

Option Trading Risks of Options Trading
High Risk for Sellers: Unlimited losses possible.
Complexity: Requires deep understanding.
Time Decay: Options lose value as expiry approaches.
Liquidity Issues: Some contracts may not have enough buyers/sellers.
Over-leverage: Small mistakes can wipe out capital.
Options Pricing
An option’s premium depends on:
Intrinsic Value (IV): Actual profit if exercised now.
Time Value (TV): Extra value due to time left till expiry.
Formula:
Premium = Intrinsic Value + Time Value
Example: Nifty at 20,000
Call @ 19,800 = Intrinsic value 200.
If premium is 250 → Time value = 50.
The Greeks (Advanced Concept)
Options pricing is also affected by "Greeks":
Delta: Sensitivity to price change.
Theta: Time decay effect.
Vega: Impact of volatility.
Gamma: Acceleration of delta.
These help traders understand risks better.

Part 2 Support and ResistanceKey Terms in Options Trading
Before diving deeper, let’s understand some key terms:
Strike Price: The fixed price at which you can buy/sell the asset.
Premium: The price paid to buy the option.
Expiry Date: The date on which the option contract expires.
Lot Size: Options are traded in lots (e.g., 25 shares per lot for Nifty options).
In-the-Money (ITM): When exercising the option is profitable.
Out-of-the-Money (OTM): When exercising would cause a loss.
At-the-Money (ATM): When the strike price = current market price.
Option Buyer: Pays premium, has limited risk but unlimited profit potential.
Option Seller (Writer): Receives premium, has limited profit but unlimited risk.
Types of Options – Calls and Puts
Call Option (CE)
Buyer has the right to buy.
Profits when the price goes up.
Put Option (PE)
Buyer has the right to sell.
Profits when the price goes down.
Example with Reliance stock (₹2500):
Call Option @ 2600: Profitable if Reliance goes above ₹2600.
Put Option @ 2400: Profitable if Reliance goes below ₹2400.

Part 1 Support and ResistanceIntroduction to Options Trading
Trading in the stock market has many forms: buying shares, trading futures, investing in mutual funds, or speculating in commodities. Among all these, Options Trading is one of the most exciting and complex areas.
Options trading gives traders the right, but not the obligation, to buy or sell an underlying asset (like a stock, index, or commodity) at a fixed price before a fixed date.
In simple words:
If you buy a Call Option, you are betting that the price will go up.
If you buy a Put Option, you are betting that the price will go down.
Options give flexibility—traders can profit from rising, falling, or even sideways markets if they use the right strategies. That’s why they are called derivative instruments (their value is derived from an underlying asset).
What are Options? (Basics)
An Option is a financial contract between two parties:
Buyer (Holder): Pays a premium for the right (not obligation) to buy/sell.
Seller (Writer): Receives the premium and has an obligation to honor the contract.
There are two basic types:
Call Option (CE) – Right to buy.
Put Option (PE) – Right to sell.
Example:
Suppose Infosys stock is trading at ₹1500. You buy a Call Option with a strike price of ₹1550 expiring in 1 month. If Infosys goes above ₹1550, you can exercise your right to buy at ₹1550 (cheaper than market). If it doesn’t, you just lose the small premium you paid.
This flexibility is the beauty of options.

Volume in TradingIntroduction
In the world of financial markets, price is often the first thing that traders and investors focus on. We look at whether a stock, commodity, or cryptocurrency is going up or down, and based on that, we make decisions. However, price alone does not tell the full story. To understand whether a price move is strong, weak, reliable, or suspicious, traders look at another crucial element: Volume.
Volume is one of the most powerful and widely used tools in trading. It tells us how much activity is happening in the market—in other words, how many shares, contracts, or units are being bought and sold during a given period. High volume usually signals strong interest and conviction, while low volume suggests hesitation or lack of participation.
In this write-up, we will explore volume in trading from the basics to advanced applications, explaining why it matters, how it is used, and how traders can benefit from interpreting volume correctly.
What is Volume in Trading?
At its simplest, volume refers to the total number of shares, contracts, or units of a security traded within a specific time period. This period could be one minute, one hour, one day, or any timeframe depending on the trader’s focus.
For example:
If 1,000 shares of Reliance Industries are traded on the NSE between 9:15 AM and 9:30 AM, the trading volume for that period is 1,000 shares.
If 10,000 contracts of Nifty futures are exchanged during the day, then the daily futures volume is 10,000 contracts.
In forex or crypto, volume is often measured in terms of lots or tokens.
Key Point:
Volume measures activity. It does not directly tell you whether people are buying or selling more. It only records the number of transactions. For every buyer, there is always a seller—so volume tells us how many times such exchanges happened, not the direction.
Why is Volume Important in Trading?
Volume is like the heartbeat of the market. Without volume, price movements can be misleading or unreliable. Here’s why it matters:
Confirms Price Trends
If a stock is rising but on low volume, the uptrend may not be sustainable. On the other hand, if the stock is rising with high volume, it suggests strong buying interest and a more reliable uptrend.
Identifies Strength of Breakouts
When price breaks above resistance or below support, traders look at volume. A breakout with high volume is more likely to succeed, while a breakout on low volume often fails.
Indicates Market Participation
High volume means many traders are actively participating, which usually reduces manipulation and increases reliability. Low volume may signal lack of interest or potential traps.
Helps Spot Reversals
Sometimes, a sudden spike in volume during an uptrend or downtrend can indicate exhaustion and reversal. For instance, after a long rally, if volume spikes but price fails to rise further, it may signal distribution.
Used in Technical Indicators
Several technical indicators, like On-Balance Volume (OBV), Volume Weighted Average Price (VWAP), and Volume Profile, are built entirely around volume data.
How is Volume Calculated?
The calculation is straightforward:
In stocks, volume is the total number of shares traded in a given time frame.
In futures and options, it is the number of contracts traded.
In forex, volume is often tick volume, which measures how many times the price changes, since centralized volume data is unavailable.
In cryptocurrency, volume is the number of tokens traded across exchanges.
Example:
If Infosys has 20 lakh shares traded on NSE in a day, then the daily volume is 20 lakh.
Relationship Between Price and Volume
To understand market psychology, traders study how volume behaves relative to price. Here are some classic patterns:
Price Up + Volume Up → Bullish Confirmation
Rising price on rising volume shows strong demand and confirms the uptrend.
Price Up + Volume Down → Weak Rally
If price rises but volume falls, it may signal that fewer participants are pushing the price, often leading to reversals.
Price Down + Volume Up → Bearish Confirmation
Falling price with increasing volume confirms strong selling pressure.
Price Down + Volume Down → Weak Decline
Declining prices with low volume suggest lack of strong sellers; the trend may be temporary.
Tools & Indicators Based on Volume
Traders don’t just look at raw volume numbers. They use tools to interpret volume more effectively:
1. On-Balance Volume (OBV)
OBV adds volume on up days and subtracts volume on down days, creating a running total. Rising OBV confirms bullish pressure, while falling OBV confirms bearish pressure.
2. Volume Profile
Volume Profile shows how much volume occurred at different price levels, not just over time. It helps identify support/resistance zones based on where most trading activity happened.
3. VWAP (Volume Weighted Average Price)
VWAP calculates the average price at which a security has traded throughout the day, weighted by volume. Institutional traders often use VWAP as a benchmark for fair value.
4. Accumulation/Distribution Line
This indicator uses both price and volume to detect whether money is flowing into (accumulation) or out of (distribution) a stock.
5. Chaikin Money Flow (CMF)
CMF combines price and volume to measure buying and selling pressure over a certain period.
Volume Patterns in Trading
Volume often reveals patterns that help traders interpret the market:
High Volume at Breakouts
When a stock breaks out of a range with high volume, it confirms a real move.
Low Volume Breakouts
Often fake moves. If volume is weak, the breakout might not sustain.
Volume Spikes
Sudden surges in volume may indicate big institutional activity, news events, or trend reversals.
Volume Dry-Up
When volume dries up after a trend, it may signal exhaustion or upcoming consolidation.
Climax Volume
Near the end of strong trends, volume may spike dramatically, showing panic buying or selling. This often signals reversals.
Practical Applications of Volume
1. Spotting Trend Continuation
If an uptrend continues with increasing volume, traders stay in the trade confidently.
2. Detecting False Moves
Volume helps avoid traps. For example, a stock breaking resistance with weak volume is a red flag.
3. Day Trading with Volume
Intraday traders often use VWAP and relative volume (RVOL) to judge whether momentum trades are worth taking.
4. Long-Term Investing
Investors also watch volume to confirm whether institutions are accumulating or distributing shares.
Volume in Different Markets
Stock Market: Volume shows investor participation. Stocks with higher volumes are more liquid, making them easier to buy/sell.
Futures & Options: Volume indicates interest in contracts. High option volume often highlights where traders expect big moves.
Forex: Since forex is decentralized, traders use tick volume or broker-provided estimates.
Cryptocurrency: Volume is vital because crypto markets are prone to manipulation. Exchanges often report trading volumes to show liquidity.
Examples from Indian Markets
Reliance Industries Breakout
When Reliance broke past ₹2,000 levels in 2020, it was supported by record-high volumes, confirming strong institutional participation.
Bank Nifty Index Futures
During big events like Union Budget, Bank Nifty futures often see surges in volume, confirming traders’ interest and directional bets.
SME IPOs
Many SME stocks in India show thin volumes after listing, making them risky for retail investors due to low liquidity.
Common Mistakes in Interpreting Volume
Assuming High Volume Always Means Bullish
High volume doesn’t always mean buying. It could also be strong selling. Traders must analyze price action alongside volume.
Ignoring Context
Volume must be compared with historical averages. A spike is meaningful only if it is unusual compared to typical activity.
Relying on One Indicator
Volume should confirm price action, not replace it. Relying solely on volume can be misleading.
Advanced Concepts
Relative Volume (RVOL): Compares current volume to average past volume. RVOL > 2 means twice the usual activity.
Volume Divergence: If price rises but volume falls, it warns of weakening trend.
Dark Pools: Large institutional trades may not immediately show in public volume data, so volume analysis is not always perfect.
Psychological Aspect of Volume
Volume reflects human behavior in markets. Rising volume shows enthusiasm, fear, or greed, while falling volume shows apathy or caution. Big volume often comes from institutions, and spotting their footprints helps retail traders align with the “smart money.”
Conclusion
Volume is one of the most essential elements in trading. It is not just a number—it is a window into market psychology and trader participation. By studying volume along with price, traders can confirm trends, identify breakouts, detect reversals, and avoid false signals.
From simple applications like confirming support/resistance breakouts to advanced tools like VWAP and Volume Profile, volume remains a critical guide for traders across stocks, futures, forex, and crypto.
The key lesson is: Price tells you what is happening, but Volume tells you how strong it is.
Together, they form the foundation of smart trading decisions.
Demat & Trading AccountsIntroduction
If you want to invest in the stock market or hold securities in India, two terms you will always come across are Demat Account and Trading Account. These two accounts are like the backbone of modern investing. Without them, buying and selling shares in today’s electronic stock market would be nearly impossible.
Earlier, shares were held in physical form (paper certificates). If you wanted to buy or sell, you had to physically deliver these certificates to the buyer or to the exchange. This process was time-consuming, risky (due to frauds, fake certificates, theft, or loss), and created unnecessary delays. To solve this, India adopted the system of dematerialization (demat) in the 1990s.
Today, all trades in the stock market happen online using these two accounts:
Demat Account → for holding securities electronically.
Trading Account → for buying and selling them through the stock exchange.
This write-up will explore both accounts in detail, explain their importance, features, working, types, and practical role in the Indian stock market.
1. Understanding the Basics
1.1 What is a Demat Account?
A Demat Account (short for Dematerialized Account) is an account that holds your shares, bonds, mutual funds, ETFs, and other securities in electronic format.
Think of it like a bank account, but instead of holding money, it holds your financial securities. When you buy shares, they get credited to your Demat Account. When you sell, they get debited.
Example: If you buy 100 shares of Infosys, instead of getting paper certificates, these 100 shares are electronically stored in your Demat Account.
In India, Demat Accounts are maintained by Depositories:
NSDL (National Securities Depository Limited)
CDSL (Central Depository Services Limited)
These depositories hold securities, while intermediaries called Depository Participants (DPs) (like banks, brokers, or financial institutions) give investors access to open and manage accounts.
1.2 What is a Trading Account?
A Trading Account is an account that allows you to place buy or sell orders in the stock market.
You cannot directly go to NSE or BSE to buy stocks. You need a broker who provides you with a Trading Account.
Through this account, you send orders (like “Buy 10 shares of TCS at ₹3500”) which get executed on the stock exchange.
In simple words:
Trading Account = Interface between you and the stock exchange.
Demat Account = Storage for your securities.
1.3 How Demat & Trading Accounts Work Together
Both accounts are interconnected. Here’s the flow of a transaction:
You place a buy order via your Trading Account.
Money gets debited from your Bank Account.
Shares are transferred into your Demat Account.
Similarly, when you sell shares:
You place a sell order in the Trading Account.
Shares get debited from your Demat Account.
Money gets credited into your Bank Account.
Thus, three accounts are linked:
Bank Account (funds)
Trading Account (market transactions)
Demat Account (holdings)
2. History & Evolution in India
2.1 Before Demat Accounts
Shares were issued in physical form.
Transfer of ownership required endorsement and physical delivery.
Problems: Fake certificates, theft, delays in settlement, bad deliveries.
2.2 Introduction of Demat System
1996: India introduced Dematerialization under SEBI regulation.
First electronic trade took place with NSDL as the main depository.
Later, CDSL was established.
Today, more than 99% of trades in India happen in electronic form.
3. Features of Demat Account
Paperless Holding – No physical certificates, only electronic form.
Multiple Securities – Can hold shares, bonds, ETFs, government securities, mutual funds, etc.
Easy Transfer – Quick transfer of shares during buying/selling.
Safety – Reduces risk of theft, forgery, and loss.
Nomination Facility – You can nominate someone to inherit your securities.
Corporate Benefits – Dividends, bonuses, stock splits, and rights issues are automatically credited.
Accessibility – Can be accessed via online platforms, mobile apps, or brokers.
4. Features of Trading Account
Market Access – Enables buying/selling on NSE, BSE, MCX, etc.
Multiple Segments – Can trade in equity, derivatives (F&O), commodities, and currencies.
Order Types – Market order, limit order, stop-loss order, etc.
Leverage/Margin Trading – Allows intraday and margin trading.
Technology Driven – Mobile apps, algo-trading, advanced charts.
Real-Time Updates – Live prices, executed trades, P&L statements.
5. Types of Demat Accounts
Regular Demat Account – For Indian residents to hold securities.
Repatriable Demat Account – For NRIs, linked with NRE bank account.
Non-Repatriable Demat Account – For NRIs, linked with NRO bank account.
Basic Services Demat Account (BSDA) – For small investors, with low charges.
Corporate Demat Account – For companies and institutions.
6. Types of Trading Accounts
Equity Trading Account – For stocks and equity derivatives.
Commodity Trading Account – For commodities (gold, oil, agricultural products).
Currency Trading Account – For forex trading.
Derivatives Trading Account – For futures and options.
Discount Brokerage Account – For low-cost trading, minimal services.
Full-Service Brokerage Account – With advisory, research, and premium services.
7. Process of Opening Accounts
7.1 Opening a Demat Account
Steps:
Choose a Depository Participant (DP) (bank, broker, NBFC).
Fill application form (KYC).
Submit documents (Aadhar, PAN, photo, bank proof).
Sign agreement with DP.
Get your Demat Account Number (DP ID + Client ID).
7.2 Opening a Trading Account
Steps:
Choose a broker (full-service or discount).
Fill KYC & account opening form.
Link Bank Account and Demat Account.
Get Login ID & Password for online trading.
8. Charges & Costs
Demat Account Charges
Account Opening Fee (some brokers offer free).
Annual Maintenance Charges (AMC).
Transaction Charges (per debit).
Custodian Fee (rare now).
Trading Account Charges
Brokerage Fee (flat fee or percentage).
Transaction Charges (exchange fee).
Securities Transaction Tax (STT).
SEBI Turnover Fees.
GST & Stamp Duty.
9. Advantages of Demat & Trading Accounts
Convenience – Buy/sell in seconds from anywhere.
Safety – No risk of fake/lost certificates.
Transparency – Easy tracking of holdings & trades.
Liquidity – Quick conversion of investments into cash.
Integration – Bank, trading, and demat are linked.
Corporate Benefits – Automatic credit of dividends/bonus.
Access to Multiple Markets – Equity, commodity, currency, derivatives.
10. Risks & Limitations
Technical Failures – System downtime can block trades.
Fraud Risks – If login/password is misused.
Charges – Brokerage and maintenance fees can reduce profits.
Overtrading – Easy access may tempt frequent trading, leading to losses.
Cybersecurity Threats – Hacking of accounts.
11. Role of Demat & Trading Accounts in Indian Stock Market
Helped India move from paper-based to electronic system.
Improved market efficiency and liquidity.
Attracted more retail investors with easy digital access.
Essential for IPOs (Initial Public Offerings) – shares are credited only in Demat form.
Integrated with apps & online platforms (Zerodha, Upstox, Angel One, ICICI Direct, HDFC Securities, etc.).
12. Practical Example
Suppose you want to invest in Reliance Industries:
You log in to your Trading Account and place a buy order for 50 shares.
Money is deducted from your Bank Account.
After settlement (T+1 day), 50 shares appear in your Demat Account.
Later, when Reliance declares a dividend, the amount is directly credited to your Bank Account.
If Reliance issues bonus shares, they are automatically credited to your Demat Account.
This shows the smooth link between all three accounts.
13. Future of Demat & Trading Accounts in India
More digital integration with UPI, AI-based advisory, and robo-trading.
Growth in retail participation due to mobile apps.
Expansion of commodity and global investing options.
Reduced charges with increasing competition among brokers.
Enhanced cybersecurity measures for safer trading.
Conclusion
Demat and Trading Accounts have revolutionized the Indian stock market. They replaced the old paper-based system, making investing faster, safer, and more efficient.
A Demat Account stores your securities.
A Trading Account lets you buy/sell them on exchanges.
Together, they act as the gateway for every investor to participate in the financial markets.
Whether you are a beginner or an experienced trader, understanding these two accounts is the first step toward wealth creation through the stock market.
Types of SharesIntroduction
In the world of finance and investing, shares represent one of the most important building blocks. When an individual or institution buys a share, they are essentially purchasing a small unit of ownership in a company. Shares give investors the right to participate in the profits of the company, attend shareholder meetings, and in some cases, vote on critical business decisions.
For companies, issuing shares is a powerful way to raise funds for growth, expansion, research, or debt repayment. Instead of borrowing from banks, businesses can invite the public to invest by offering shares.
However, not all shares are the same. There are different types of shares—each carrying its own rights, responsibilities, and advantages for both the company and the shareholder. Understanding these types is critical for investors, traders, and business owners.
This detailed discussion explores the various types of shares from multiple perspectives—legal, financial, and practical—while also examining their role in India’s corporate structure and the global financial markets.
What is a Share?
A share is the basic unit into which the capital of a company is divided. It represents fractional ownership in the company. If a company has issued 1,00,000 shares and an investor owns 10,000 shares, they effectively own 10% of the company.
Each share has a face value (original issue price), a market value (price at which it trades), and may provide benefits such as:
Dividends: A share in profits distributed to shareholders.
Voting rights: Power to influence company policies and decisions.
Capital appreciation: Increase in the share price over time.
Broad Classification of Shares
In corporate law, especially under the Companies Act, 2013 (India) and globally under common corporate structures, shares are classified into two major categories:
Equity Shares (Ordinary Shares)
Preference Shares
Let us break these down in detail.
1. Equity Shares
Meaning
Equity shares are the most common type of shares issued by a company. They represent ownership with voting rights and entitle holders to dividends, though dividends are not guaranteed. Equity shareholders bear the highest risk but also enjoy highest rewards in terms of capital appreciation.
Features of Equity Shares
Voting rights in company matters.
Dividend depends on profits and company policies.
Higher risk compared to preference shares.
Residual claim in case of liquidation (paid after creditors and preference shareholders).
Types of Equity Shares
Equity shares can further be divided into subcategories:
(a) Based on Rights
Voting Equity Shares – Normal shares with voting power.
Non-Voting Equity Shares – Shares that do not carry voting rights but may offer higher dividends.
(b) Based on Convertibility
Convertible Equity Shares – Can be converted into another type of security like debentures or preference shares after a specific period.
Non-Convertible Equity Shares – Cannot be converted into any other security.
(c) Based on Dividend Rights
Bonus Shares – Issued free of cost to existing shareholders from accumulated profits.
Rights Shares – Offered to existing shareholders at a discounted price before going to the public.
(d) Based on Listing
Listed Equity Shares – Traded on recognized stock exchanges such as NSE, BSE.
Unlisted Equity Shares – Not traded on stock exchanges; often held privately.
2. Preference Shares
Meaning
Preference shares are a special type of share that gives shareholders a priority claim over dividends and assets in case of liquidation. They are called "preference" because they enjoy preference over equity shares in two key respects:
Dividend distribution
Repayment of capital during liquidation
However, preference shareholders usually do not have voting rights, except in special cases (like non-payment of dividend).
Features of Preference Shares
Fixed dividend rate.
Preference in dividend payment and repayment.
Limited or no voting rights.
Considered safer than equity shares but with limited growth potential.
Types of Preference Shares
Cumulative Preference Shares
If the company cannot pay dividends in a particular year, the unpaid dividend is carried forward to future years.
Non-Cumulative Preference Shares
If the company misses dividend payments, shareholders cannot claim them in the future.
Participating Preference Shares
Allow holders to receive additional dividends if the company makes excess profits.
Non-Participating Preference Shares
Holders receive only a fixed dividend and no share in surplus profits.
Convertible Preference Shares
Can be converted into equity shares after a specific period.
Non-Convertible Preference Shares
Cannot be converted into equity shares.
Redeemable Preference Shares
Can be bought back (redeemed) by the company after a fixed period.
Irredeemable Preference Shares
Cannot be redeemed during the lifetime of the company (rare in practice due to regulations).
Other Types of Shares in Practice
Apart from the primary division between equity and preference shares, companies and markets recognize various special categories of shares:
1. Bonus Shares
Issued free of cost to existing shareholders in proportion to their holdings. For example, a 1:1 bonus issue means one extra share for every share held.
2. Rights Shares
Offered to existing shareholders at a discounted price to raise fresh capital without involving outsiders.
3. Sweat Equity Shares
Issued to employees or directors at a discount or for non-cash consideration, as a reward for their contribution to the company.
4. Treasury Shares
Shares that were issued and later bought back by the company, held in its treasury.
5. DVR (Differential Voting Right) Shares
Shares with different voting rights compared to ordinary equity shares. Example: Tata Motors issued DVR shares in India.
Global Classification of Shares
In international markets, shares may also be classified as:
Common Stock – Equivalent to equity shares in India.
Preferred Stock – Equivalent to preference shares.
Class A, B, C Shares – Different classes with varying voting powers and dividend rights (e.g., Google/Alphabet issues Class A, B, C shares).
Legal & Regulatory Framework (India)
In India, shares are governed by:
Companies Act, 2013
SEBI (Securities and Exchange Board of India) regulations
Stock Exchange Rules (NSE, BSE)
The law specifies:
Companies can issue only two main classes: Equity and Preference.
Special variations (like DVR, sweat equity, bonus, rights) must comply with SEBI guidelines.
Importance of Different Types of Shares
For Companies:
Equity shares help raise permanent capital.
Preference shares provide flexible funding without diluting voting control.
Rights/bonus shares help reward and retain existing investors.
For Investors:
Equity shares provide growth and voting rights.
Preference shares provide stable income with lower risk.
DVRs allow participation with limited voting burden.
Advantages & Disadvantages
Equity Shares
✅ Potential for high returns
✅ Voting rights
❌ High risk during market downturns
❌ No fixed income
Preference Shares
✅ Fixed dividend
✅ Safer than equity
❌ Limited upside potential
❌ No major voting rights
Real-Life Examples
Reliance Industries issues equity shares traded on NSE/BSE.
Tata Motors has issued DVR shares in India.
Infosys rewarded employees with sweat equity shares.
Globally, Alphabet (Google) issues Class A (1 vote/share), Class B (10 votes/share), and Class C (no voting rights) shares.
Conclusion
Shares are not just financial instruments—they are a reflection of ownership, risk-taking, and reward-sharing in a company. From equity shares that drive growth and risk, to preference shares that balance safety and income, and special categories like bonus, rights, DVR, and sweat equity, every type of share has a purpose.
For investors, understanding these types allows better portfolio choices. For companies, it ensures effective fundraising and governance.
In short, shares are the foundation of modern capital markets, enabling wealth creation, corporate growth, and economic development.