Dividend Investing & High-Yield StocksTopic: Dividend Investing & High-Yield Stocks
Slide 1: Introduction to Dividend Investing
What is Dividend Investing?
Dividend investing involves buying shares of companies that regularly pay out a portion of their earnings to shareholders. These payments, called dividends, are usually distributed quarterly and serve as a steady income source.
Why It Matters:
Generates passive income
Offers compounding returns when reinvested
Often signals strong, stable companies
Ideal For:
Long-term investors
Income-focused portfolios
Retirees looking for stable cash flow
Slide 2: Understanding High-Yield Stocks
Definition:
High-yield stocks offer a dividend yield significantly higher than the market average. Yield = Dividend per Share ÷ Share Price.
Pros:
Higher income returns
Potential price appreciation
Strong incentive for holding
Risks:
Yield traps (unsustainable payouts)
Sector-specific concentration (REITs, utilities)
Sensitivity to interest rate changes
Slide 3: Key Metrics to Analyze
1. Dividend Yield – High isn't always better; compare with industry peers.
2. Payout Ratio – % of earnings paid as dividends (ideal: <60%).
3. Dividend History – Consistent and increasing dividends show reliability.
4. Free Cash Flow – Enough cash to support future dividends.
5. Debt Levels – Too much debt may affect dividend sustainability.
Slide 4: Popular High-Yield Sectors
REITs (Real Estate Investment Trusts)
Utilities
Telecom
Energy/Oil & Gas
MLPs (Master Limited Partnerships)
These sectors often have regulated income or asset-backed cash flow streams, making them stable dividend payers.
Slide 5: Example High-Yield Stocks (India & Global)
India:
Coal India
Power Grid Corp
REC Ltd
ITC Ltd
Global:
AT&T
Verizon
Realty Income Corp (O)
Altria Group (MO)
Ensure to check for recent financial updates before investing.
Slide 6: Dividend Growth vs High Yield
Dividend Growth Stocks: Lower yield, but consistent increases (e.g., Infosys, HDFC Bank)
High-Yield Stocks: High immediate income, but riskier if growth lags
Balanced Approach: Combine both types for income and capital growth.
Harmonic Patterns

Advance Institutions Option Trading - Lecture 3Options trading might feel like gambling on a single trade, but informed decisions make it fundamentally different. Reckless trading without a plan can resemble gambling but is not the proper way to trade. With discipline and skill, options trading stands apart from luck-based activities.
Options involve risk and are not suitable for all investors. Certain requirements must be met to trade options. Before engaging in the purchase or sale of options, investors should understand the nature of and extent of their rights and obligations and be aware of the risks involved in investing with options.

Advance Institutions Option Trading - Lecture 4If you're looking for a simple options trading definition, it goes something like this: Options trading gives you the right or obligation to buy or sell a specific security on or by a specific date at a specific price. An option is a contract that's linked to an underlying asset, such as a stock or another security.
Options trading also involves two parties: the holder (buyer) and the writer (sometimes called the seller). Holders are investors who purchase contracts, while writers create them. The holder pays the writer a premium for the right to sell or buy a stock by a certain date.

Advance Institutions Option Trading - Lecture 1Institutional traders are professionals trading for large entities like mutual funds, hedge funds, etc. Oftentimes they will trade options to hedge their positions, but they may also trade options as pure speculation.
Equirus Securities is one of the leading domestic institutional equities brokerage firms in India with more than 180 companies under over coverage and empanelment with almost all domestic institutions and many leading FIIs.

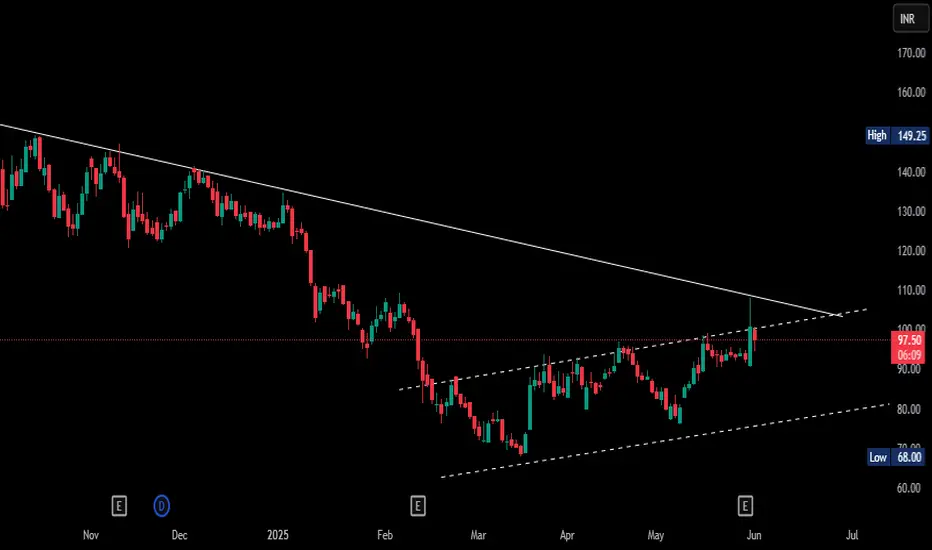
Hidden Line Hepls in Finding Best Brekoutsin this chart analysis we can clearly see that the how a hidden line hepls us to not buy stock on bad entry levels
Technical TradingTechnical trading is a broader style that is not necessarily limited to trading. Generally, a technician uses historical patterns of trading data to predict what might happen to stocks in the future. This is the same method practiced by economists and meteorologists: looking to the past for insight into the future.

Institutional Trading part 6Institutional trading involves large-scale buying and selling of financial instruments, such as stocks, bonds, currencies, and commodities, executed by major organizations like mutual funds, pension funds, insurance firms, and banks.

Divergence SecretsDivergence moves in the opposite direction of the technical indicator.
Divergence occurs when there is a high probability of price retracement.
Divergence analysis is recommended only if you observe double top, double bottom, higher high, and lower low formation.

Institution Trading Strategies part 5Institutional traders incorporate strategies that emphasize both long-term value and diversification in their trading practices. They leverage significant amounts of capital to build portfolios diversified across multiple assets, which helps reduce risk while seeking improved market prices.

Advanced RSI "Advanced RSI" typically refers to strategies or techniques that go beyond the basic interpretation of the Relative Strength Index (RSI) indicator in trading. It involves using the RSI in more sophisticated ways, such as combining it with other indicators, exploring different RSI settings, and identifying advanced trading patterns.

Learn Institutional Level Trading part 6Institutional trading involves the buying and selling of financial instruments for large organizations and entities, like mutual funds, pension funds, and insurance companies, on behalf of their clients or members. These entities trade large volumes, potentially influencing market prices and liquidity.

Learn Institutional Level Trading part 3Trading institutions operate through entities which combine multiple investment funds from investors to invest in financial markets. These firms operate differently from people who maintain brokerage accounts since they oversee massive asset portfolios while their market-shaping trading volume defines their operations.

PCR Trading Strategy part 2Typically, a put-call ratio is a derivative indicator. It is designed to enable traders to determine the sentiment of the options market effectively. This ratio is computed either by factoring in the open interest for a given period or based on the volume of options trading

RSI and RSI Divergence RSI: Divergence appears when the RSI's highs or lows diverge from price. For example, if the price makes new lows but the RSI bottoms at higher levels, it signals bullish divergence; if the price makes new highs but the RSI peaks at lower levels, it signals bearish divergence.

Institution Trading Strategies part 5Institutional traders incorporate strategies that emphasize both long-term value and diversification in their trading practices. They leverage significant amounts of capital to build portfolios diversified across multiple assets, which helps reduce risk while seeking improved market prices.

Institution Trading part 4Institutional trading involves the buying and selling of large quantities of financial assets, typically conducted by institutional investors like hedge funds, mutual funds, and pension funds. These entities manage money for others and trade in securities, including stocks, bonds, and derivatives.

Support and Resistance part 2Support is a price point below the current market price that indicate buying interest. Resistance is a price point above the current market price that indicate selling interest. S&R can be used to identify targets for the trade. For a long trade, look for the immediate resistance level as the target.

Basic to Advance Trading The very best way to get into trading is to find a platform you trust, learn as much as you can about trading beforehand and then practise to get your skill, technique and strategies right. Thereafter, all that remains to be done is to create a trading plan and open a live account.

Divergence Trading Divergence occurs when the stochastic oscillator's peaks or troughs disagree with the price. For instance, if the stochastic makes lower highs while the price is rising, it indicates a bearish divergence. Likewise, higher stochastic lows against lower price lows indicate a bullish divergence.

Price Action Trading Price action trading is a strategy where traders make decisions based on the movement of an asset's price, without relying heavily on technical indicators. It focuses on understanding price patterns, trends, and key levels like support and resistance to anticipate future market direction.

Put and Call RatioThe put-call ratio (PCR) is a technical indicator in options trading that reflects the overall sentiment of the market. It compares the volume of put options traded to the volume of call options traded. Put options give the holder the right to sell an asset at a specific price, while call options give the right to buy it.

Support and Resistance part 1In stock market technical analysis, support and resistance are certain predetermined levels of the price of a security at which it is thought that the price will tend to stop and reverse. These levels are denoted by multiple touches of price without a breakthrough of the level.

What is Moving Average Convergence Divergence (MACD) ?The Moving Average Convergence Divergence (MACD) is a momentum indicator used in technical analysis to identify changes in the strength, direction, momentum, and duration of a trend in a stock or other asset's price. It's essentially a bar chart that visually displays the relationship between two moving averages of a price series.
