Part 1 Trading Master ClassIntroduction to Options Trading
Imagine you want to buy a house. You like one particular property, but you don’t want to commit right away. Instead, you tell the seller:
"Here’s ₹1 lakh. Keep this house reserved for me for the next 6 months. If I decide to buy, I’ll pay you the agreed price. If not, you can keep this ₹1 lakh."
That ₹1 lakh you gave is called a premium. The deal you made is an option — a contract that gives you the right but not the obligation to buy the house.
This is the core idea of options trading: you pay a small premium to get the right to buy or sell something (like stocks, indexes, commodities, etc.) at a fixed price in the future.
What is an Option?
An option is a contract between two parties:
Buyer of option (the one who pays the premium).
Seller of option (the one who receives the premium).
The buyer has the right (but not obligation) to buy or sell at a certain price. The seller has the obligation to fulfill the deal if the buyer exercises the option.
Key Terms:
Underlying Asset → The thing on which the option is based (stocks like Reliance, Infosys, indexes like Nifty, commodities, etc.).
Strike Price → The pre-decided price at which the buyer can buy or sell.
Premium → The cost of buying the option.
Expiry → The last date till which the option is valid.
Lot Size → Options are traded in fixed quantities, not single shares. Example: Nifty options lot = 50 shares.
Harmonic Patterns

Financial Markets1. Introduction
Financial markets are the backbone of modern economies, serving as platforms where individuals, companies, and governments can raise capital, trade financial instruments, and manage risks. They facilitate the flow of funds from surplus units (those with excess capital) to deficit units (those in need of funds), enabling economic growth and development.
At their core, financial markets serve three primary functions:
Price Discovery – determining the price of financial assets through supply and demand.
Liquidity Provision – enabling participants to buy and sell assets easily.
Risk Management – allowing participants to hedge against uncertainties like interest rate changes, inflation, or currency fluctuations.
2. Types of Financial Markets
Financial markets are broadly classified into several categories based on the nature of the assets traded and the maturity of the instruments.
2.1 Capital Markets
Capital markets are where long-term securities, such as stocks and bonds, are bought and sold. They are crucial for channeling savings into productive investments. Capital markets are further divided into:
2.1.1 Stock Markets
The stock market is where equity shares of companies are issued and traded. Equity represents ownership in a company, and investors earn returns through dividends and capital appreciation. Stock markets can be divided into:
Primary Market: Where companies issue new shares through Initial Public Offerings (IPOs) or Follow-on Public Offers (FPOs). It allows companies to raise long-term capital directly from investors.
Secondary Market: Where existing shares are traded among investors. This includes major exchanges like the New York Stock Exchange (NYSE), NASDAQ, and Bombay Stock Exchange (BSE).
Key functions of stock markets:
Facilitating capital formation.
Providing liquidity for investors.
Helping in price discovery and valuation of companies.
2.1.2 Bond Markets
Bond markets, or debt markets, involve the issuance and trading of debt securities such as government bonds, corporate bonds, and municipal bonds. Bonds allow governments and corporations to borrow funds from the public with a promise to repay principal and interest. Types of bonds include:
Government Bonds – low-risk, used to fund national projects.
Corporate Bonds – medium to high-risk, issued by companies for expansion.
Municipal Bonds – issued by local governments to fund infrastructure projects.
2.2 Money Markets
Money markets deal with short-term borrowing and lending, typically with maturities of less than one year. They are essential for managing liquidity and short-term funding needs. Common instruments in money markets include:
Treasury Bills (T-Bills) – short-term government securities.
Commercial Paper (CP) – unsecured, short-term debt issued by corporations.
Certificates of Deposit (CDs) – issued by banks for fixed short-term deposits.
Repurchase Agreements (Repos) – short-term borrowing secured against securities.
Money markets are highly liquid and considered low-risk. They play a crucial role in interest rate determination and monetary policy implementation.
2.3 Derivatives Markets
Derivatives are financial instruments whose value depends on an underlying asset, such as stocks, bonds, currencies, commodities, or indices. They are primarily used for hedging risk, speculation, and arbitrage. Common derivatives include:
Futures Contracts – agreements to buy or sell an asset at a predetermined price on a future date.
Options Contracts – giving the right, but not the obligation, to buy or sell an asset.
Swaps – contracts to exchange cash flows, such as interest rate or currency swaps.
Forwards – customized contracts to buy or sell an asset at a future date.
Derivatives markets help stabilize prices, manage risk, and improve market efficiency.
2.4 Foreign Exchange (Forex) Markets
The forex market is the global marketplace for trading currencies. It determines exchange rates and facilitates international trade and investment. Key participants include central banks, commercial banks, hedge funds, multinational corporations, and retail traders. The forex market is the largest financial market in the world, with daily trading exceeding $6 trillion.
Functions:
Facilitates international trade and investment.
Helps hedge against currency risks.
Influences inflation and interest rates globally.
2.5 Commodity Markets
Commodity markets trade physical goods like gold, silver, oil, agricultural products, and industrial metals. They can be classified into:
Spot Markets – trading commodities for immediate delivery.
Futures Markets – trading contracts for future delivery, helping producers and consumers hedge against price fluctuations.
Commodity markets are essential for price discovery, risk management, and economic planning.
3. Functions of Financial Markets
Financial markets perform several key functions that sustain economic growth:
Mobilization of Savings – They convert individual savings into productive investments.
Resource Allocation – Financial markets ensure efficient allocation of funds to projects with the highest potential returns.
Price Discovery – Markets determine prices based on supply and demand.
Liquidity Provision – Investors can convert securities into cash quickly.
Risk Management – Derivatives and insurance instruments help mitigate financial risks.
Reduction in Transaction Costs – Centralized markets reduce costs of buying and selling securities.
Economic Indicator – Financial market trends often signal economic conditions, growth, or recessions.
4. Participants in Financial Markets
Various participants operate in financial markets, each with distinct roles and objectives.
4.1 Individual Investors
Individuals invest in stocks, bonds, mutual funds, and ETFs for wealth creation, retirement planning, and income generation.
4.2 Institutional Investors
Large organizations, such as mutual funds, pension funds, insurance companies, and hedge funds, participate with significant capital, influencing market movements.
4.3 Corporations
Corporations raise capital by issuing equity or debt and may also hedge risks using derivatives.
4.4 Governments
Governments issue bonds to finance deficits, regulate financial markets, and implement monetary policies.
4.5 Intermediaries
Banks, brokers, and investment advisors facilitate transactions, provide liquidity, and offer investment guidance.
5. Instruments Traded in Financial Markets
Financial markets involve a wide variety of instruments:
Equities (Stocks) – ownership in companies.
Debt Instruments (Bonds, Debentures, CPs) – borrowing contracts.
Derivatives (Futures, Options, Swaps) – risk management instruments.
Foreign Exchange (Currency pairs) – global currency trading.
Commodities (Gold, Oil, Wheat, etc.) – physical or derivative-based trade.
Mutual Funds & ETFs – pooled investment vehicles.
Cryptocurrencies (Bitcoin, Ethereum, etc.) – emerging digital assets.
6. Regulatory Framework
Financial markets are heavily regulated to maintain transparency, fairness, and investor protection. Regulatory bodies include:
Securities and Exchange Board of India (SEBI) – regulates Indian securities markets.
U.S. Securities and Exchange Commission (SEC) – oversees American securities markets.
Commodity Futures Trading Commission (CFTC) – regulates derivatives and commodity trading.
Central Banks – control money supply, interest rates, and banking regulations.
Regulation ensures stability, reduces fraud, and maintains investor confidence.
7. Technology and Financial Markets
Technological advancements have transformed financial markets:
Algorithmic Trading – automated trading using mathematical models.
High-Frequency Trading (HFT) – executing large volumes of trades in milliseconds.
Blockchain and Cryptocurrencies – decentralized, secure trading platforms.
Robo-Advisors – AI-based investment advisory services.
Mobile Trading Apps – enabling retail investors to trade seamlessly.
Technology improves efficiency, reduces costs, and increases accessibility.
8. Challenges in Financial Markets
Despite their benefits, financial markets face several challenges:
Market Volatility – prices can fluctuate due to economic, political, or global events.
Fraud and Manipulation – insider trading and market rigging remain risks.
Liquidity Risks – lack of buyers or sellers can affect market stability.
Regulatory Gaps – outdated regulations may fail to address new instruments.
Global Interconnectivity – crises in one market can affect others globally.
9. Recent Trends
Modern financial markets are evolving rapidly:
ESG Investing – focus on environmentally and socially responsible investments.
Digital Assets – growth of cryptocurrencies and tokenized securities.
Sustainable Finance – promoting green bonds and renewable energy projects.
Globalization of Markets – increased cross-border investments.
Financial Inclusion – mobile and digital platforms enabling wider participation.
10. Conclusion
Financial markets are the lifeblood of the global economy. They channel funds efficiently, provide investment opportunities, allow risk management, and drive economic growth. With technological advancements, regulatory oversight, and innovative instruments, financial markets continue to evolve, shaping the modern financial landscape.
Understanding these markets is crucial for investors, policymakers, and corporations to make informed decisions and navigate the complexities of the financial world.

Basics of Technical Analysis1. Philosophy Behind Technical Analysis
The foundation of technical analysis is based on three key assumptions:
a. Market Discounts Everything
This principle states that all known information—economic, political, and psychological—is already reflected in the current price of a security. Prices react immediately to news and events, so there is no need to analyze each piece of information individually. For example, if a company reports a better-than-expected quarterly result, its stock price will immediately adjust to reflect this news.
b. Prices Move in Trends
Technical analysts believe that prices follow trends, whether upward (bullish), downward (bearish), or sideways (consolidation). Recognizing these trends is crucial because “the trend is your friend.” Traders aim to align their trades with the prevailing trend rather than against it.
c. History Tends to Repeat Itself
Human psychology drives market behavior, and patterns of fear, greed, and optimism often repeat over time. Technical analysis relies on identifying these recurring patterns to predict potential price movements.
2. Core Components of Technical Analysis
Technical analysis consists of several tools and techniques. Understanding these fundamentals is essential for building an effective trading strategy.
a. Price Charts
Price charts are the most basic tool for technical analysts. They visually display the historical price movements of a security over time.
Line Chart: Shows a simple line connecting closing prices over time. Useful for spotting long-term trends.
Bar Chart: Displays open, high, low, and close (OHLC) for each period. Useful for analyzing volatility.
Candlestick Chart: Uses colored bars (candles) to indicate price movement. Highly popular due to its visual clarity and ability to display market sentiment.
Example of a Candlestick
Bullish Candle: Close is higher than open, indicating buying pressure.
Bearish Candle: Close is lower than open, showing selling pressure.
b. Support and Resistance
These are price levels where buying or selling pressure tends to prevent further movement.
Support: A level where demand exceeds supply, preventing the price from falling further.
Resistance: A level where supply exceeds demand, preventing the price from rising further.
Traders watch these levels to make entry and exit decisions. A breakout above resistance signals potential bullish momentum, while a breakdown below support indicates bearish momentum.
c. Trendlines and Channels
Trendlines connect price highs or lows to define the direction of the market. Channels are formed by drawing parallel lines above and below the trendline.
Uptrend: Higher highs and higher lows.
Downtrend: Lower highs and lower lows.
Sideways Trend: Prices fluctuate within a horizontal range.
Channels help traders identify potential reversal points or continuation of trends.
d. Technical Indicators
Indicators are mathematical calculations based on price, volume, or both. They help confirm trends, measure momentum, and identify potential reversals.
Popular Indicators:
Moving Averages: Smooth out price data to identify trends.
Simple Moving Average (SMA)
Exponential Moving Average (EMA)
Relative Strength Index (RSI): Measures the speed and change of price movements. Values above 70 indicate overbought conditions; below 30 indicate oversold.
MACD (Moving Average Convergence Divergence): Shows the relationship between two moving averages. Helps identify trend changes and momentum.
Bollinger Bands: Measure volatility by plotting upper and lower bands around a moving average. Prices touching the bands often signal potential reversals.
e. Volume Analysis
Volume indicates the number of shares or contracts traded in a given period. It confirms the strength of a trend:
Rising price with increasing volume → strong trend
Rising price with decreasing volume → weak trend, potential reversal
Falling price with increasing volume → strong bearish trend
Volume is often analyzed alongside price patterns to validate breakouts or breakdowns.
f. Chart Patterns
Chart patterns are formations created by price movements. They signal potential continuation or reversal of trends.
Common Patterns:
Head and Shoulders: Trend reversal pattern.
Double Top and Double Bottom: Indicate potential reversals.
Triangles (Ascending, Descending, Symmetrical): Represent consolidation before breakout.
Flags and Pennants: Short-term continuation patterns.
These patterns help traders predict the market’s next move based on historical price behavior.
g. Candlestick Patterns
Candlestick patterns provide insight into market sentiment over a short period.
Doji: Indicates indecision.
Hammer: Bullish reversal at the bottom of a downtrend.
Shooting Star: Bearish reversal at the top of an uptrend.
Engulfing Patterns: Strong reversal signals.
By combining candlestick patterns with support/resistance and indicators, traders enhance their decision-making accuracy.
3. Timeframes in Technical Analysis
Technical analysis can be applied across various timeframes:
Intraday: 1-minute, 5-minute, 15-minute charts.
Short-Term: Daily or weekly charts.
Long-Term: Monthly or yearly charts.
Traders choose timeframes based on their strategy:
Day Traders: Focus on intraday charts for quick trades.
Swing Traders: Use daily or weekly charts for holding positions for days or weeks.
Investors: Rely on long-term charts for position trades.
4. Combining Technical Tools
A single tool rarely provides a perfect trading signal. Successful technical analysis combines multiple tools:
Trend Identification: Determine if the market is trending or ranging.
Support/Resistance: Identify key price levels for entry or exit.
Indicators: Confirm momentum, strength, and potential reversals.
Volume Analysis: Validate the trend or breakout.
Patterns: Spot opportunities using chart or candlestick formations.
For example, a trader may buy a stock when the price breaks above a resistance level, the RSI is rising but not overbought, and the breakout is accompanied by high volume.
5. Risk Management in Technical Analysis
Even the best technical analysis cannot guarantee profits. Risk management ensures traders protect their capital.
Stop-Loss Orders: Automatically exit losing trades at a predetermined level.
Position Sizing: Adjust trade size according to risk tolerance.
Risk-Reward Ratio: Ensure potential reward is higher than potential risk (e.g., 2:1 ratio).
Diversification: Avoid concentrating all trades in one instrument or sector.
Proper risk management is critical for long-term trading success.
6. Psychological Aspect
Markets are influenced by human emotions—fear, greed, hope, and panic. Technical analysis helps traders remain objective:
Follow predefined rules for entry and exit.
Avoid trading based on emotions or news hype.
Stick to trend direction and signals.
Emotional discipline combined with technical tools improves consistency.
7. Limitations of Technical Analysis
While technical analysis is powerful, it has limitations:
No Fundamental Insight: Ignores company performance, earnings, and economic factors.
Subjectivity: Interpretation of charts and patterns can vary between analysts.
False Signals: Breakouts or reversals can fail.
Market Manipulation: Large participants can influence price temporarily.
Traders often combine technical and fundamental analysis to mitigate these limitations.
8. Practical Application: How to Start
Choose a Market: Stocks, commodities, Forex, or cryptocurrencies.
Pick a Charting Platform: TradingView, Zerodha Kite, MetaTrader, etc.
Learn Price Patterns and Indicators: Begin with support/resistance, trendlines, and moving averages.
Paper Trade: Practice without risking real money.
Develop a Strategy: Include entry/exit rules, stop-loss, and position sizing.
Analyze Performance: Keep a trading journal to track successes and failures.
9. Advanced Concepts
After mastering the basics, traders can explore:
Fibonacci Retracement: Identify potential reversal levels.
Elliott Wave Theory: Predict market cycles using waves.
Market Profile & Volume Profile: Advanced volume-based analysis.
Algorithmic Trading: Automated execution using technical indicators.
10. Summary
Technical analysis is a toolkit that allows traders to forecast market movements based on price and volume data. Its foundation lies in understanding trends, support/resistance, chart patterns, and indicators, combined with disciplined risk management and psychological control. While it does not guarantee success, a structured approach increases the probability of making profitable trades.
By consistently applying technical analysis, traders can:
Identify opportunities in trending and range-bound markets.
Time entries and exits effectively.
Minimize losses through disciplined risk management.
Improve confidence in trading decisions.

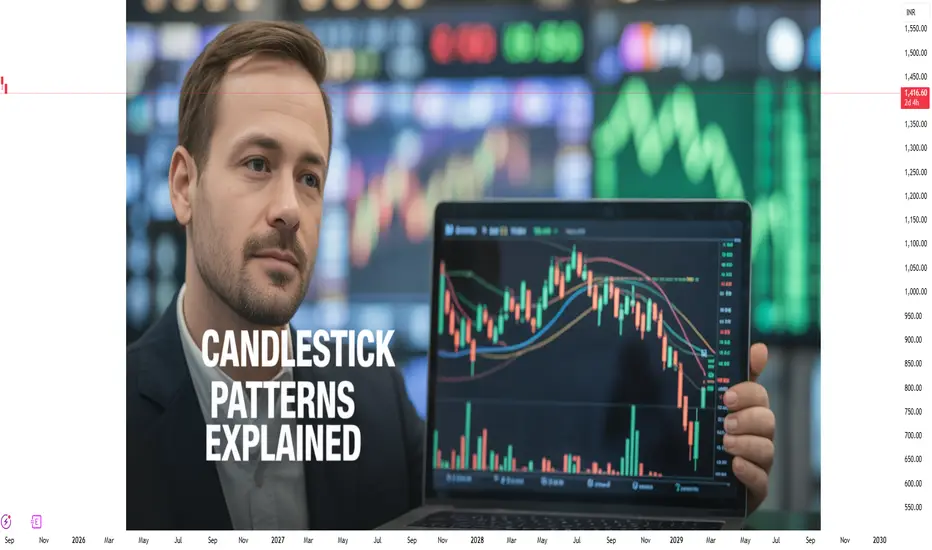
Candlestick Patterns Explained1. Introduction to Candlestick Patterns
1.1 What is a Candlestick?
A candlestick is a type of chart used to represent the price movement of an asset over a specific time period. Unlike traditional line charts that show only closing prices, candlestick charts display four crucial pieces of information:
Open price (O): The price at which the asset starts trading during the time frame.
Close price (C): The price at which the asset finishes trading.
High price (H): The highest price reached during the time frame.
Low price (L): The lowest price reached during the time frame.
Each candlestick consists of:
Body: The rectangular area between the open and close prices. A filled body (often red or black) represents a close lower than the open (bearish), while an empty or green body represents a close higher than the open (bullish).
Wicks/Shadows: The thin lines extending from the body, representing the high and low prices.
1.2 Why Candlestick Patterns Matter
Candlestick patterns reflect the psychology of the market. They show whether buyers or sellers are in control and help traders anticipate potential price movements. Patterns can indicate:
Trend continuation: The market is likely to keep moving in the same direction.
Trend reversal: The market may change direction soon.
Indecision: Neither buyers nor sellers have a clear advantage.
2. Types of Candlestick Patterns
Candlestick patterns are broadly categorized into two types:
Single-Candle Patterns: Formed by one candle, often signaling immediate market sentiment.
Multiple-Candle Patterns: Formed by two or more candles, providing stronger confirmation of trend direction or reversals.
3. Single-Candle Patterns
3.1 Doji
A Doji occurs when the open and close prices are almost equal, forming a very small body with long wicks. It signals market indecision and potential reversal.
Types of Doji:
Standard Doji: Open ≈ Close, wicks vary.
Long-Legged Doji: Long upper and lower shadows; extreme indecision.
Dragonfly Doji: Long lower shadow, little or no upper shadow; potential bullish reversal.
Gravestone Doji: Long upper shadow, little or no lower shadow; potential bearish reversal.
Example: After a strong uptrend, a Gravestone Doji may indicate the buyers are losing momentum.
3.2 Hammer and Hanging Man
Both have small bodies and long lower shadows, but their implications differ based on trend:
Hammer (Bullish Reversal): Appears after a downtrend. Shows that sellers pushed the price down, but buyers regained control.
Hanging Man (Bearish Reversal): Appears after an uptrend. Indicates sellers testing the market and potential reversal.
Tip: Always confirm with the next candle or technical indicators.
3.3 Shooting Star and Inverted Hammer
These are the opposite of Hammer and Hanging Man:
Shooting Star (Bearish Reversal): Appears after an uptrend, small body with long upper shadow. Indicates buyers tried to push prices up but failed.
Inverted Hammer (Bullish Reversal): Appears after a downtrend, small body with long upper shadow. Suggests buyers may be gaining control.
3.4 Spinning Top
A small body with long shadows on both sides. Reflects market indecision and weak trend momentum. Spinning tops often precede trend reversals if confirmed by the next candle.
4. Multiple-Candle Patterns
4.1 Engulfing Patterns
Engulfing patterns occur when one candle completely engulfs the previous candle's body, signaling strong momentum.
Bullish Engulfing: Appears after a downtrend. A large green candle engulfs a small red candle. Indicates buyers taking control.
Bearish Engulfing: Appears after an uptrend. A large red candle engulfs a small green candle. Indicates sellers gaining strength.
4.2 Harami Patterns
A Harami consists of a large candle followed by a smaller candle within the body of the first. It signals trend reversal or indecision.
Bullish Harami: Appears after a downtrend, small green candle within large red candle. Suggests buyers are entering.
Bearish Harami: Appears after an uptrend, small red candle within large green candle. Suggests selling pressure.
4.3 Tweezer Tops and Bottoms
Tweezer patterns are formed when two candles have equal highs or lows:
Tweezer Top (Bearish): Appears after an uptrend, equal highs indicate resistance.
Tweezer Bottom (Bullish): Appears after a downtrend, equal lows indicate support.
4.4 Morning Star and Evening Star
Three-candle reversal patterns:
Morning Star (Bullish Reversal): Downtrend → small-bodied candle → strong bullish candle. Indicates trend reversal upward.
Evening Star (Bearish Reversal): Uptrend → small-bodied candle → strong bearish candle. Indicates trend reversal downward.
4.5 Three White Soldiers and Three Black Crows
Strong trend continuation patterns:
Three White Soldiers (Bullish): Three consecutive green candles with higher closes, following a downtrend. Strong bullish signal.
Three Black Crows (Bearish): Three consecutive red candles with lower closes, following an uptrend. Strong bearish signal.
5. Candlestick Patterns in Trend Analysis
Candlestick patterns are more effective when combined with trend analysis:
Uptrend: Look for bullish patterns (Hammer, Bullish Engulfing, Morning Star).
Downtrend: Look for bearish patterns (Shooting Star, Bearish Engulfing, Evening Star).
Sideways Market: Look for indecision patterns (Doji, Spinning Top).
Tip: Patterns are not guarantees; they indicate probabilities. Always confirm with volume, support/resistance, or technical indicators like RSI, MACD, or moving averages.
6. Practical Trading Tips Using Candlestick Patterns
Confirm Patterns: Never trade based solely on one candlestick. Wait for confirmation from the next candle or trend indicators.
Combine with Support & Resistance: Candlestick patterns near key levels are more reliable.
Volume Matters: Patterns accompanied by high volume indicate stronger conviction.
Risk Management: Set stop-losses slightly beyond the wick extremes to protect against false signals.
Time Frames: Patterns work across all timeframes, but longer timeframes (daily/weekly) generally provide more reliable signals.
7. Common Mistakes Traders Make
Ignoring trend context: Trading reversal patterns against strong trends can lead to losses.
Over-relying on a single candle: Patterns should be confirmed with other indicators.
Misinterpreting Dojis or Spinning Tops: Context and location in the trend are critical.
Neglecting risk management: Even the strongest patterns can fail.
8. Summary
Candlestick patterns are a powerful tool for traders when used correctly. They visually depict market psychology and help forecast potential price movements. Key takeaways:
Single-Candle Patterns indicate immediate sentiment (Hammer, Doji, Shooting Star).
Multiple-Candle Patterns provide stronger signals (Engulfing, Morning Star, Three Soldiers).
Trend Confirmation increases reliability.
Support, Resistance, Volume, and Indicators enhance accuracy.
With practice, traders can read market sentiment quickly and make more informed decisions. Candlestick analysis is not a standalone solution but a vital part of a comprehensive trading strategy.
Part 2 Master Candlestick PatternDisadvantages of Options
Complexity for beginners
Time decay risk (premium can vanish)
Unlimited risk for sellers of uncovered options
Requires active monitoring for effective trading
Tips for Successful Options Trading
Understand the underlying asset thoroughly.
Start with basic strategies like long calls, puts, and covered calls.
Use proper risk management and position sizing.
Keep track of Greeks to understand sensitivity.
Avoid over-leveraging.
Monitor market volatility; high volatility can inflate premiums.
Use demo accounts or paper trading for practice.

Part 6 Learn Institutional Trading Black-Scholes Model
A widely used formula to calculate option prices using:
Stock price
Strike price
Time to expiry
Volatility
Risk-free interest rate
Greeks
Delta: Measures sensitivity of option price to underlying price changes.
Gamma: Measures delta’s rate of change.
Theta: Measures time decay of option.
Vega: Measures sensitivity to volatility.
Rho: Measures sensitivity to interest rates.
Understanding Greeks is critical for managing risk and strategy adjustments.

Part 4 Learn Institutional Trading Advanced Strategies
Straddle: Buy a call and a put at the same strike and expiry to profit from volatility.
Strangle: Buy OTM call and put for cheaper volatility bets.
Spread Strategies: Combine multiple calls or puts to limit risk and reward:
Bull Call Spread: Buy call at lower strike, sell call at higher strike.
Bear Put Spread: Buy put at higher strike, sell put at lower strike.
Iron Condor: Combine calls and puts to profit from low volatility.
Butterfly Spread: Profit from minimal movement around a central strike.
Pricing of Options
Option pricing is influenced by several factors:
Intrinsic Value
The real value if exercised today.
Call option IV = Max(Current Price – Strike, 0)
Put option IV = Max(Strike – Current Price, 0)
Time Value
Extra premium due to time until expiration.
TV = Option Premium – Intrinsic Value

Part 1 Ride The Big Moves Options trading is one of the most versatile tools in financial markets, allowing traders and investors to hedge risk, generate income, and speculate on price movements. While options can seem complex at first, understanding their structure, types, and strategies can make them an invaluable part of your trading toolkit.
What Are Options?
An option is a financial contract that gives the holder the right, but not the obligation, to buy or sell an underlying asset (like stocks, indices, or commodities) at a predetermined price within a specific period. Unlike futures or stocks, options provide flexibility and limited risk.
There are two main types of options:
Call Option: Gives the buyer the right to buy the underlying asset at a predetermined price (strike price) before or on the expiration date.
Put Option: Gives the buyer the right to sell the underlying asset at the strike price before or on expiration.
Key terms to understand:
Underlying Asset: The stock, index, commodity, or currency on which the option is based.
Strike Price: The price at which the option can be exercised.
Premium: The price paid to buy the option.
Expiration Date: The date on which the option expires.
In-the-Money (ITM): Options with intrinsic value (profitable if exercised now).
Out-of-the-Money (OTM): Options without intrinsic value (currently unprofitable).
At-the-Money (ATM): Option strike price equals the underlying asset price.

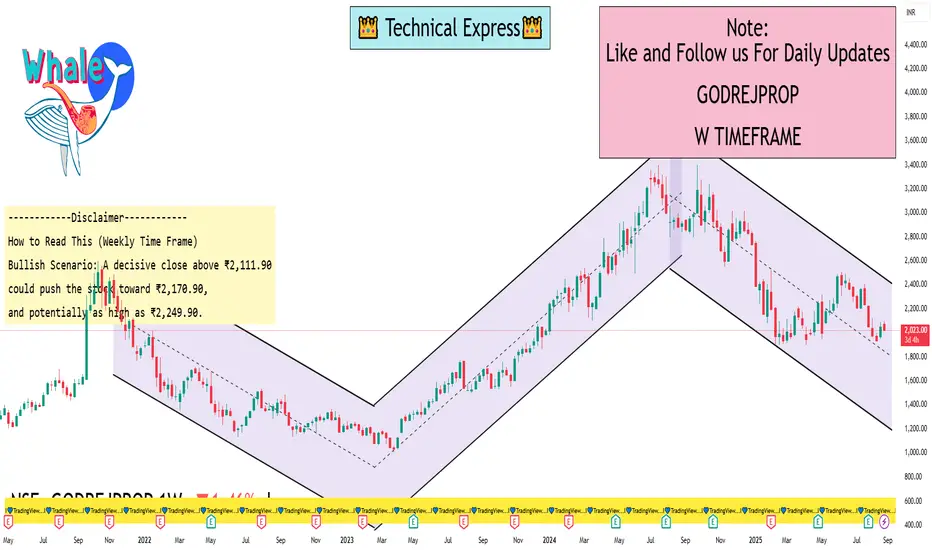
Godrej Properties Ltd 1 Week ViewWeekly Support & Resistance Levels
From EquityPandit (for the week August 25–29, 2025):
Immediate Resistance (R1): ₹ 2,111.90
Main Resistance (R2): ₹ 2,170.90
Max Resistance (R3): ₹ 2,249.90
Immediate Support (S1): ₹ 1,973.90
Major Support (S2): ₹ 1,894.90
Deep Support (S3): ₹ 1,835.90
Weekly Pivot Points (TopStockResearch):
Pivot Level: ₹ 2,032.90 (midpoint)
Weekly S1: ₹ 1,973.90
Weekly S2: ₹ 1,894.90
Weekly R1: ₹ 2,111.90
Weekly R2: ₹ 2,170.90
How to Read This (Weekly Time Frame)
Bullish Scenario: A decisive close above ₹2,111.90 could push the stock toward ₹2,170.90, and potentially as high as ₹2,249.90.
Bearish Scenario: A breakdown below ₹1,973.90 puts ₹1,894.90 and further down ₹1,835.90 into sharper focus.
Range-Bound: As long as the stock trades between roughly ₹1,974–₹2,112, it may remain in a consolidation phase.
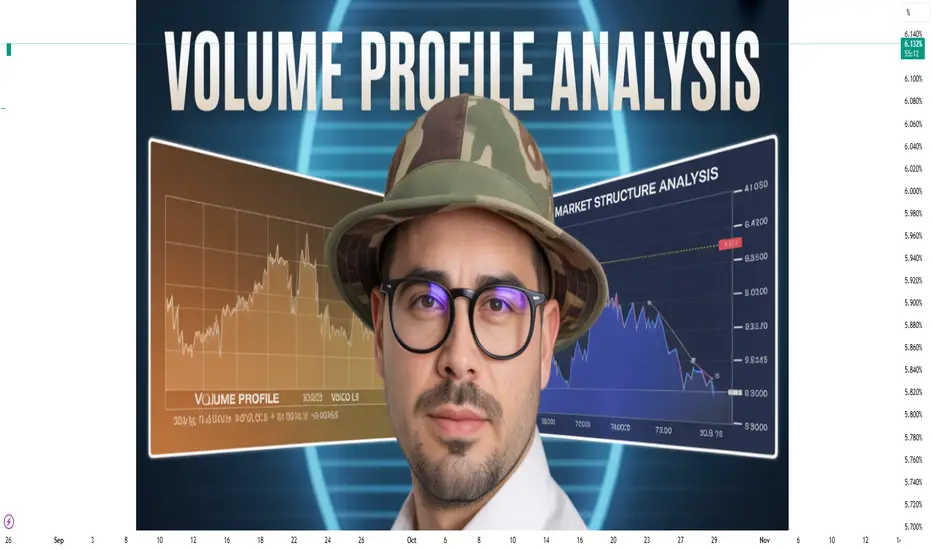
Volume Profile & Market Structure1. Introduction
If you have ever looked at a stock or index chart, you’ll notice prices move up, down, or sometimes just sideways. Traders are always trying to answer one simple question:
👉 Where is the market likely to go next?
To answer that, two powerful tools come into play:
Market Structure → tells us the story of price movement by showing how highs, lows, and trends form.
Volume Profile → shows us where the biggest battles between buyers and sellers happened by plotting traded volumes at different price levels.
Think of Market Structure as the “skeleton” of price movement, and Volume Profile as the “blood flow” that shows which areas have real strength and participation. When combined, these tools help traders understand who controls the market (buyers or sellers) and where important levels are for making decisions.
In this guide, we’ll break down these concepts step by step in simple language so you can use them in real-world trading.
2. Understanding Market Structure
Market structure simply means the framework of how price moves over time. It helps traders identify the trend, key levels, and potential reversals.
2.1 What is Market Structure?
At its core, market structure is about recognizing patterns in price:
When the market is making higher highs (HH) and higher lows (HL) → it’s in an uptrend.
When the market is making lower highs (LH) and lower lows (LL) → it’s in a downtrend.
When the market is not making new highs or lows, just bouncing within levels → it’s in a range.
📌 Example:
If Nifty goes from 19,000 → 19,200 → 19,100 → 19,400 → 19,250, we can see it’s making higher highs and higher lows, which means buyers are stronger.
2.2 Why Market Structure Matters
It shows the direction of the market.
Helps identify good entry and exit points.
Builds discipline (you trade with the trend, not against it).
2.3 Phases of Market Structure
Markets move in cycles. These are usually broken into four phases:
Accumulation Phase
Big players (institutions) quietly buy at low prices.
Price moves sideways.
Volume is steady but not explosive.
Uptrend/Advancing Phase
Price starts breaking resistance levels.
Higher highs and higher lows form.
Retail traders notice and start buying.
Distribution Phase
Big players slowly sell to latecomers.
Market looks like it’s topping out.
Price often moves sideways again.
Downtrend/Decline Phase
Price starts making lower highs and lower lows.
Panic selling happens.
Eventually, smart money will start accumulating again → cycle repeats.
2.4 Break of Structure (BOS) & Change of Character (ChoCh)
Two important concepts:
Break of Structure (BOS): when price breaks the previous high/low, signaling continuation of trend.
Change of Character (ChoCh): when price shifts from uptrend to downtrend (or vice versa). This often signals a reversal.
📌 Example:
If Bank Nifty keeps making higher highs but suddenly makes a lower low, that’s a ChoCh – trend may reverse.
2.5 Market Structure Across Timeframes
On higher timeframes (daily/weekly) → structure shows the big trend.
On lower timeframes (5-min, 15-min) → structure shows intraday opportunities.
Smart traders align both (called multi-timeframe analysis).
3. Understanding Volume Profile
Now that we understand how price moves, let’s look at the Volume Profile – the tool that shows where traders are most active.
3.1 What is Volume Profile?
Unlike the normal volume indicator (bars at the bottom of the chart showing volume per time), Volume Profile plots volume at each price level.
So instead of asking: “How much was traded at 10:30 AM?”
We ask: “How much was traded at ₹19,200, ₹19,300, ₹19,400?”
This gives a much clearer picture of where buyers and sellers are fighting hardest.
3.2 Key Elements of Volume Profile
POC (Point of Control):
The price level where the highest volume was traded.
Acts like a magnet – price often returns to this level.
Value Area (VA):
The range of prices where around 70% of the volume occurred.
Consists of:
VAH (Value Area High): top of this range.
VAL (Value Area Low): bottom of this range.
High Volume Nodes (HVN):
Price zones with heavy volume.
Represent areas of acceptance (market agrees fair value is here).
Low Volume Nodes (LVN):
Price zones with very little volume.
Represent areas of rejection (market quickly moved away).
📌 Simple Analogy:
Imagine an auction. Where people bid the most (POC), that’s the “fair price.” Places where few bids happen (LVN) are “unwanted” areas.
3.3 Why Volume Profile Matters
Shows real support & resistance (not just lines on charts).
Helps spot false breakouts (price goes above resistance but fails if volume is low).
Identifies where big players (institutions) are active.
3.4 Difference Between Volume Profile & Normal Volume
Normal Volume: tells when activity happened.
Volume Profile: tells where activity happened.
4. Combining Market Structure with Volume Profile
This is where magic happens.
Market structure tells us direction, and volume profile tells us important levels. Together, they give high-probability setups.
4.1 Example Setup: Trend Confirmation
If market is in uptrend (HH, HL structure) →
Look at POC/VAH. If price holds above these, trend is strong.
4.2 Example Setup: Reversal Spotting
If price breaks structure (ChoCh) AND rejects at an LVN, it signals strong reversal.
4.3 Example Setup: Liquidity Zones
Many traders put stop losses above resistance/below support.
Volume Profile helps spot whether these breakouts are real (with volume) or fake (low volume).
5. Trading Strategies Using Market Structure + Volume Profile
Let’s go through practical trading approaches.
5.1 Trend Trading Strategy
Identify trend with market structure (HH/HL for uptrend, LH/LL for downtrend).
Use POC/VAH/VAL as entry levels.
Enter with trend direction, place stop below VAL (for long) or above VAH (for short).
5.2 Range Trading Strategy
If market is sideways → watch Value Area.
Buy near VAL, sell near VAH.
Exit near POC.
5.3 Breakout Strategy
If market breaks resistance with high volume (confirmed by VP), enter breakout.
If breakout happens at LVN, it usually moves fast.
5.4 Reversal Strategy
Look for ChoCh in market structure.
Confirm with rejection at HVN/LVN.
Enter opposite direction.
5.5 Scalping (Intraday)
Use lower timeframes (5-min, 15-min).
Enter at POC retests.
Target small moves (20–30 points in Nifty).
5.6 Swing Trading (Positional)
Use higher timeframe VP (daily/weekly).
Identify major HVN (support) & LVN (breakout zones).
Ride bigger moves.
6. Risk Management & Psychology
Even with the best tools, without risk management you can lose money.
Stop Loss: always place stops beyond HVN/LVN levels.
Position Sizing: never risk more than 1–2% of capital per trade.
Patience: wait for price to confirm at volume profile levels, don’t jump early.
Discipline: follow your system, don’t let emotions rule.
7. Common Mistakes Traders Make
Ignoring Higher Timeframe Levels → focusing only on 5-min charts without seeing big picture.
Chasing Breakouts Without Volume Confirmation → leads to false breakout traps.
Overloading Chart with Indicators → volume profile + market structure are enough.
No Risk Management → one bad trade wipes profits.
8. Conclusion & Key Takeaways
Market Structure = Direction (trend, BOS, ChoCh, HH/HL, LH/LL).
Volume Profile = Importance (POC, VAH, VAL, HVN, LVN).
Combined → they show who controls the market and where to enter/exit safely.
📌 Golden Rule:
Trade with the structure and around the volume zones → your accuracy improves dramatically.
By using both tools together, you stop trading blindly and start trading with the footsteps of institutions.
Options Trading Basics1. Introduction: What Are Options?
When you hear the word “options” in trading, it might sound complicated. But the truth is, options are just financial contracts that give you a choice.
The word “option” itself means a choice or possibility. In the stock market, options give you the right (but not the obligation) to buy or sell an asset (like stocks, index, or commodity) at a fixed price within a specific time.
If you buy an option, you’re buying the right to do something in the market.
If you sell (write) an option, you’re giving someone else that right.
Think of it like booking a movie ticket online. You pay ₹200 to book a seat (premium). If you go to the movie, great. If you skip it, you lose the ₹200 booking fee. That’s how options work—you pay for the right, but you don’t have to use it.
2. Why Do People Trade Options?
Options are popular because they offer flexibility and leverage. Traders and investors use options for three main reasons:
Speculation (to make profits) – Betting on stock prices moving up or down.
Hedging (to protect investments) – Like insurance for your portfolio.
Income generation – Selling options to earn premiums regularly.
Example:
Suppose you think Reliance stock (currently ₹2,500) will rise to ₹2,700. Instead of buying 100 shares (₹2,50,000 required), you can buy a call option by paying just ₹5,000 premium. If Reliance rises, your profit can be huge compared to the small amount invested.
That’s why options are powerful. But with power comes risk, so you need to understand the basics deeply.
3. Key Terms in Options Trading
Before diving deeper, let’s learn the basic vocabulary:
Underlying Asset: The stock or index on which the option is based (like Reliance, TCS, or Nifty50).
Strike Price: The fixed price at which you can buy/sell the asset using the option.
Expiry Date: The last date until the option is valid.
Premium: The price you pay to buy an option.
Lot Size: Options are traded in fixed quantities called lots (e.g., Nifty option lot size = 50 units).
In-the-Money (ITM): When exercising the option is profitable.
Out-of-the-Money (OTM): When exercising the option gives no benefit.
At-the-Money (ATM): When the strike price is the same as the market price.
Keep these terms in mind—we’ll use them often.
4. Two Types of Options: Call & Put
There are only two types of options you need to remember:
a) Call Option (Right to Buy)
A call option gives the buyer the right (not obligation) to buy a stock at a fixed strike price.
You buy a call when you expect the stock price will go up.
Example:
Reliance is at ₹2,500.
You buy a Reliance Call option with strike price ₹2,600 by paying ₹50 premium.
If Reliance goes to ₹2,700, your option is profitable.
If Reliance stays below ₹2,600, you lose only the premium (₹50).
b) Put Option (Right to Sell)
A put option gives the buyer the right (not obligation) to sell a stock at a fixed strike price.
You buy a put when you expect the stock price will go down.
Example:
Infosys is at ₹1,400.
You buy a Put option with strike price ₹1,380 for ₹20 premium.
If Infosys falls to ₹1,350, your put option is profitable.
If Infosys goes above ₹1,380, you lose only the premium.
5. Who Are the Players in Options Trading?
There are two sides in every option contract:
Option Buyer – Pays premium, gets the right (call = buy, put = sell).
Limited risk (only the premium).
Unlimited profit potential.
Option Seller (Writer) – Receives premium, gives the right.
Limited profit (only the premium).
Unlimited risk potential.
This is like insurance:
Buyer = person buying insurance (pays premium).
Seller = insurance company (earns premium but takes big risk).
6. How Options Work in Real Life (Simple Example)
Let’s simplify with a real-life analogy.
Imagine you want to buy a flat worth ₹50 lakhs, but you’re not sure. So, you sign an agreement with the owner:
You pay ₹2 lakhs today as an advance (premium).
The agreement says: Within 6 months, you can buy the flat at ₹50 lakhs (strike price).
If flat prices rise to ₹60 lakhs, you can still buy it for ₹50 lakhs—huge profit!
If flat prices drop to ₹45 lakhs, you won’t buy. You just lose the ₹2 lakhs advance.
That’s exactly how options trading works.
7. How to Read an Option Quote
Let’s say you see this on NSE:
Nifty 18,000 CE @ ₹120, Expiry 30-August
Breaking it down:
Nifty = Underlying asset
18,000 = Strike price
CE = Call Option
₹120 = Premium (price of the option)
30-August = Expiry date
So, if you buy this option, you are paying ₹120 × 50 (lot size) = ₹6,000 to get the right to buy Nifty at 18,000 before expiry.
8. How Option Prices Are Decided
Option premiums are influenced by:
Intrinsic Value – The real value (how much profit if exercised now).
Time Value – Extra premium for the time left until expiry.
Volatility – If stock moves a lot, option premiums become expensive.
Interest rates & demand-supply – Minor factors.
9. Payoff Scenarios: Buyer vs Seller
Call Option Buyer
Profit if price rises above strike + premium.
Loss limited to premium.
Call Option Seller
Profit limited to premium received.
Loss unlimited if price rises sharply.
Put Option Buyer
Profit if price falls below strike - premium.
Loss limited to premium.
Put Option Seller
Profit limited to premium received.
Loss unlimited if price crashes.
10. Options vs Futures vs Stocks
Stocks: Buy & hold actual shares.
Futures: Agreement to buy/sell at fixed price in future (obligation).
Options: Right, but not obligation, to buy/sell.
That “no obligation” part makes options unique.
11. Strategies in Options Trading (Basics)
You don’t always have to just buy or sell a single option. Traders use strategies by combining call & put options.
Some basic strategies:
Buying Calls – When you expect big upward movement.
Buying Puts – When you expect big downward movement.
Covered Call – Holding stock + selling call to earn income.
Protective Put – Holding stock + buying put as insurance.
Straddle – Buy call + put at same strike (expecting big movement either side).
Iron Condor – Complex strategy to earn steady premium in range-bound market.
12. Advantages of Options Trading
Leverage – Small capital, big exposure.
Limited Risk for Buyers – Risk only the premium.
Flexibility – Can profit in up, down, or sideways markets.
Hedging Tool – Protects portfolio.
Income Generation – Selling options brings regular premium income.
Conclusion
Options trading is like a double-edged sword. Used wisely, it can give you high returns, protection, and steady income. Used recklessly, it can lead to massive losses.
So, learn the basics, understand risk, and start step by step. Once you master it, options become one of the most powerful tools in the financial market.
Day Trading vs Swing TradingIntroduction
Trading in the stock market comes in different shapes and sizes. Some traders like to enter and exit positions within minutes or hours, while others prefer to hold them for a few days or even weeks. Two of the most popular trading styles that fall in between short-term speculation and long-term investing are Day Trading and Swing Trading.
Both styles aim to profit from price movements, but the way they operate, the mindset they require, and the strategies they use are different. Understanding these differences is crucial before deciding which one suits you.
This guide will explain in detail:
What day trading is
What swing trading is
Their pros and cons
The skills required
Tools and strategies for both
Real-life examples
Psychological differences
Which style may be right for you
By the end, you’ll have a clear, practical understanding of Day Trading vs Swing Trading, and you’ll know how to choose based on your own lifestyle, risk tolerance, and personality.
What is Day Trading?
Day trading is the practice of buying and selling financial instruments—stocks, futures, forex, or options—within the same trading day. The goal is to capture short-term price fluctuations.
Timeframe: Minutes to hours (never overnight).
Holding period: Seconds, minutes, or a few hours.
Objective: Profit from intraday volatility.
Key characteristic: No position is carried overnight.
For example:
A trader buys Reliance Industries at ₹2,600 in the morning and sells it at ₹2,630 within two hours.
Another trader shorts Nifty Futures at 21,500 and covers at 21,350 within the same session.
Both trades are intraday.
Characteristics of Day Trading
High frequency of trades – Multiple trades in a single day.
Leverage use – Brokers often allow higher intraday margin.
Quick decisions – Requires monitoring charts and news constantly.
Focus on liquidity – Day traders choose highly liquid stocks for quick entries/exits.
Dependence on volatility – Profits come from short-term price swings.
What is Swing Trading?
Swing trading is about holding positions for several days to weeks to capture medium-term price movements. Swing traders don’t care about intraday noise but focus on larger trends.
Timeframe: Days to weeks.
Holding period: 2–20 days (sometimes longer).
Objective: Profit from multi-day moves in price.
Key characteristic: Positions are carried overnight and sometimes through weekends.
For example:
A swing trader buys HDFC Bank at ₹1,500 and sells it at ₹1,650 over the next 10 trading sessions.
Another spots a breakout in Infosys at ₹1,400 and holds for three weeks until it reaches ₹1,600.
Characteristics of Swing Trading
Fewer trades – Maybe 1–3 trades per week.
Moderate leverage – Lower than day trading.
More relaxed pace – No need to stare at charts all day.
Focus on trend continuation – Uses chart patterns, moving averages, or fundamentals.
Exposure to overnight risk – News events can gap the stock against your position.
Skills Required
Skills for Day Trading
Discipline – To follow strict stop-loss rules.
Chart-reading – Ability to read intraday patterns like flags, breakouts, and VWAP.
Risk control – Never risk more than 1–2% per trade.
Emotional control – Resist greed and fear.
Speed – Quick decision-making and execution.
Skills for Swing Trading
Patience – Trades may take days to play out.
Trend identification – Using moving averages, support/resistance.
Position sizing – Managing overnight risk.
Fundamental awareness – Earnings results, economic events.
Adaptability – Adjusting to new market conditions.
Pros and Cons
Pros of Day Trading
Quick results (profit/loss is known the same day).
No overnight risk.
Can take advantage of leverage.
Multiple opportunities daily.
Cons of Day Trading
High stress and pressure.
Requires full-time attention.
Higher transaction costs.
Easy to lose big money without discipline.
Pros of Swing Trading
Less stressful (don’t need to watch markets all day).
Can be done part-time.
Larger profit per trade.
Fits better with trends.
Cons of Swing Trading
Exposed to overnight gaps/news.
Requires patience.
Fewer trades (profits take longer to realize).
Need wider stop-losses.
Example Scenarios
Day Trading Example
Suppose Nifty opens at 21,500.
A day trader notices a breakout at 21,550 and buys futures.
Within 30 minutes, Nifty rises to 21,650.
He books 100 points profit and exits.
Done for the day.
Swing Trading Example
Infosys is consolidating at ₹1,400.
A swing trader notices a bullish breakout above resistance.
He buys at ₹1,420 and holds for 2 weeks.
The stock rallies to ₹1,600.
He sells, pocketing 180 points.
Both traders made money, but one in minutes, the other in weeks.
Psychology in Day vs Swing Trading
Day Trading Psychology
Requires handling adrenaline rush.
Must overcome fear of missing out (FOMO).
Emotional discipline is key because losses can happen quickly.
Often attracts people who like fast action.
Swing Trading Psychology
Requires patience and conviction.
Must handle overnight anxiety (news can move prices sharply).
Avoids overtrading and compulsive action.
Suits people who prefer a calmer pace.
Conclusion
Both Day Trading and Swing Trading have their place in the trading world. Day trading is like sprinting—fast, intense, and high-energy. Swing trading is like middle-distance running—steady, patient, and rewarding if done right.
Neither is “better” universally; the right style depends on your personality, time availability, risk tolerance, and financial goals.
Some traders even combine both—doing day trades on volatile days and swing trades when a strong trend forms.
The golden rule is: Don’t copy others blindly. Choose the trading style that matches your lifestyle and mindset.
Trading Psychology & Discipline1. What is Trading Psychology?
Trading psychology refers to the emotional and mental state of a trader when making decisions in the market. It includes fear, greed, confidence, patience, discipline, hope, regret, and risk perception.
Every trader faces these emotions, but winners manage them better.
Fear: Fear of losing money, fear of missing out (FOMO), or fear of being wrong.
Greed: Wanting more profit, overtrading, or not booking gains at the right time.
Hope: Holding on to losing trades, hoping they will reverse.
Regret: Feeling bad after missing an opportunity or making a mistake, leading to revenge trading.
In short: Trading psychology is the battlefield inside your own mind.
2. Why is Trading Psychology Important?
Imagine two traders using the same strategy. One follows rules strictly, cuts losses early, and controls emotions. The other panics, hesitates, and breaks rules. Who will succeed?
Trading is not only about analysis—it’s about execution. And execution depends on your mindset.
Some key reasons psychology matters:
Markets are uncertain; your emotions influence decisions.
Risk management requires discipline (most ignore stop-losses due to ego or fear).
Profits come from consistency, not one lucky trade.
Without mental control, you will overtrade, average down losses, or chase stocks blindly.
3. Core Emotions in Trading
Let’s break down the main emotions that affect traders:
(A) Fear
Afraid to enter trades → missed opportunities.
Afraid of losses → cutting winners too early.
Afraid of stop-loss hitting → widening stop-losses unnecessarily.
(B) Greed
Holding winners too long, expecting more.
Taking oversized positions.
Trading without proper setup.
(C) Hope
Hoping a loss turns into profit → ignoring stop-loss.
Adding more to losing positions (averaging down).
(D) Overconfidence
After a few wins, believing you “cannot lose.”
Taking unnecessary risks, leading to a big blowup.
(E) Impatience
Not waiting for setups.
Jumping into trades because “the market is moving.”
Recognizing these emotions is the first step to controlling them.
4. The Role of Discipline in Trading
If psychology is the mind, discipline is the practice. Discipline means sticking to your trading plan, following rules, and controlling impulses.
Key aspects of discipline:
Following a Trading Plan
A plan defines entry, exit, risk, and money management. Discipline ensures you don’t deviate from it.
Risk Management
Never risking more than a fixed percentage of capital per trade (e.g., 1-2%).
Patience
Waiting for the right setup instead of forcing trades.
Consistency
Small, regular gains build wealth—not random big wins and losses.
Avoiding Emotional Trading
No revenge trades, no FOMO entries.
5. Common Psychological Mistakes Traders Make
Revenge Trading
After a loss, trying to recover immediately with a random trade.
Overtrading
Entering too many trades without quality setups.
Ignoring Stop-loss
Letting small losses grow into big ones.
Overleveraging
Using excessive capital, hoping for big profits.
FOMO (Fear of Missing Out)
Jumping into a trade because “everyone is buying.”
Lack of Patience
Exiting early before the strategy plays out.
6. How to Build Strong Trading Psychology
Developing trading psychology is like training your muscles—it takes practice.
Step 1: Create a Trading Plan
Define entry rules, exit rules, stop-loss, and position size.
Write them down and follow strictly.
Step 2: Use Risk Management
Risk only 1–2% of your capital per trade.
Use stop-loss religiously.
Step 3: Keep a Trading Journal
Record trades, reasons, and emotions.
Helps identify emotional mistakes.
Step 4: Detach from Money
Focus on executing strategy, not on profits/losses.
Think in terms of probabilities, not guarantees.
Step 5: Practice Patience
Trade only when setup matches your plan.
Avoid impulsive entries.
Step 6: Control Greed & Fear
Book profits as per plan, don’t hold forever.
Accept losses as cost of doing business.
Step 7: Develop Routine
Start with daily market analysis.
Take breaks—don’t stare at charts all day.
7. Practical Techniques to Improve Discipline
Set Daily/Weekly Limits
Example: Maximum 3 trades per day.
Or: Stop trading after losing 3% of account.
Use Technology
Automated stop-loss orders prevent emotional decisions.
Meditation & Mindfulness
Helps stay calm, reduces stress.
Backtesting & Practice
Confidence increases when strategy is tested.
Accept Uncertainty
No setup has 100% accuracy.
Losses are part of trading business.
8. Trading Psychology for Different Styles
Day Trading: Needs quick decision-making, high emotional control.
Swing Trading: Patience is key; avoid checking prices every minute.
Investing: Long-term vision, ability to ignore short-term volatility.
Each style requires a different psychological approach.
9. Case Studies: Psychology in Action
Case 1: The Fearful Trader
Ravi has a solid strategy, but every time he enters a trade, he exits quickly with a tiny profit because he fears losing. Over time, his small wins cannot cover occasional big losses. His fear costs him consistency.
Case 2: The Greedy Trader
Anita makes 15% in a stock but doesn’t exit. She wants 25%. The market reverses, and her profit turns into a 10% loss. Greed made her lose a winning trade.
Case 3: The Disciplined Trader
Arjun risks only 1% per trade, follows stop-loss strictly, and journals his trades. His profits are steady and he grows his account slowly but surely. He survives where others blow up.
10. Building the Trader’s Mindset
The ultimate goal is to think like a professional.
Focus on process, not outcome.
Accept losses as natural.
Think in probabilities, not certainties.
Detach ego from trading decisions.
11. The Growth Path of a Trader
Unconscious Incompetence – You don’t know what you don’t know.
Conscious Incompetence – You realize mistakes, but still repeat them.
Conscious Competence – You follow rules with effort and discipline.
Unconscious Competence – Psychology and discipline become second nature.
12. Final Thoughts
Trading psychology & discipline are not “soft skills”—they are the foundation of trading success.
Without psychology, strategies fail.
Without discipline, emotions take over.
With the right mindset, even an average trader can beat the markets.
Remember:
👉 The market is not your enemy—your emotions are.
👉 Treat trading like a business, not a gamble.
👉 Consistency beats occasional brilliance.

Part 1 Trading Master Class With ExpertsIntermediate Option Strategies
Straddle – Buy Call + Buy Put (same strike/expiry). Best for high volatility.
Strangle – Buy OTM Call + Buy OTM Put. Cheaper than straddle.
Bull Call Spread – Buy lower strike call + Sell higher strike call.
Bear Put Spread – Buy higher strike put + Sell lower strike put.
Advanced Option Strategies
Iron Condor – Sell OTM call + OTM put, hedge with farther strikes. Good for sideways market.
Butterfly Spread – Combination of multiple calls/puts to profit from low volatility.
Calendar Spread – Buy long-term option, sell short-term option (same strike).
Ratio Spread – Sell multiple options against fewer long options.
Hedging with Options
Options aren’t just for speculation; they’re powerful hedging tools.
Portfolio Hedge: If you own a basket of stocks, buying index puts protects against a market crash.
Currency Hedge: Importers/exporters use currency options to lock exchange rates.
Commodity Hedge: Farmers hedge crops using options to lock minimum prices.

Part 1 Support and ResistanceCall and Put Options in Action
Call Option Example
Reliance is trading at ₹2500.
You buy a 1-month call option with strike price ₹2550, premium ₹50, lot size 505.
If Reliance rises to ₹2700 → Profit = (2700 - 2550 - 50) × 505 = ₹50,500.
If Reliance falls below 2550 → You lose only the premium (₹25,250).
Put Option Example
Nifty is at 20,000.
You buy a 1-month put option, strike 19,800, premium 100, lot size 50.
If Nifty falls to 19,200 → Profit = (19,800 - 19,200 - 100) × 50 = ₹25,000.
If Nifty rises above 19,800 → You lose premium (₹5,000).
Participants in Options Trading
Option Buyer – Pays premium, has limited risk and unlimited profit potential.
Option Seller (Writer) – Receives premium, has limited profit and potentially unlimited risk.
Example:
Buyer of call: Unlimited upside, limited loss (premium).
Seller of call: Limited profit (premium), unlimited loss if stock rises.

Divergence SecretsOption Greeks – The Science Behind Pricing
Options pricing is influenced by multiple factors. These sensitivities are known as the Greeks:
Delta – Measures how much option price changes with stock price.
Gamma – Rate of change of Delta.
Theta – Time decay (options lose value daily).
Vega – Sensitivity to volatility.
Rho – Sensitivity to interest rates.
Example: A call option with Delta = 0.6 means for every ₹10 rise in stock, option premium increases by ₹6.
Basic Option Strategies (Beginner Level)
Buying Calls – Bullish bet.
Buying Puts – Bearish bet.
Covered Call – Hold stock + sell call for extra income.
Protective Put – Own stock + buy put for downside insurance.

Option Trading 1. Introduction to Options Trading
Options trading is one of the most powerful tools in the financial markets. Unlike traditional stock trading, where you buy or sell shares directly, options allow you to control an asset without owning it outright. This gives traders flexibility, leverage, and a wide range of strategies for both profits and risk management.
At its core, an option is a contract that gives the buyer the right, but not the obligation, to buy or sell an underlying asset at a specific price (called the strike price) on or before a certain date (the expiration date).
The beauty of options lies in choice: you can profit whether markets are rising, falling, or even staying flat—if you know how to use them.
2. What is an Option?
An option is a derivative instrument, meaning its value is derived from the price of another asset (the “underlying”), such as:
Stocks (e.g., Reliance, Apple)
Indexes (e.g., Nifty, S&P 500)
Commodities (e.g., Gold, Oil)
Currencies
Two Main Types of Options:
Call Option – Gives the right to buy the underlying asset.
Put Option – Gives the right to sell the underlying asset.
Example:
A call option on Reliance with a strike price of ₹2500 expiring in one month gives you the right (not the obligation) to buy Reliance shares at ₹2500, regardless of the market price.
A put option with a strike of ₹2500 gives you the right to sell at ₹2500.

Algo & Quantitative TradingIntroduction: Trading in the Modern World
Trading has evolved dramatically over the years. From the days of shouting orders in crowded stock exchanges to the modern era of laptops, smartphones, and AI-driven strategies, the financial markets have always been a reflection of both human psychology and technological advancement.
In today’s world, two powerful approaches dominate professional and institutional trading:
Algorithmic Trading (Algo Trading) – where computer programs execute trades based on pre-defined rules.
Quantitative Trading (Quant Trading) – where mathematical models, statistics, and data analysis decide when and how to trade.
Though closely related, these two are not the same. Algo trading focuses on execution speed and automation, while quant trading is about designing profitable models using numbers, probabilities, and logic.
This guide will take you step by step through both concepts—explaining them in simple, human terms while keeping all the depth intact.
Part 1: What is Algorithmic Trading?
The Basics
Algorithmic Trading, or Algo Trading, is when a computer follows a set of instructions (an algorithm) to buy or sell assets in the financial markets. Instead of a trader sitting at a desk watching charts, a machine takes over.
Think of it like teaching a robot:
“If stock A rises above price X, buy 100 shares.”
“If the price falls below Y, sell them immediately.”
The robot will follow these rules without fear, greed, or hesitation.
Why It Exists
Markets move fast—sometimes too fast for humans. Algo trading helps in:
Speed: Computers react in microseconds.
Accuracy: No emotional mistakes.
Scalability: Algorithms can track hundreds of stocks simultaneously.
Real-Life Example
Imagine you want to buy Reliance Industries stock only if its price drops by 2% in a single day. Instead of staring at the screen all day, you set up an algorithm. If the condition is met, the trade executes instantly—even if you’re asleep.
This is algo trading at work.
Part 2: What is Quantitative Trading?
The Basics
Quantitative Trading (Quant Trading) is about designing strategies using math, statistics, and data analysis.
A quant trader doesn’t just say, “Buy when the price goes up.” Instead, they might analyze:
Historical data of 10 years.
Probability of returns under different conditions.
Mathematical models predicting future prices.
Based on these calculations, they create a strategy with an edge.
Why It Exists
Quant trading is powerful because financial markets generate massive amounts of data. Human intuition can’t process it all, but mathematical models can find patterns.
For example:
Do stock prices rise after a company posts quarterly earnings?
What’s the probability that Nifty will fall after 5 consecutive green days?
How do global oil prices impact Indian airline stocks?
Quant traders use such questions to create predictive strategies.
Part 3: Algo vs. Quant Trading
It’s important to understand the difference:
Aspect Algo Trading Quant Trading
Definition Using computer programs to execute trades Using math & data to design strategies
Focus Automation & speed Analysis & probability
Skillset Programming, tech setup Math, statistics, data science
User Retail traders, institutions Hedge funds, investment banks
Goal Execute orders efficiently Build profitable models
In short: Quant trading designs the strategy, and algo trading executes it.
Part 4: Building Blocks of Algo & Quant Trading
1. Data
Everything begins with data. Traders use:
Price data (open, high, low, close, volume).
Fundamental data (earnings, revenue, debt).
Alternative data (Twitter trends, news sentiment).
2. Strategy
You need a clear set of rules:
Trend-following: Buy when the price is rising.
Mean reversion: Sell when the price is too high compared to average.
Arbitrage: Profit from small price differences across markets.
3. Backtesting
Before risking real money, traders test strategies on historical data.
If it worked in the past, it might work in the future.
But beware of overfitting (a model that works too well on old data but fails in real time).
4. Execution
The algo takes the quant model and executes trades in real-time with perfect discipline.
5. Risk Management
No system is perfect. Every strategy must have rules for:
Stop-loss (cutting losses).
Position sizing (how much money per trade).
Diversification (not putting all eggs in one basket).
Part 5: Types of Algo & Quant Strategies
Trend Following
“The trend is your friend.”
Example: If Nifty50 crosses its 200-day moving average, buy.
Mean Reversion
Prices always return to average.
Example: If stock falls 5% below its 20-day average, buy.
Arbitrage
Exploiting small price differences.
Example: Buying gold in India and selling in the US if price gap exists.
Statistical Arbitrage
Using correlations between assets.
Example: If Infosys and TCS usually move together but Infosys falls more, buy Infosys.
High-Frequency Trading (HFT)
Ultra-fast trades in microseconds.
Mostly done by big institutions.
Market Making
Providing liquidity by constantly quoting buy/sell prices.
Earns from the spread (difference between buy & sell price).
Part 6: The Human Side of Algo & Quant Trading
Advantages
Emotionless Trading: No fear or greed.
24/7 Monitoring: Algorithms don’t need sleep.
Scalability: Can track hundreds of markets.
Speed: Reaction in microseconds.
Disadvantages
Over-Optimization: Models may look good on paper but fail in real life.
Technical Risk: Server crash, internet issues, coding errors.
Market Risk: Black swan events (like COVID-19 crash) break models.
Competition: Big firms with better technology dominate.
Part 7: Skills Needed for Algo & Quant Trading
Programming: Python, R, C++, SQL.
Math & Statistics: Probability, regression, time series.
Finance Knowledge: Markets, assets, instruments.
Risk Management: Understanding drawdowns and volatility.
Critical Thinking: Testing, improving, adapting strategies.
Part 8: Real-World Applications
Retail Traders: Use algo bots to execute simple strategies.
Hedge Funds: Rely on complex quant models for billions of dollars.
Banks: Use algorithms for forex and bond trading.
Crypto Market: Bots dominate trading on exchanges like Binance.
Part 9: Future of Algo & Quant Trading
The field is evolving rapidly with:
Artificial Intelligence: Machines learning patterns without explicit coding.
Machine Learning: Predicting stock moves using massive data.
Big Data: Using social media, weather, and even satellite images for trading.
Blockchain & Crypto: Automated bots running 24/7 in decentralized markets.
Conclusion
Algo & Quant Trading is not about replacing humans—it’s about augmenting human intelligence with machines. Humans still design strategies, understand risks, and set goals. Machines simply execute with precision.
For small traders, algo trading can bring discipline and automation. For large institutions, quant trading offers data-driven profits.
The future belongs to those who can combine mathematics, programming, and financial insight—because markets are not just numbers, they are reflections of human behavior expressed through data.
Risk Smart, Grow Fast (Small Account Trading)Introduction
Most traders dream of becoming full-time, financially free traders. But there’s a common challenge: many start with small accounts. When you have a small account, every dollar matters, and one bad trade can wipe out weeks or months of progress. At the same time, you want to grow your account quickly.
This creates a tough balance: How do you grow fast without blowing up your account?
The answer lies in being risk smart. Trading is not about taking the biggest bets; it’s about protecting your capital while allowing your money to grow steadily. The smaller the account, the more discipline and precision you need.
In this guide, we’ll explore everything you need to know about small account trading, from psychology and risk management to strategies, tools, and growth plans.
Chapter 1: The Psychology of a Small Account
Trading a small account is more mental than technical. Let’s face it:
A $100 profit may look tiny compared to the big players making thousands per day.
Losses feel heavier because you have less cushion.
Impatience is stronger—you want to grow fast.
Here are some psychological traps:
Overtrading: You feel like you must take every trade to “make it big.”
Revenge Trading: After a loss, you double down to recover quickly.
Comparing with others: Seeing other traders’ big profits makes you greedy.
Fear of missing out (FOMO): You jump into trades without analysis because you don’t want to “miss the move.”
👉 The key mindset: Small gains compound into big growth. If you focus on risk management and consistency, your account will grow—not overnight, but steadily.
Chapter 2: Why Small Accounts Blow Up
Let’s talk honestly. Most small accounts don’t survive because traders break these rules:
Too much risk per trade (risking 20–50% of the account).
No stop-loss, leading to one trade wiping everything out.
Chasing unrealistic returns, expecting to double the account in a week.
Ignoring fees & commissions (especially in options or futures).
Trading without a plan—just reacting to charts.
For a small account, survival is victory. If you survive, you get time to grow. If you blow up, game over.
Chapter 3: The Risk Smart Formula
When you trade small accounts, risk is your shield. Here’s a simple formula:
Risk 1–2% of your account per trade.
Example: On a $500 account, risk only $5–$10 per trade.
That way, 10 losing trades in a row won’t kill your account.
Use stop-loss orders always.
Decide your maximum loss before entering.
Don’t move stops because of “hope.”
Focus on high-probability setups.
Don’t trade every move. Trade only when risk/reward is clear (at least 1:2 or 1:3).
Position sizing is everything.
If your stop-loss is $0.50 and you can risk $10, buy only 20 shares.
Adjust size to protect capital.
This is how small traders survive long enough to grow.
Chapter 4: The Power of Compounding
Small gains look boring—but they multiply.
Example:
If you make just 2% per week, on a $1,000 account, that’s $20/week.
In one year, it grows to $2,700+.
In five years, it becomes $30,000+.
This is the hidden power of being risk smart. While others blow up accounts chasing 100% returns, you quietly build wealth.
Chapter 5: Strategies for Small Accounts
Now, let’s look at practical strategies you can use.
1. Scalping & Day Trading
Take small, quick profits (0.5%–2% per trade).
Works well because small accounts can’t handle long drawdowns.
Best in liquid stocks or indices (Nifty, Bank Nifty, SPY, AAPL, etc.).
2. Swing Trading
Hold trades for a few days to weeks.
Good if you can’t sit in front of screens all day.
Focus on strong trends and tight risk.
3. Options Trading (Careful!)
Options allow leverage, which is good for small accounts.
But they’re risky if you don’t manage size.
Use defined-risk strategies like debit spreads or buying calls/puts with small capital.
4. Futures / Micro Contracts
Some markets offer micro futures (like Micro E-mini S&P).
They let small accounts trade big markets with low risk.
5. Focus on One Setup
Small account traders shouldn’t try 10 strategies.
Pick one high-probability pattern (breakouts, pullbacks, VWAP bounces, etc.).
Master it.
Chapter 6: The Growth Blueprint
Here’s a step-by-step growth plan for a $500–$2,000 account.
Stage 1: Survival (First 3–6 months)
Goal: Don’t blow up.
Focus on risk control and discipline.
Take small positions, learn patterns, and build consistency.
Stage 2: Consistency (6–12 months)
Goal: Be profitable monthly.
Focus on taking only A+ setups.
Increase position size slowly.
Stage 3: Scaling (1–3 years)
Goal: Grow account steadily.
Reinvest profits back.
Gradually add more size once consistent.
Stage 4: Freedom (3+ years)
Goal: Trade for living.
Now the account is large enough to provide income.
Chapter 7: Tools Every Small Account Trader Needs
Broker with low commissions: Fees eat small accounts alive.
Charting platform: TradingView, ThinkOrSwim, Zerodha Kite.
Stop-loss automation: Never rely on “mental stops.”
Journal: Track every trade (why you entered, risk, result).
Risk calculator: Helps decide position size.
Chapter 8: Risk Smart Habits
Always pre-plan trades (entry, stop, target).
Avoid over-leverage.
Respect stop-loss like a religion.
Don’t trade to “make money fast.” Trade to protect capital.
Review weekly: Look at what worked, what didn’t.
Chapter 9: Case Studies
Trader A: Greedy Approach
Account: $1,000
Risk per trade: $200 (20%).
Lost 3 trades in a row → account down to $400.
Tried revenge trading → account blown in 1 month.
Trader B: Risk Smart
Account: $1,000
Risk per trade: $10 (1%).
Trades 50 times in 3 months.
Wins 30 trades with 1:2 risk/reward.
End result: $1,300 account (30% growth).
Still alive, compounding.
👉 Which trader has a future? Clearly, Trader B.
Chapter 10: How to Grow Fast Without Blowing Up
Here’s the balance you’re looking for:
Trade high-probability setups only.
Add leverage carefully. Start small, increase size only when consistent.
Withdraw profits rarely. Reinvest to compound faster.
Diversify income streams. Don’t rely only on one style (maybe mix swing & options).
Conclusion
Small account trading is tough—but not impossible.
The secret is to be risk smart: protect your capital, take small but consistent gains, and avoid greed. By doing this, you’ll build discipline, confidence, and a growing account.
The formula is simple:
Risk small.
Stay consistent.
Compound gains.
Grow fast—but safely.
Remember: You don’t have to trade big to trade smart. But if you trade smart, one day you’ll trade big.

How to Read Price ActionIntroduction
Price Action (PA) is the art and science of reading market movement directly from price charts, without over-reliance on lagging indicators. Professional traders, institutional players, and prop firms often emphasize price action because it reflects the pure psychology of buyers and sellers.
Unlike trading based on technical indicators, price action trading relies on raw market data: candlesticks, support & resistance levels, chart structures, and volume context.
Learning to read price action is like learning a new language — once you master it, you can understand what the market is saying at any given moment.
Chapter 1: What is Price Action?
Price Action refers to analyzing the actual price movement of a financial instrument over time.
It does not depend on moving averages, oscillators, or complex indicators.
It studies patterns, trends, support/resistance zones, candlestick formations, and order flow behavior.
The ultimate goal is to understand the story behind each price move: who is in control (buyers or sellers), and where the next move might head.
Key Idea: Price action is the footprint of money. When large institutions buy or sell, they leave traces on the chart — PA traders learn to read these footprints.
Chapter 2: Why Read Price Action?
Clarity – It removes clutter from charts.
Universal Language – Works across all markets (stocks, forex, commodities, crypto).
Flexibility – Adapts to all timeframes, from scalping 1-min charts to investing on weekly charts.
Real-Time Decisions – Price action reacts instantly, unlike lagging indicators.
Psychology-Based – Helps traders understand market sentiment: fear, greed, indecision.
Chapter 3: Core Building Blocks of Price Action
Before diving into strategies, you need to master the foundations:
3.1 Candlesticks
Candlesticks are the backbone of price action. Each candle tells a story:
Open, High, Low, Close (OHLC) show how price moved within that time frame.
Long wicks = rejection.
Long body = strong momentum.
Small body = indecision.
3.2 Market Structure
Higher Highs & Higher Lows (HH, HL) = Uptrend.
Lower Highs & Lower Lows (LH, LL) = Downtrend.
Sideways movement = Consolidation.
3.3 Support and Resistance (S/R)
Support: A price level where buying pressure often appears.
Resistance: A price level where selling pressure often emerges.
These zones are not exact prices, but areas.
3.4 Trendlines & Channels
Connecting swing highs/lows creates visual guides.
Channels highlight when price is moving within a range.
3.5 Volume (Optional but Powerful)
Volume confirms price moves — high volume validates breakouts, while low volume signals weak trends.
Chapter 4: Candlestick Price Action Patterns
4.1 Reversal Patterns
Pin Bar (Hammer, Shooting Star): Signals rejection at support/resistance.
Engulfing Candle: Strong shift in momentum (bullish or bearish).
Morning Star / Evening Star: Trend reversal confirmation.
4.2 Continuation Patterns
Inside Bar: Market is pausing; breakout is likely.
Flag & Pennant: Small correction before continuation.
Marubozu: Strong conviction candle.
4.3 Indecision Patterns
Doji: Balance between buyers and sellers.
Spinning Top: Low conviction, sideways market.
Lesson: Candlestick patterns only matter in the right context (support, resistance, trend zones).
Chapter 5: Understanding Market Phases
Price moves in cycles:
Accumulation Phase: Smart money buys quietly, market moves sideways.
Markup Phase: Strong uptrend begins (higher highs & higher lows).
Distribution Phase: Smart money sells to late buyers, price moves sideways again.
Markdown Phase: Downtrend begins (lower highs & lower lows).
Price action traders learn to spot transitions between phases.
Chapter 6: Reading Trends
Uptrend: Look for buying opportunities on pullbacks.
Downtrend: Look for selling opportunities on retracements.
Range-bound: Focus on support/resistance rejections.
Golden Rule: Trade with the trend until price clearly shows reversal signs.
Chapter 7: Breakouts & Fakeouts
Breakout: Price moves beyond key support/resistance with momentum.
Fakeout (False Break): Price breaks a level but quickly reverses.
Pro Tip: Watch volume + candle close for real confirmation.
Chapter 8: Price Action Trading Strategies
Here are practical strategies traders use:
8.1 Breakout Trading
Identify consolidation → Wait for breakout → Enter with momentum.
Example: Range breakout, Triangle breakout.
8.2 Pullback Trading
Enter in the direction of trend after a retracement.
Example: Price bounces off support in uptrend.
8.3 Reversal Trading
Spot exhaustion patterns (Pin Bars, Engulfing) near major S/R zones.
Requires patience and confirmation.
8.4 Supply and Demand Zones
Supply = institutional sell zones.
Demand = institutional buy zones.
Price often reacts strongly when revisiting these levels.
Chapter 9: The Psychology Behind Price Action
Every candle reflects human psychology:
Long bullish candle: Strong buyer confidence.
Long bearish candle: Panic selling or strong bearish conviction.
Doji: Confusion / indecision.
Breakouts: Fear of missing out (FOMO) + herd mentality.
Price action is a visual representation of trader emotions.
Chapter 10: Common Mistakes in Reading Price Action
Overcomplicating the chart – Too many lines, patterns, or zones.
Ignoring market context – A bullish candle in a downtrend is weak.
Chasing trades – Entering late after breakout.
Forcing patterns – Seeing patterns that don’t exist.
Neglecting risk management – PA gives entries, but stops are crucial.
Conclusion
Reading price action is not about memorizing patterns, but understanding the story behind the charts. It’s about seeing the battle between buyers and sellers and aligning with the winning side.
Once you master candlesticks, support/resistance, trends, and psychology, price action becomes a powerful weapon that can work in any market, on any timeframe.
The path is long, but with discipline, patience, and practice, you can become fluent in the language of price action.
Trading Master Class With ExpertsTips for Beginners in Options Trading
Start with buying calls/puts before selling.
Trade liquid instruments like Nifty/Bank Nifty.
Learn Greeks slowly, don’t jump into complex strategies.
Avoid naked option selling without hedging.
Paper trade before risking real capital.
Role of Volatility in Options
Volatility is the lifeblood of options.
High Volatility = Expensive Premiums.
Low Volatility = Cheap Premiums.
Traders often use Implied Volatility (IV) to decide whether to buy (when IV is low) or sell (when IV is high).
Mastering Options
Options are like a Swiss Army Knife of trading—one tool with multiple uses: speculation, hedging, and income generation. But with great power comes great responsibility.
To succeed in options trading:
Understand the basics thoroughly.
Start small and simple.
Master risk management.
Use strategies suited to your market outlook.
Keep emotions under control.
With practice and discipline, options can become a game-changer in your trading journey.

Part 6 Learn Institutional TradingOptions in Indian Markets
In India, options are traded on NSE and BSE, primarily on:
Index Options: Nifty, Bank Nifty (most liquid).
Stock Options: Reliance, TCS, Infosys, etc.
Weekly Expiry: Every Thursday (Nifty/Bank Nifty).
Lot Sizes: Fixed by exchanges (e.g., Nifty = 50 units).
Practical Example – Nifty Options Trade
Scenario:
Nifty at 20,000.
You expect big movement after RBI policy.
Strategy: Buy straddle (20,000 call + 20,000 put).
Cost = ₹200 (call) + ₹180 (put) = ₹380 × 50 = ₹19,000.
If Nifty moves to 20,800 → Call worth ₹800, Put worthless. Profit = ₹21,000.
If Nifty stays at 20,000 → Both expire worthless. Loss = ₹19,000.
Option Trading Psychology
Patience: Many options expire worthless, don’t chase every trade.
Discipline: Stick to stop-loss and position sizing.
Avoid Greed: Sellers earn small consistent income but risk blow-up if careless.
Stay Informed: News, earnings, and events impact volatility.

Part 1 Ride The Big Moves Call and Put Options in Action
Call Option Example
Reliance is trading at ₹2500.
You buy a 1-month call option with strike price ₹2550, premium ₹50, lot size 505.
If Reliance rises to ₹2700 → Profit = (2700 - 2550 - 50) × 505 = ₹50,500.
If Reliance falls below 2550 → You lose only the premium (₹25,250).
Put Option Example
Nifty is at 20,000.
You buy a 1-month put option, strike 19,800, premium 100, lot size 50.
If Nifty falls to 19,200 → Profit = (19,800 - 19,200 - 100) × 50 = ₹25,000.
If Nifty rises above 19,800 → You lose premium (₹5,000).
Participants in Options Trading
Option Buyer – Pays premium, has limited risk and unlimited profit potential.
Option Seller (Writer) – Receives premium, has limited profit and potentially unlimited risk.
Example:
Buyer of call: Unlimited upside, limited loss (premium).
Seller of call: Limited profit (premium), unlimited loss if stock rises.
